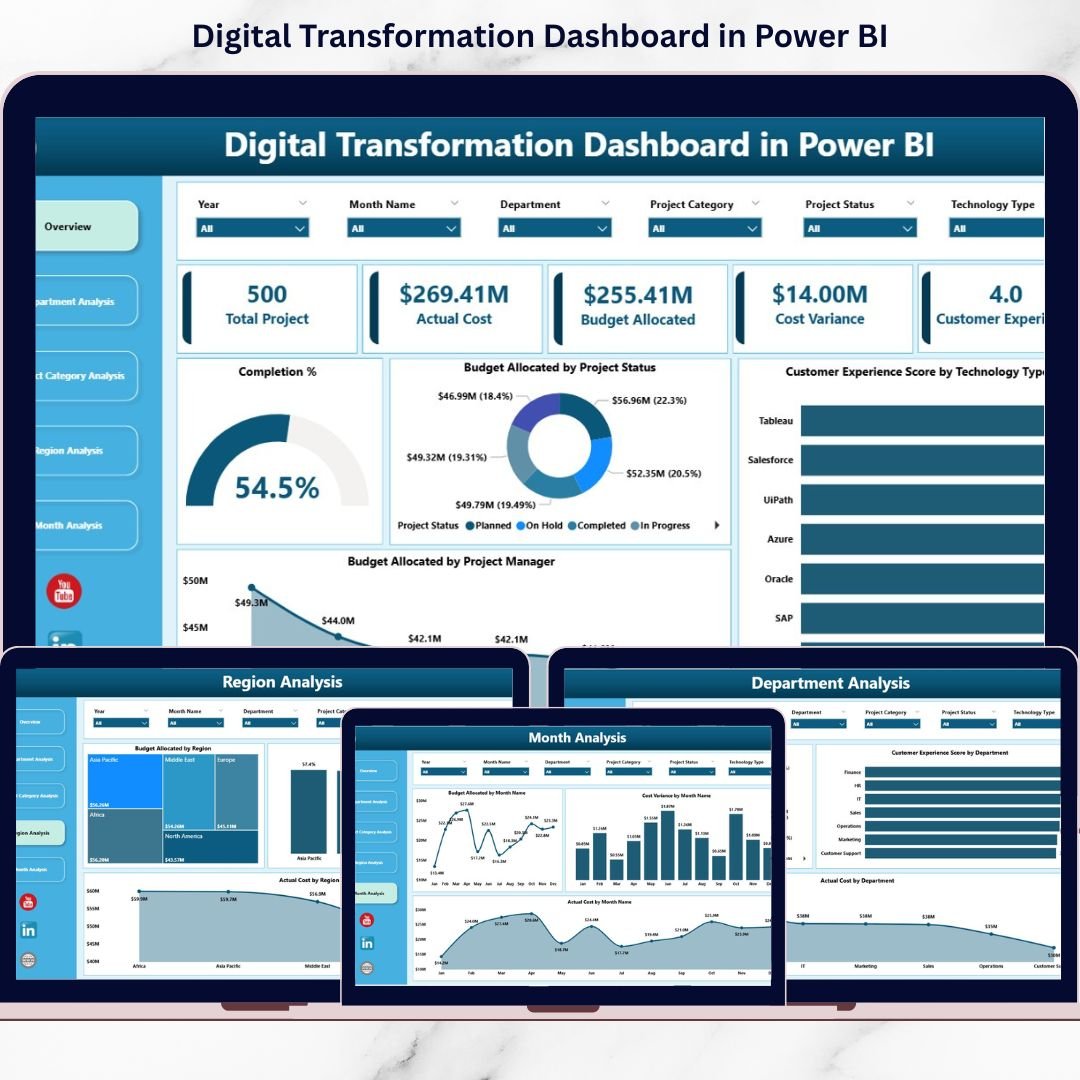
Instead of relying on scattered spreadsheets, the Digital Transformation Dashboard in Power BI centralizes everything into one powerful, interactive command center.
Track budgets.
Monitor completion %.
Analyze cost variance.
Measure customer experience impact.
All in real time. 🚀📊
🚀 Key Feature of Digital Transformation Dashboard in Power BI
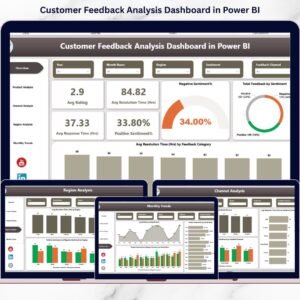
📊 5 Interactive Analytical Pages
Monitor performance across Overview, Department, Project Category, Region, and Month analysis.
🎯 Real-Time KPI Cards
Instantly track Completion %, Budget, Actual Cost, Cost Variance, and CX Score.
💰 Budget vs Actual Monitoring
Identify overspending before it becomes a problem.
📈 Completion % Tracking by Department & Region
Measure execution efficiency clearly.
⭐ Customer Experience Score Monitoring
Align digital investment with real customer impact.
🌍 Region-Level Comparison
Evaluate global transformation performance side by side.
📅 Monthly Trend Analysis
Detect cost spikes and performance shifts quickly.
🎛 Dynamic Slicers & Drill-Down
Filter by Department, Region, Project Category, Status, or Month instantly.
⚡ Real-Time Data Refresh
Update data and see insights immediately.
📦 What’s Inside the Digital Transformation Dashboard in Power BI
This ready-to-use Power BI solution includes 5 powerful pages:
1️⃣ Overview Page – The Executive Command Center
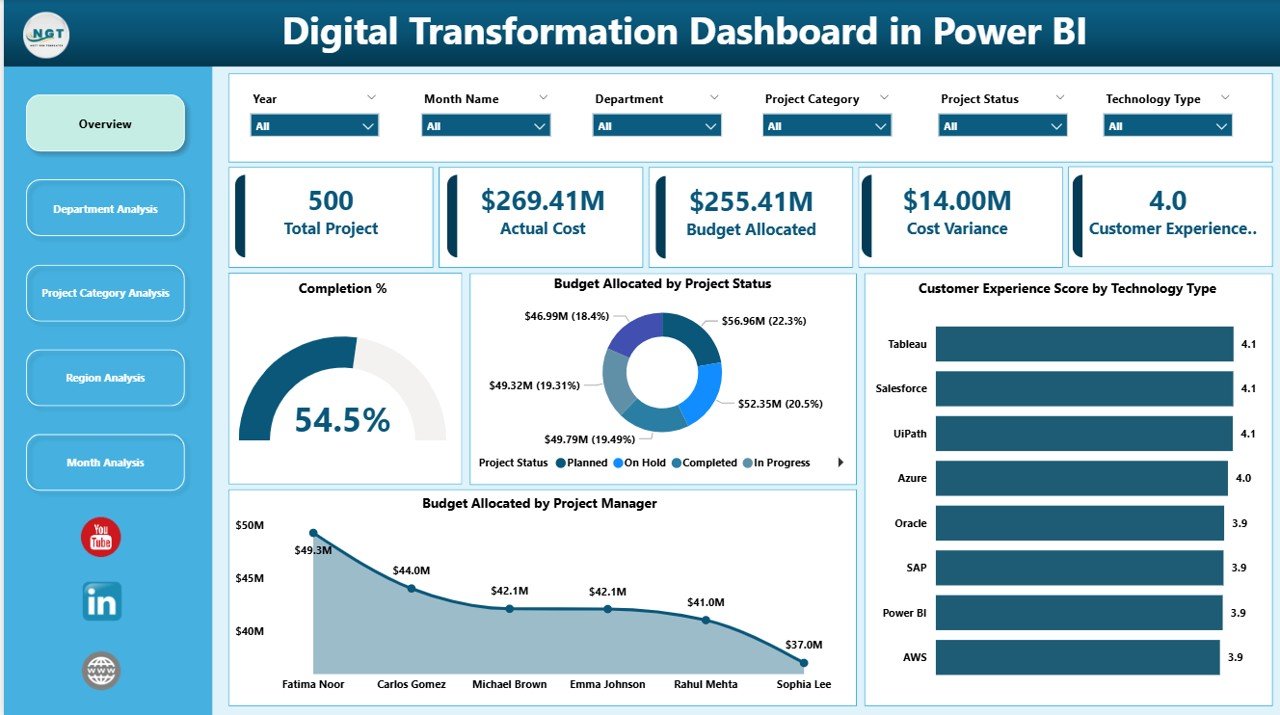
✔ 5 KPI Cards:
-
Completion %
-
Total Budget Allocated
-
Actual Cost
-
Cost Variance
-
Customer Experience Score
✔ Budget by Project Status (Completed, In Progress, Delayed, On Hold)
✔ Customer Experience Score by Technology Type
✔ Budget Allocation by Project Manager
✔ Interactive slicers for dynamic filtering
This page delivers instant board-level visibility.
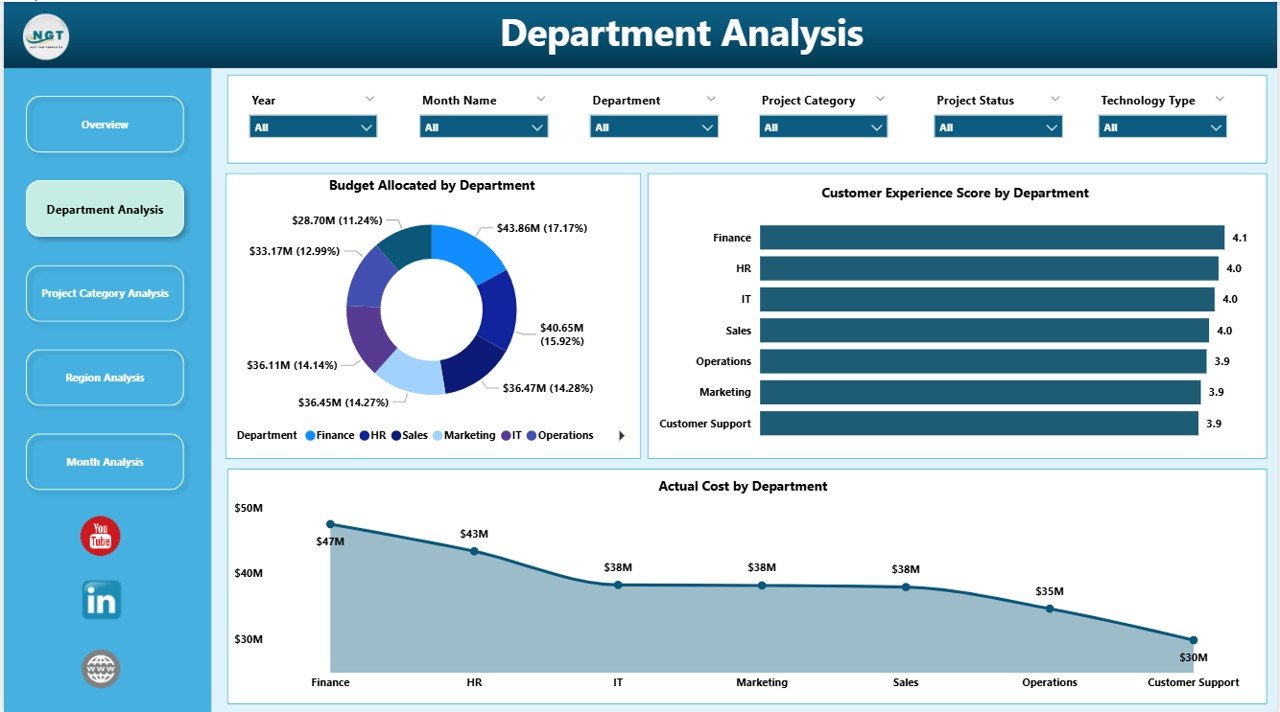
2️⃣ Department Analysis
✔ Budget Allocated by Department
✔ Customer Experience Score by Department
✔ Actual Cost by Department
Identify high-performing departments and detect overspending quickly.
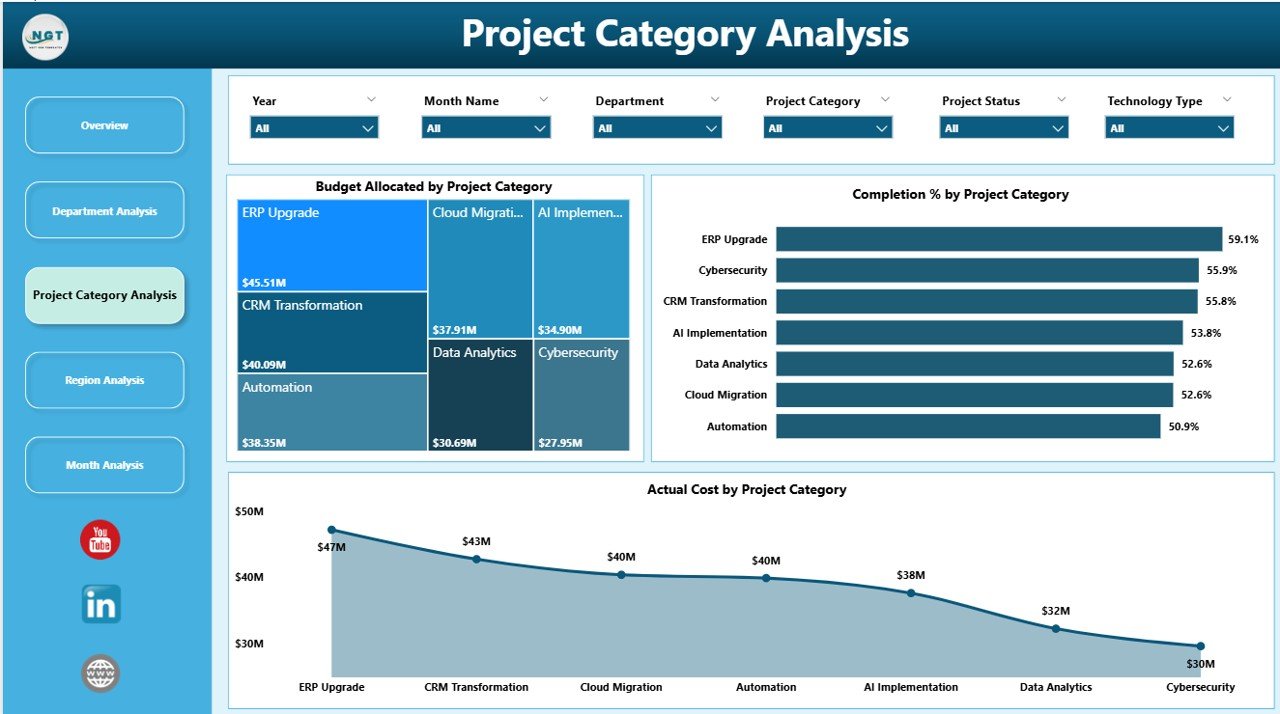
3️⃣ Project Category Analysis
✔ Budget by Project Category
✔ Completion % by Category
✔ Actual Cost by Category
Evaluate Cloud Migration, AI, ERP, Automation, and Cybersecurity initiatives clearly.
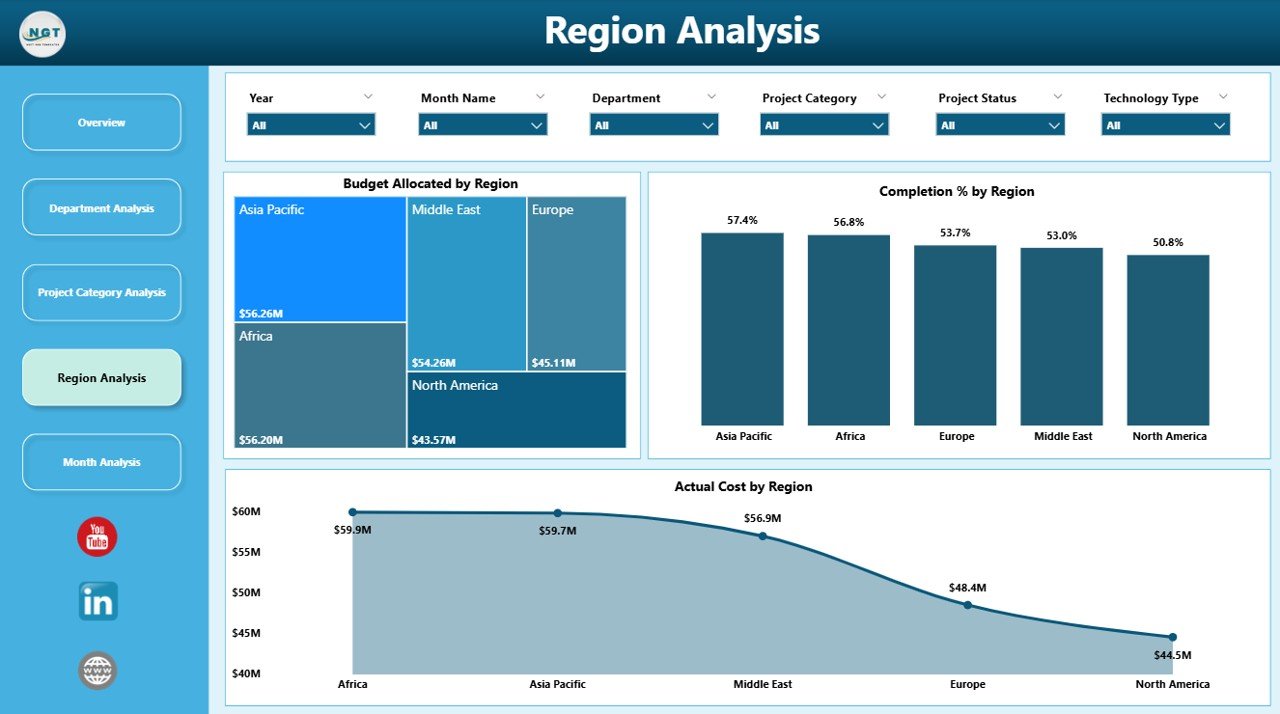
4️⃣ Region Analysis
✔ Budget Allocated by Region
✔ Completion % by Region
✔ Actual Cost by Region
Compare digital maturity across geographic locations.
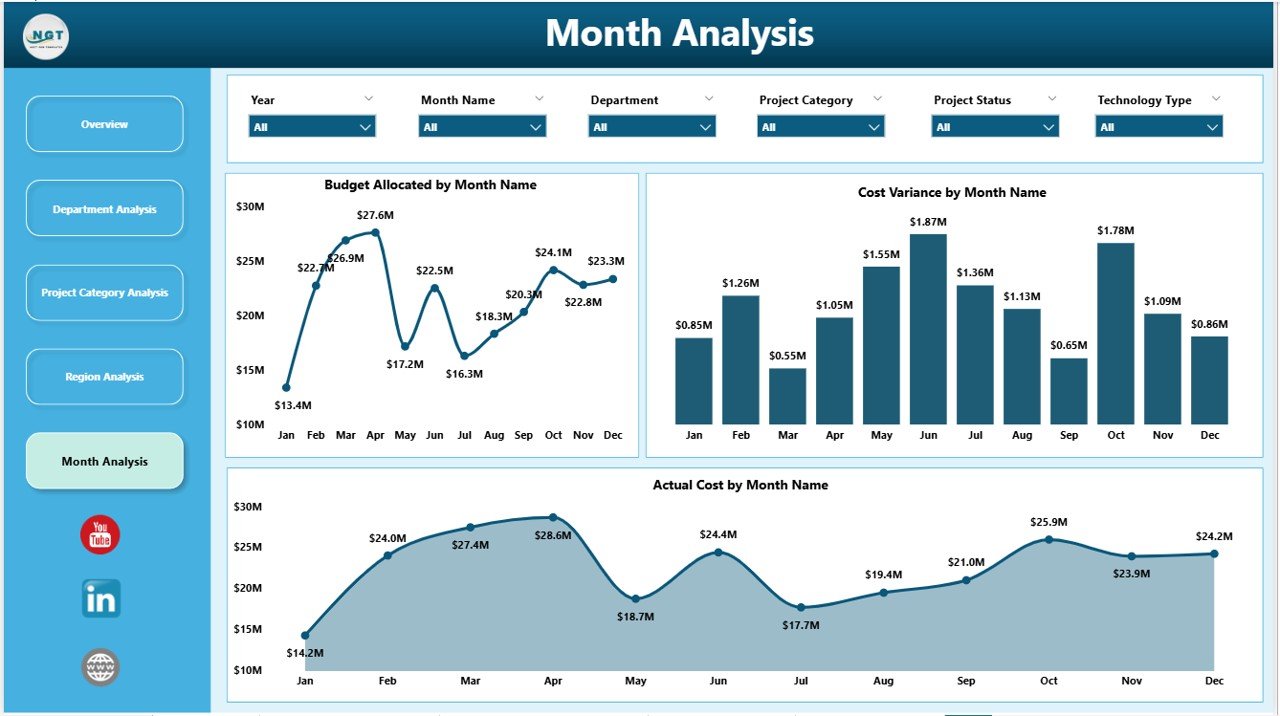
5️⃣ Month Analysis
✔ Budget by Month
✔ Actual Cost by Month
✔ Cost Variance by Month
Track trends, forecast expenses, and maintain financial discipline.
🛠 How to Use the Digital Transformation Dashboard in Power BI
Getting started is simple:
1️⃣ Structure project data in Excel
2️⃣ Import into Power BI
3️⃣ Define relationships and KPI measures
4️⃣ Refresh data regularly
5️⃣ Start with Overview page
6️⃣ Drill into Department, Region, or Category analysis
7️⃣ Use insights to guide strategic decisions
No guesswork. Just actionable intelligence.
👥 Who Can Benefit from This Digital Transformation Dashboard in Power BI
This dashboard is ideal for:
👨💼 CIOs & CTOs
📊 Digital Transformation Leaders
📈 Project Managers
💰 Finance Managers
🌍 Regional Directors
🧠 Strategy Teams
If your organization manages multiple digital initiatives, this dashboard becomes essential.
Why This Dashboard Drives Transformation Success
When you track:
-
Completion %
-
Budget Allocation
-
Actual Cost
-
Cost Variance
-
Customer Experience Score
-
Regional Performance
-
Monthly Trends
You gain:
✔ Faster executive decisions
✔ Stronger budget control
✔ Better accountability
✔ Early risk detection
✔ Improved strategic alignment
✔ Measurable ROI
Transformation stops being chaotic. It becomes controlled and predictable.
How It Improves Strategic Planning
Because this dashboard combines:
Financial metrics
Operational progress
Customer impact
Regional comparison
Leaders can:
-
Allocate budgets smarter
-
Prioritize high-impact initiatives
-
Support underperforming regions
-
Reduce cost variance
-
Improve customer satisfaction
Clear visibility leads to stronger transformation outcomes.
Click here to read the Detailed blog post
Visit our YouTube channel to learn step-by-step video tutorials
YouTube Channel