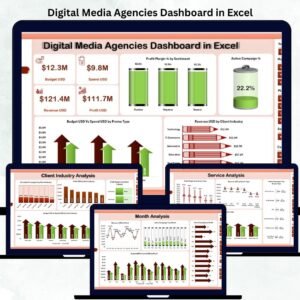
Digital media agencies manage fast-paced campaigns, multiple client industries, budget distribution, promotions, ad spend, and performance metrics every single day. When these numbers sit in scattered sheets, it becomes difficult to monitor performance accurately. That’s why this Digital Media Agencies Dashboard in Excel gives you one smart, powerful, and easy-to-use solution. It converts digital marketing data into clean visuals, interactive KPIs, and actionable insights that agency teams can use instantly.
Whether you’re handling social media campaigns, paid promotions, influencer programs, email marketing, or industry-specific digital initiatives, this dashboard lets you track everything without complicated tools. With five feature-rich analytical pages, navigators, slicers, and dynamic charts, this Excel dashboard becomes an essential performance monitoring tool for any digital agency.
This template works for agencies of all sizes — freelancers, boutique agencies, enterprise-level marketing teams, and cross-functional digital departments.
📦 What’s Inside the Digital Media Agencies Dashboard in Excel
This dashboard includes five analytical pages and two support sheets. Each page features a right-side slicer panel so you can filter data quickly by campaign type, service type, month, promo type, or client industry.
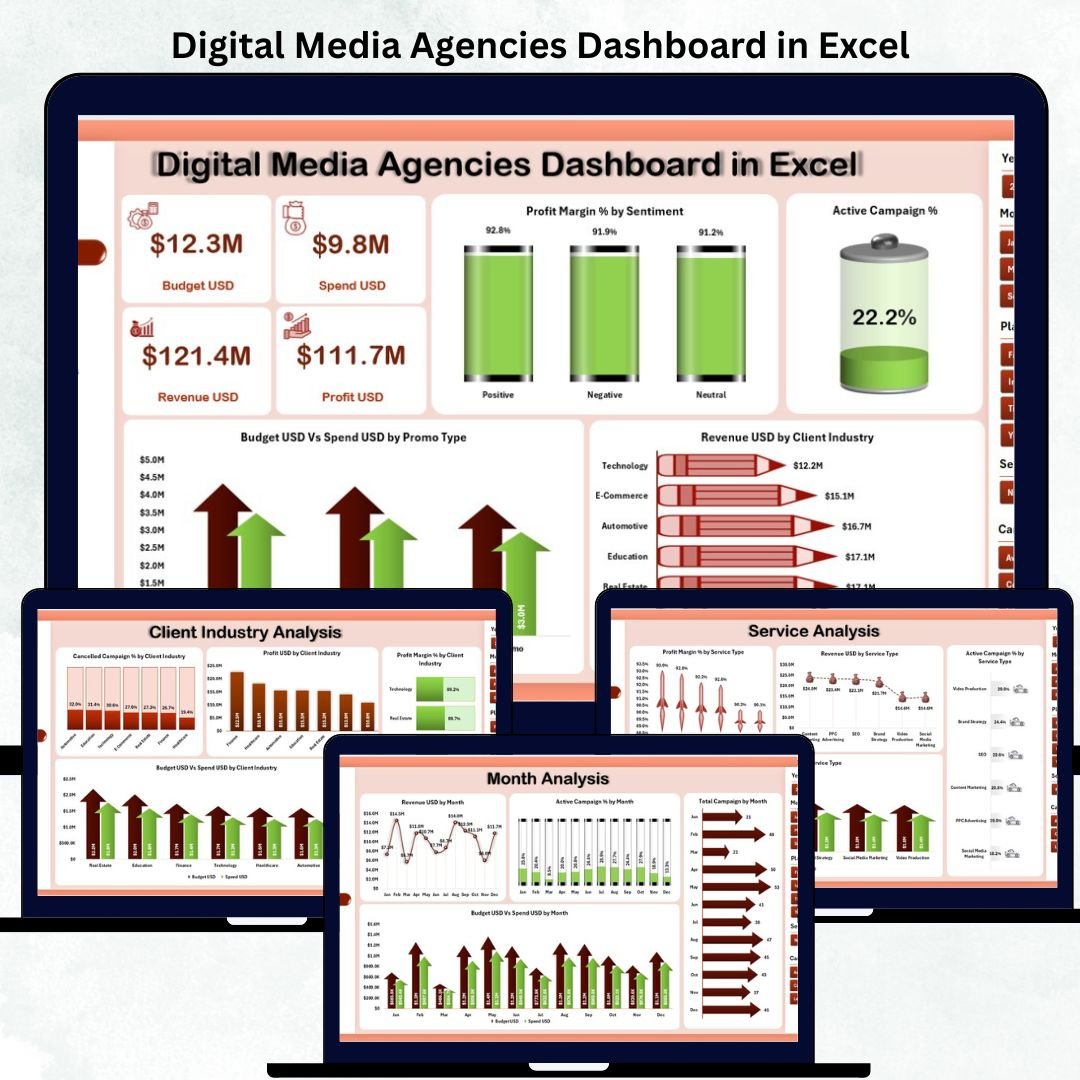
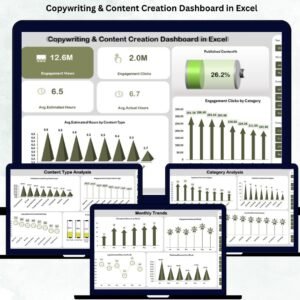
⭐ 1. Overview Page – Your Complete Agency Snapshot
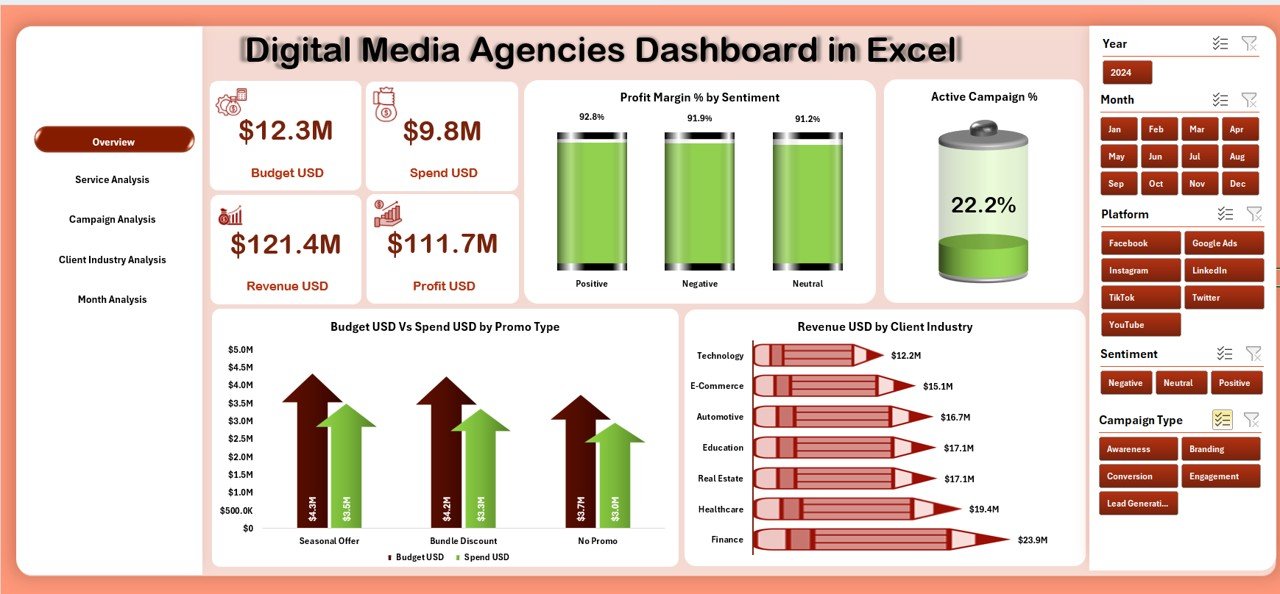
The Overview Page is the heartbeat of your dashboard. It brings together the most important KPIs and visuals in one place.
This page includes:
-
Right-side slicer
-
5 KPI cards
-
4 core analytical charts
Charts displayed:
-
Profit Margin % by Sentiment
-
Active Campaign %
-
Budget (USD) vs Spend (USD) by Promo Type
-
Revenue (USD) by Client Industry
This page gives an instant understanding of campaign performance, client industry revenue, budget utilization, and profitability.
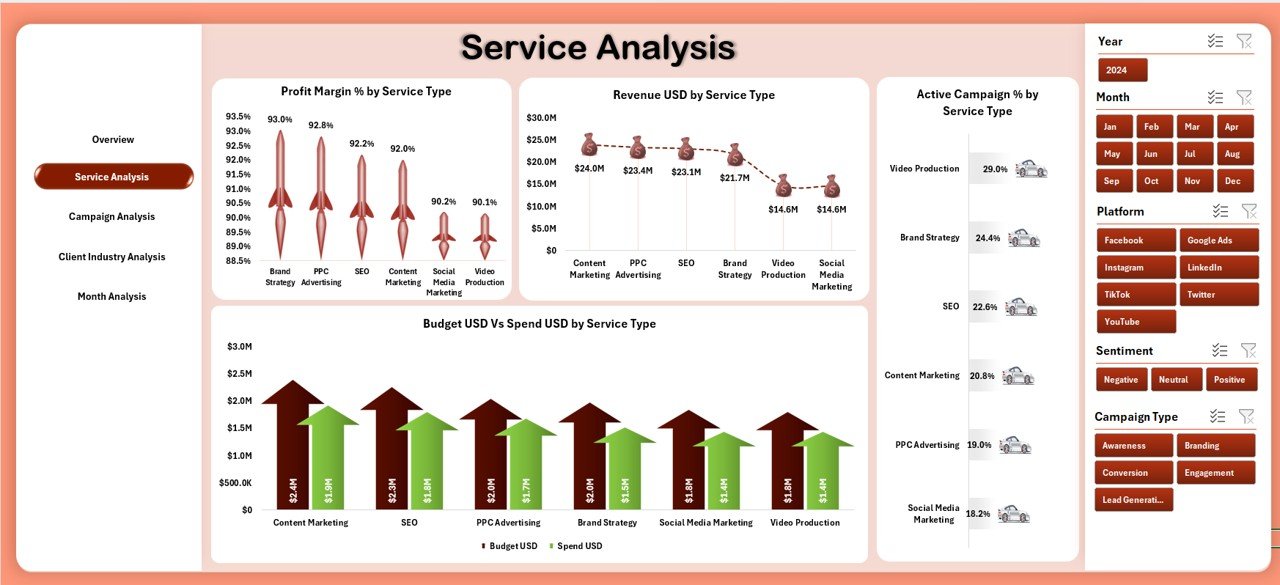
⭐ 2. Service Analysis Page – Understand Performance by Service Type
Digital media agencies offer multiple services such as SEO, social media, PPC, creative design, video production, influencer campaigns, and more. This page helps you compare them easily.
Charts displayed:
-
Profit Margin % by Service Type
-
Revenue (USD) by Service Type
-
Active Campaign % by Service Type
-
Spend (USD) by Promo Type & Revenue (USD) by Service Type
You can quickly identify profitable services, high-demand services, and areas requiring improvement or additional resources.
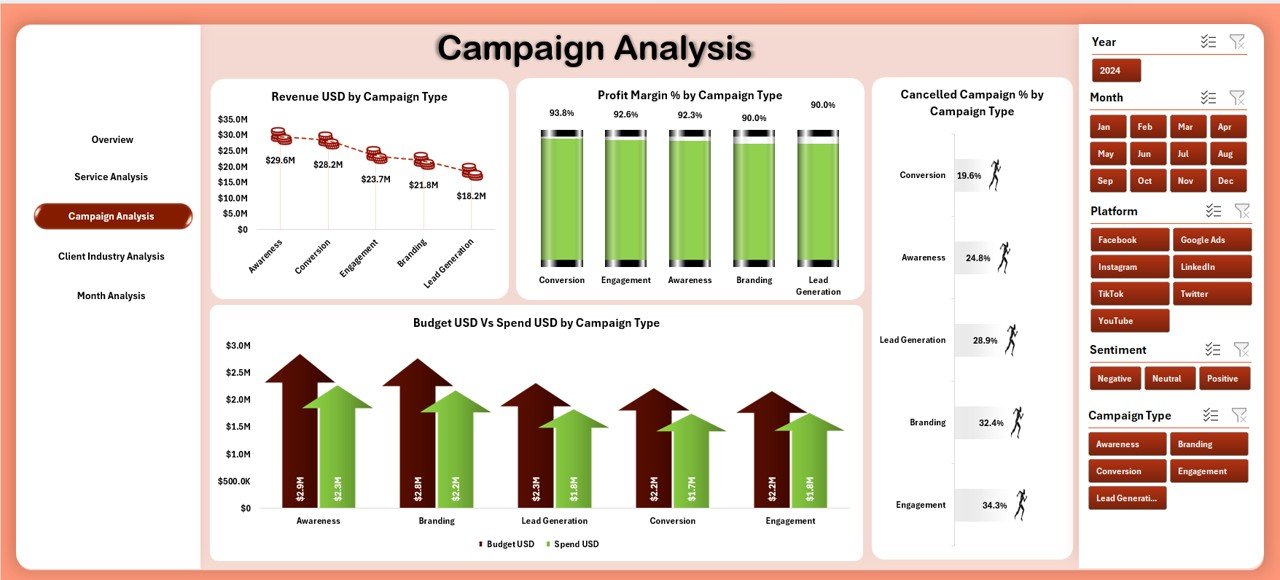
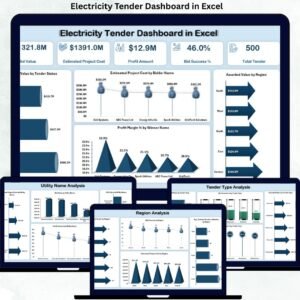
⭐ 3. Campaign Analysis Page – Track Campaign Type Efficiency
Different campaign types — brand awareness, lead generation, conversion ads, retargeting, content campaigns, etc. — perform differently.
Charts displayed:
-
Profit Margin % by Campaign Type
-
Revenue (USD) by Campaign Type
-
Cancelled Campaign % by Campaign Type
-
Spend (USD) by Promo Type & Revenue (USD) by Campaign Type
This page helps you identify low-performing campaign categories and optimize strategy across different digital channels.
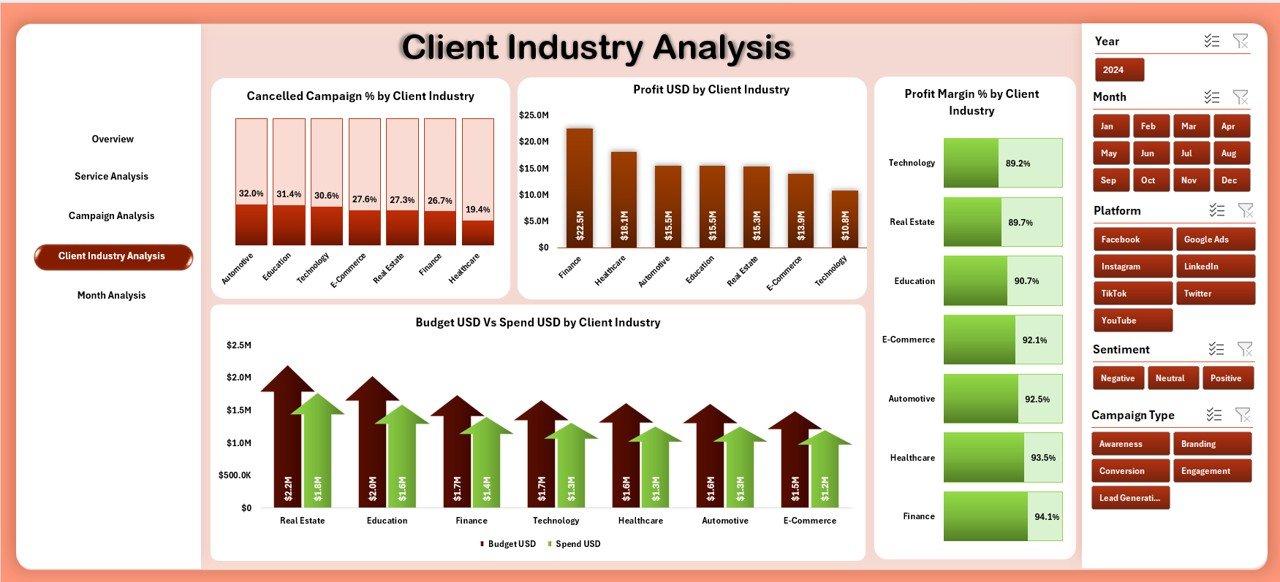
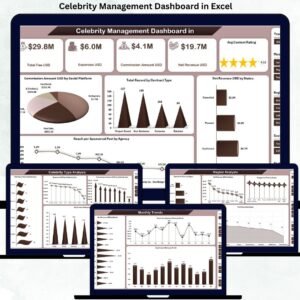
⭐ 4. Client Industry Analysis Page – Discover Industry-Wise Trends
Agencies work with multiple industries such as finance, retail, health, hospitality, real estate, technology, and education. Each industry behaves differently.
Charts displayed:
-
Profit Margin % by Client Industry
-
Cancelled Campaign % by Client Industry
-
Spend (USD) by Promo Type
-
Revenue & Profit (USD) by Client Industry
This allows agencies to forecast client budgets, understand industry behavior, and focus efforts on high-value segments.
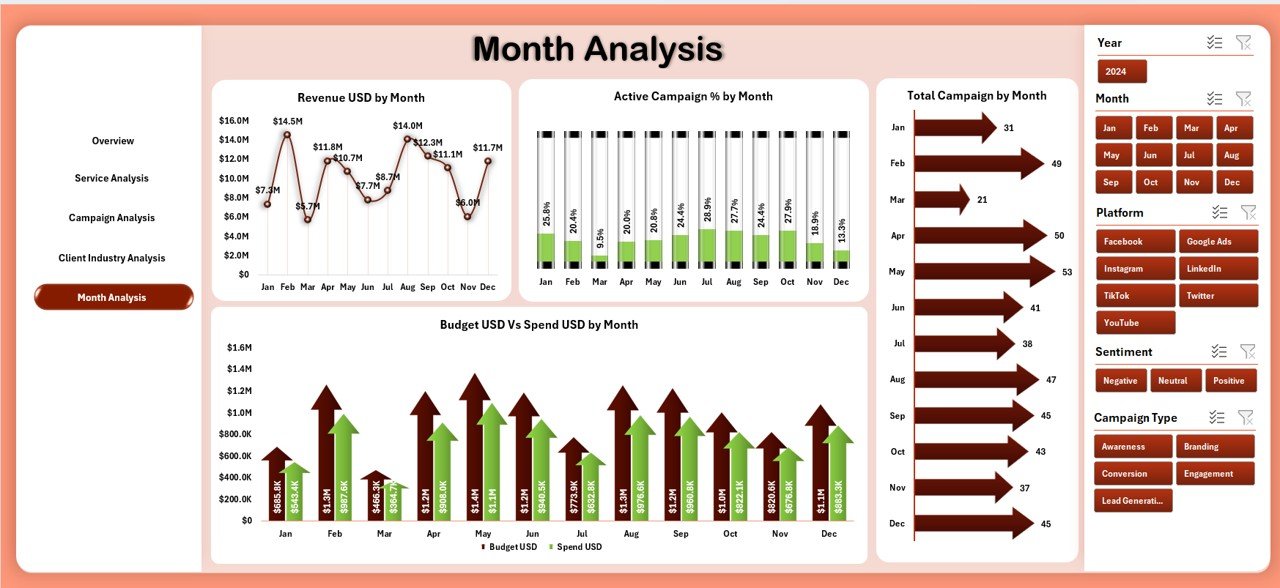
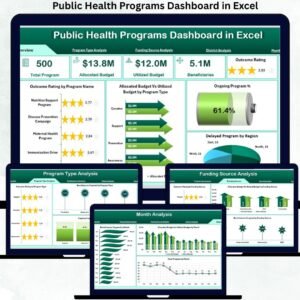
⭐ 5. Month Analysis Page – Identify Monthly Marketing Trends
Monthly performance helps agencies plan budgets, schedule campaigns, and prepare for seasonal opportunities.
Charts displayed:
-
Revenue (USD) by Month
-
Active Campaign % by Month
-
Total Campaign Count by Month
-
Budget (USD) vs Spend (USD) by Month
This page highlights seasonal spikes, slow periods, and budgeting efficiency across the year.
⭐ Support Sheets Included
Support Sheet:
Stores controlled lists such as service types, client industries, promo types, campaign types, and monthly values.
Data Sheet:
This is where all raw data is stored. Update this sheet and the dashboard refreshes automatically.
🛠️ How to Use the Digital Media Agencies Dashboard in Excel
This dashboard is easy to use and requires no advanced Excel skills:
➡️ Paste your campaign, revenue, cost, and budget data into the Data Sheet
➡️ Use slicers to filter results by service type, month, client industry, or campaign type
➡️ Navigate between dashboard pages using the page navigator
➡️ Analyze performance instantly using the dynamic charts
➡️ Customize colors, KPIs, or charts anytime based on agency branding
➡️ Export insights for client reports or internal presentations
Because it runs entirely in Excel, updates take only seconds — no coding or BI tools required.
👥 Who Can Benefit from This Digital Media Agencies Dashboard in Excel
🎯 Digital Marketing Agencies
Track campaign performance, revenue, and budget allocation.
🎯 Freelancers & Independent Marketers
Get clear insights without expensive reporting tools.
🎯 Social Media Teams
Monitor campaign health and sentiment-based profitability.
🎯 Performance Marketing Specialists
Measure spend efficiency and ROI instantly.
🎯 Media Planning & Buying Teams
Evaluate promo type spend vs budget usage.
🎯 Client Account Managers
Track industry-wise revenue and spot valuable clients.
🎯 Business Owners & Directors
Get a top-level business snapshot anytime.
This dashboard is ideal for any agency that wants clarity, speed, and accurate insights in a single Excel template.
### 📘 Click here to read the Detailed Blog Post
### 📺 Visit our YouTube channel to learn step-by-step video tutorials:
👉 Youtube.com/@PKAnExcelExpert


Reviews
There are no reviews yet.