Managing global freight operations can be extremely complex. Logistics companies handle thousands of shipments across different countries, customers, and transportation modes. Tracking shipment performance, monitoring costs, and analyzing profitability using traditional spreadsheets often becomes overwhelming.
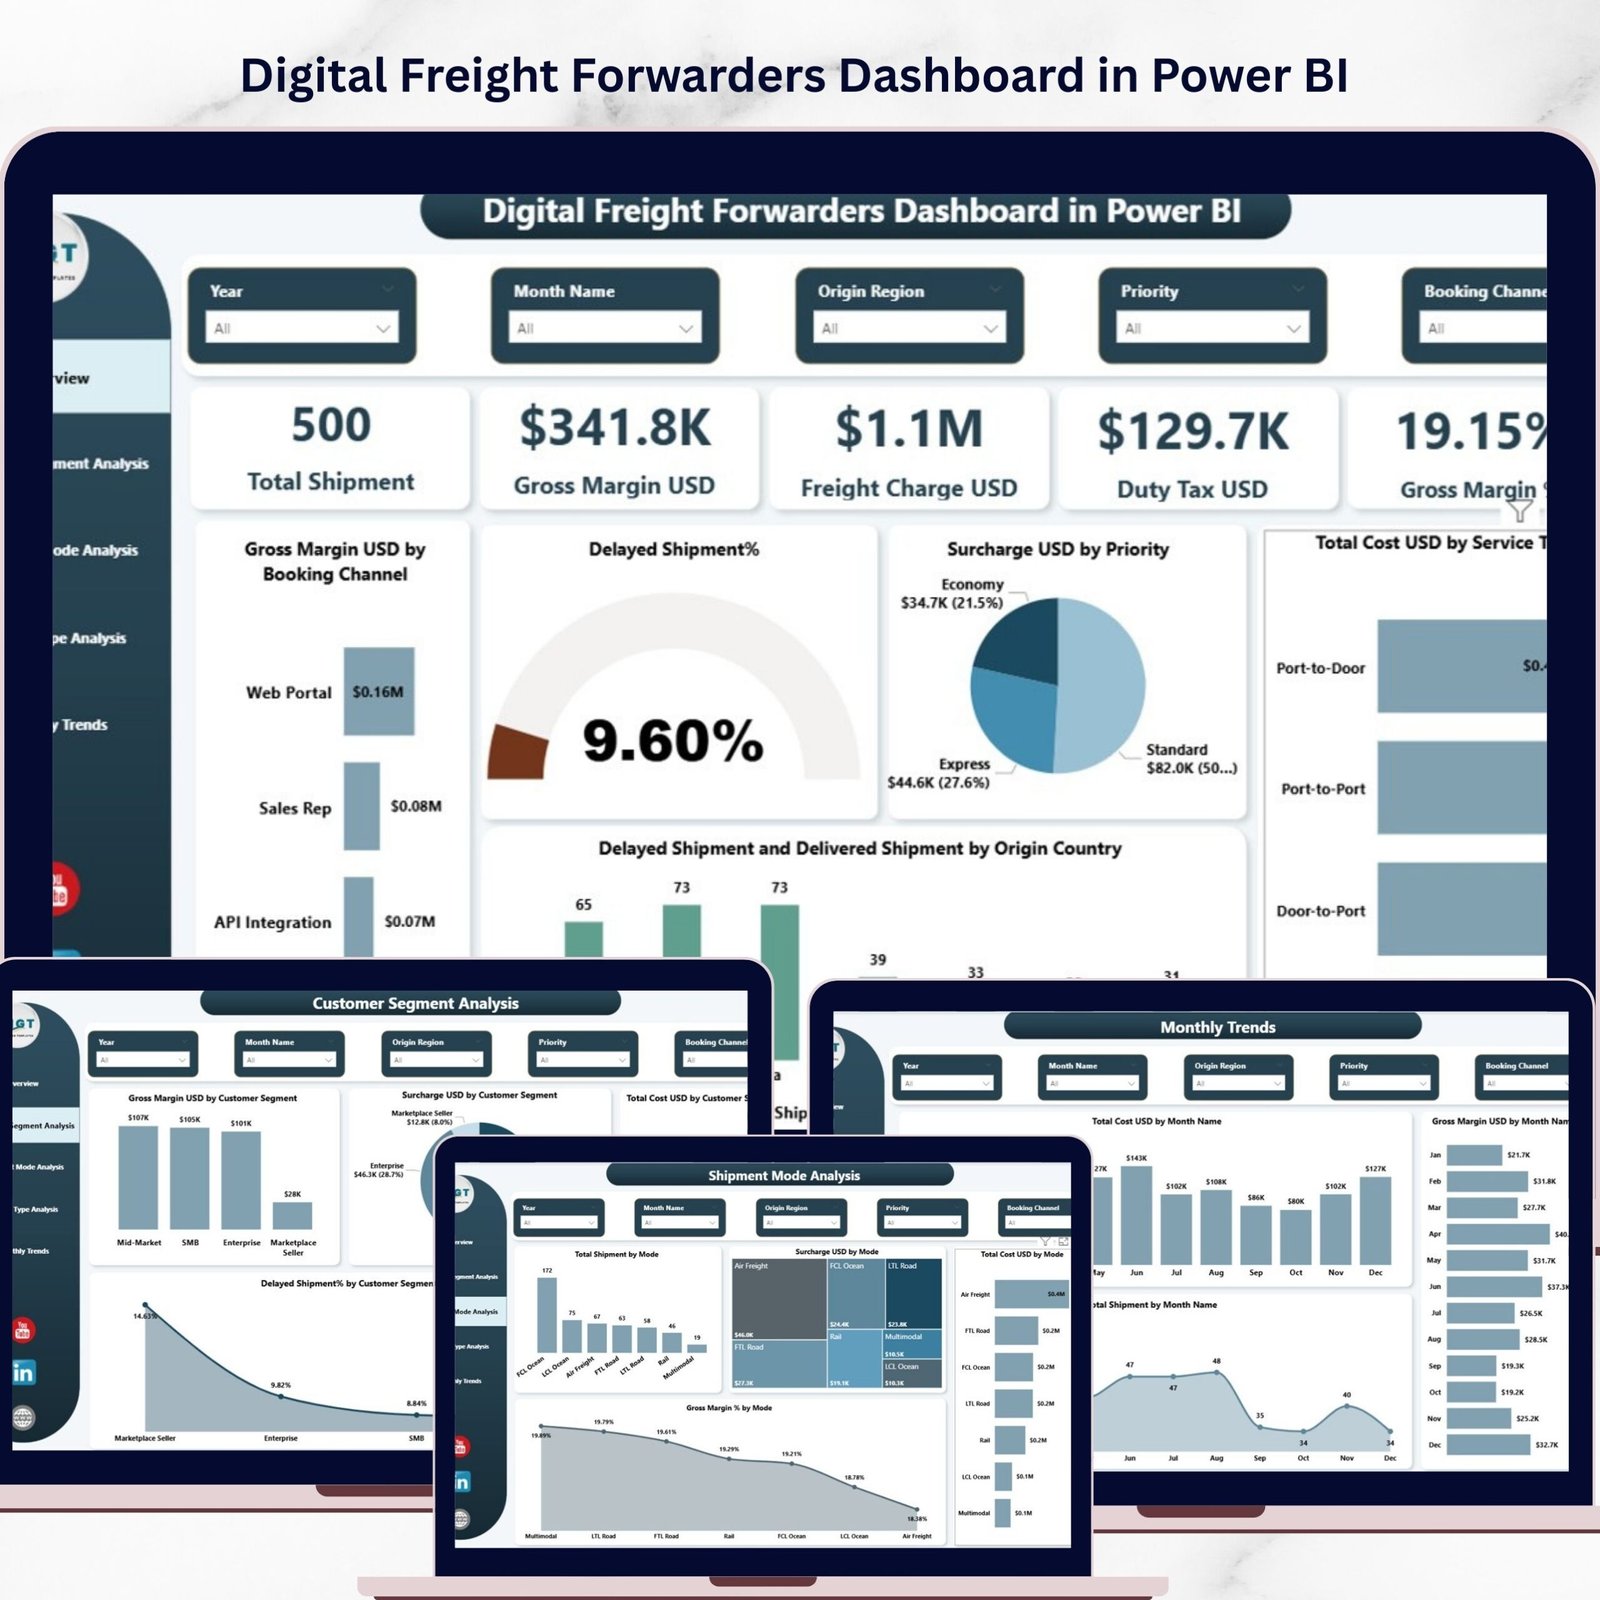
That is why modern logistics companies are shifting toward data-driven analytics dashboards. The Digital Freight Forwarders Dashboard in Power BI is a powerful and ready-to-use business intelligence solution that helps freight forwarding companies monitor shipments, analyze operational costs, track delivery performance, and evaluate profitability using interactive visual reports.
This dashboard transforms raw logistics data into clear visual insights, enabling logistics managers, supply chain teams, and executives to make faster and smarter decisions. Instead of spending hours analyzing multiple reports, users can explore shipment trends, cost structures, and margins from a single centralized dashboard.
Whether you manage international freight, supply chain operations, or logistics analytics, this dashboard provides the visibility needed to optimize freight performance and improve operational efficiency.
🚚 Key Feature of Digital Freight Forwarders Dashboard in Power BI
✨ 5 Interactive Dashboard Pages
The dashboard includes five powerful analytical pages designed to analyze freight operations from multiple perspectives.
📊 Executive KPI Overview
Track critical logistics KPIs including Total Shipments, Gross Margin USD, Freight Charges, Duty Tax, and Gross Margin Percentage.
📈 Shipment Performance Monitoring
Instantly analyze delayed shipments, delivery performance, and operational bottlenecks across origin countries.
💰 Cost & Profitability Analysis
Understand freight charges, total shipment costs, duty taxes, and surcharges to evaluate overall profitability.
👥 Customer Segment Insights
Identify which customer groups generate the highest margins and understand shipment performance across different customer segments.
🚛 Shipment Mode Analytics
Compare performance across Air, Sea, Road, and Rail freight to determine the most efficient transportation method.
⚙ Service Type Performance Analysis
Evaluate express, standard, economy, and priority shipping services to understand revenue, costs, and profit margins.
📅 Monthly Logistics Trend Tracking
Monitor shipment volume, cost trends, and profit fluctuations throughout the year.
🔎 Interactive Filters and Slicers
Users can filter the entire dashboard using dynamic slicers such as shipment mode, service type, customer segment, and time period.
📉 Delay Detection & Performance Monitoring
Quickly identify delayed shipments and investigate operational inefficiencies.
📊 Modern Visual Analytics
Clean charts and visual reports make it easier to interpret complex logistics data instantly.
📦 What’s Inside the Digital Freight Forwarders Dashboard in Power BI
This ready-to-use Power BI dashboard contains five powerful analytics pages designed specifically for freight forwarding companies.
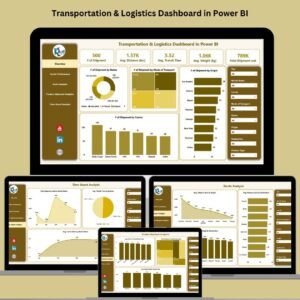
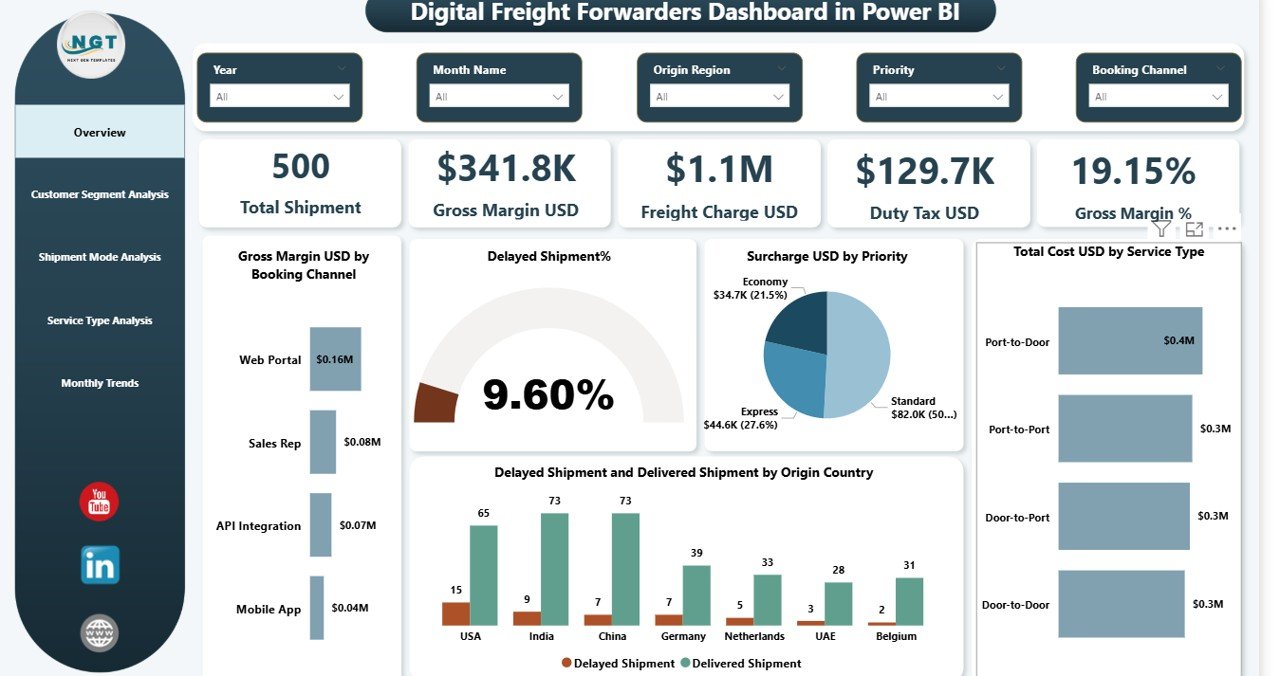
1️⃣ Overview Page
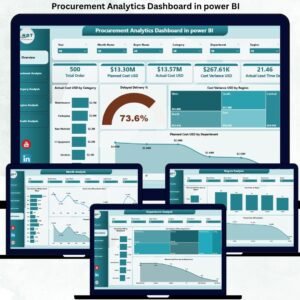
The main dashboard page provides a complete snapshot of freight performance. It includes KPI cards such as Total Shipments, Gross Margin USD, Freight Charges, Duty Tax, and Gross Margin Percentage. Multiple charts display insights such as delayed shipment percentage, total cost by service type, and profit by booking channel.
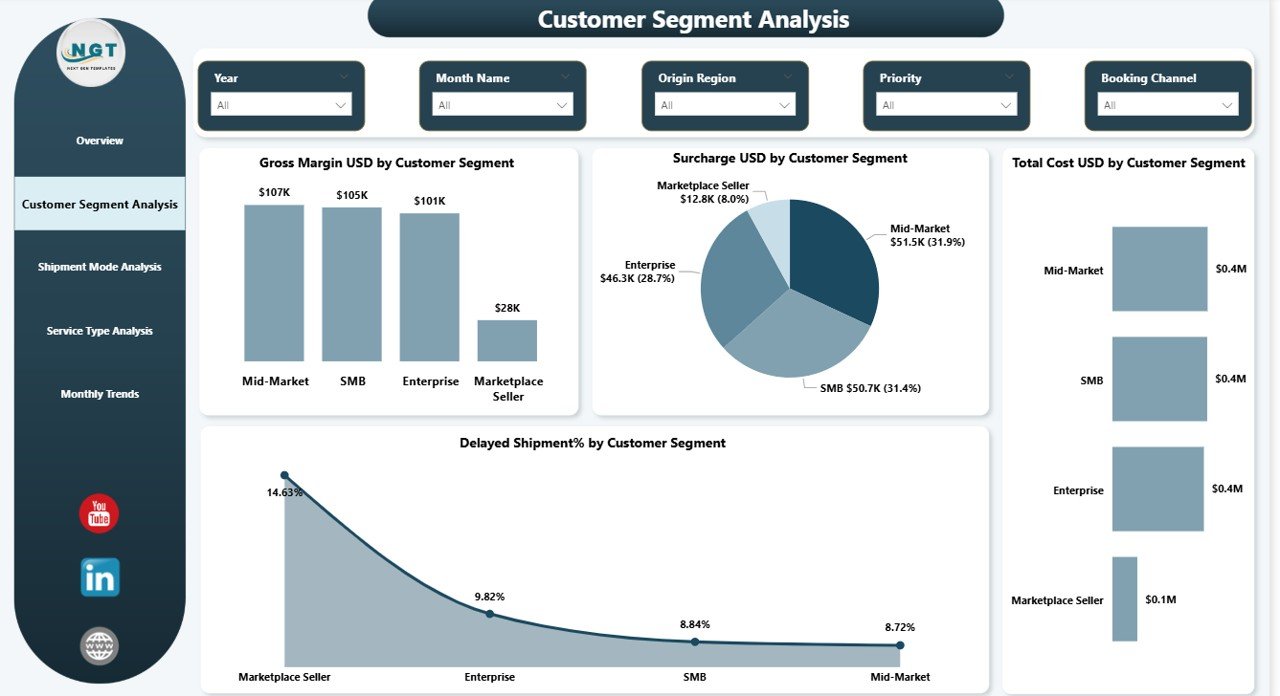
2️⃣ Customer Segment Analysis Page
This page focuses on customer profitability. It analyzes gross margins, shipment delays, operational costs, and surcharges by different customer segments.
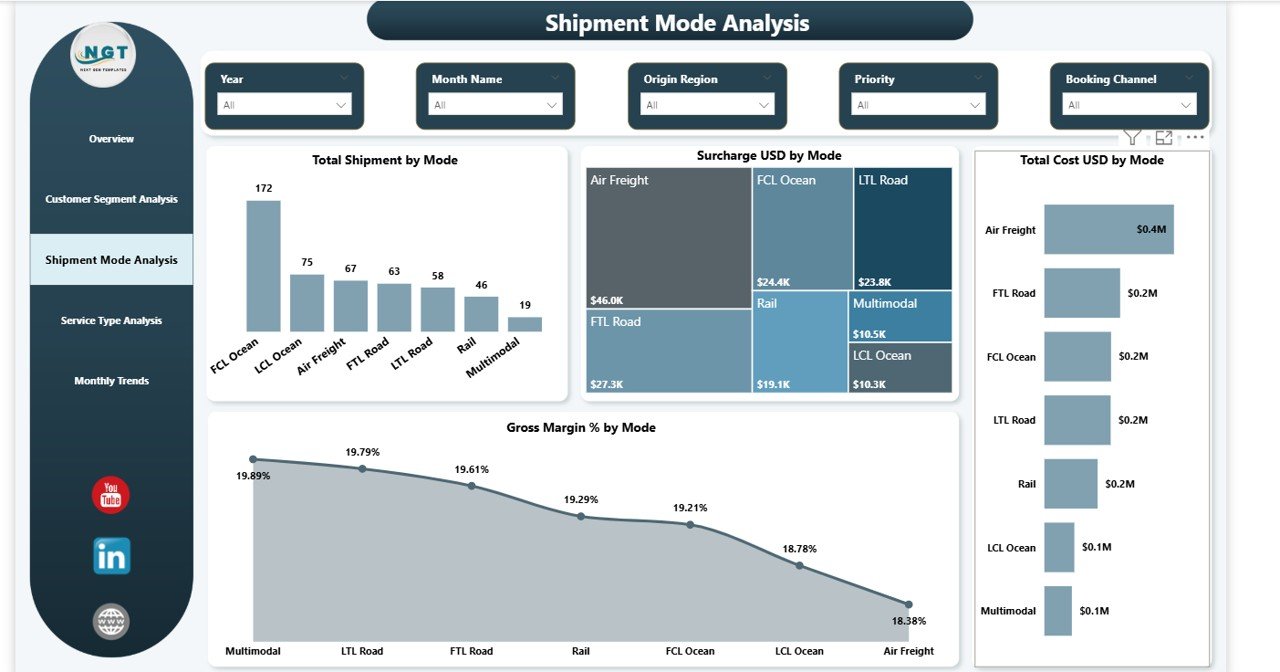
3️⃣ Shipment Mode Analysis Page
This page evaluates performance across transportation modes including air, sea, road, and rail freight. Users can analyze shipment distribution, operational costs, surcharges, and profit margins by shipment mode.
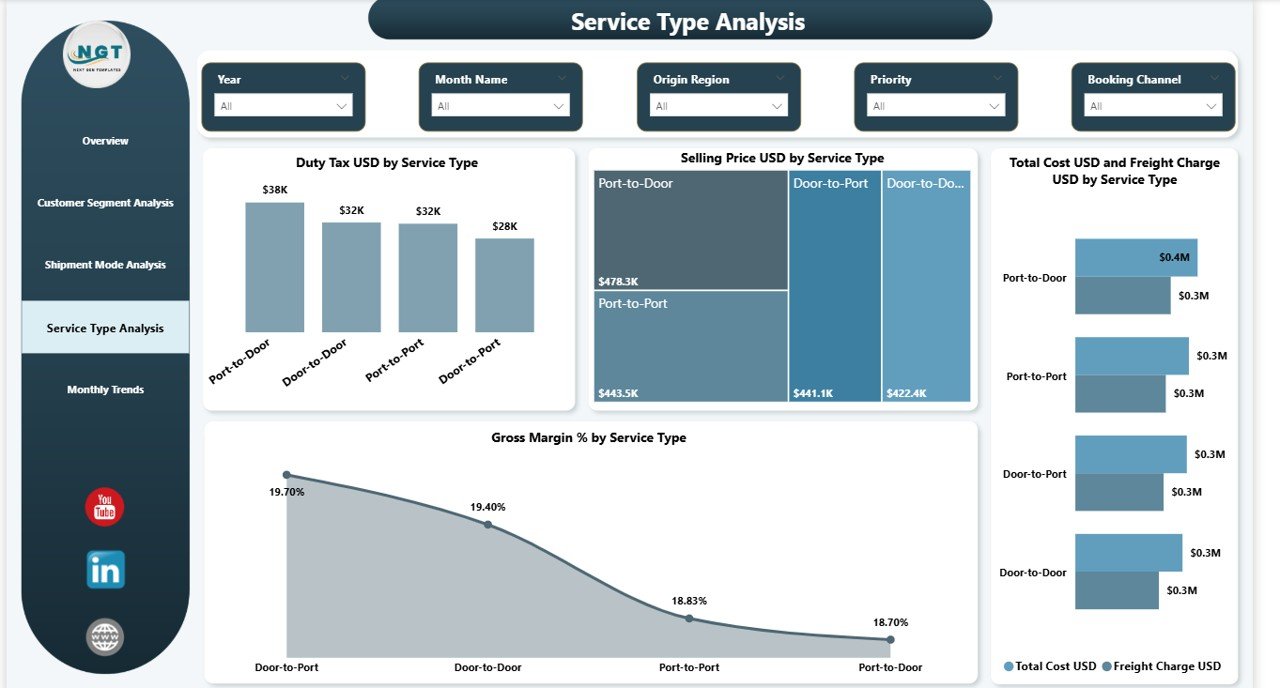
4️⃣ Service Type Analysis Page
The service type analysis page helps companies evaluate the performance of express, standard, and priority shipping services by analyzing duty taxes, selling prices, freight charges, and total operational costs.
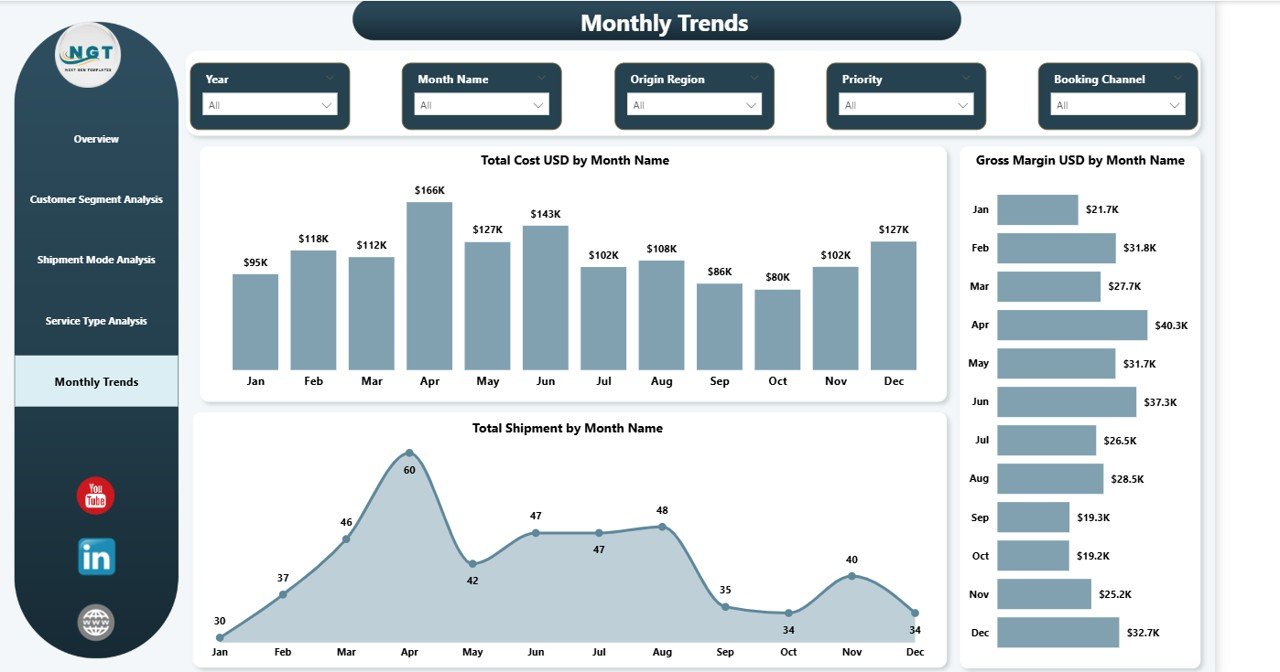
5️⃣ Month Analysis Page
This page tracks logistics trends over time. It shows shipment volume, profit trends, and cost patterns across months to identify seasonal shipping patterns.
⚙ How to Use the Digital Freight Forwarders Dashboard in Power BI
Using this dashboard is simple and user-friendly.
Step 1: Import Shipment Data
Load your logistics data into Power BI including shipment details, freight charges, duty taxes, shipment mode, and delivery status.
Step 2: Connect Data Sources
Link your logistics databases, ERP systems, or Excel files to the dashboard.
Step 3: Apply Filters and Slicers
Use interactive filters to explore data by customer segment, shipment mode, service type, or time period.
Step 4: Analyze Key KPIs
Monitor shipment volume, margins, freight charges, and delayed shipments through KPI cards.
Step 5: Explore Visual Insights
Use interactive charts to analyze profitability, cost structures, and shipment performance.
Step 6: Make Data-Driven Decisions
Use the insights to improve delivery performance, reduce logistics costs, and optimize freight operations.
👨💼 Who Can Benefit from This Digital Freight Forwarders Dashboard in Power BI
This dashboard is valuable for many professionals in the logistics and supply chain industry.
🚚 Freight Forwarding Companies
Monitor shipment activity, analyze logistics performance, and track profitability.
📦 Logistics Managers
Identify delayed shipments, evaluate shipment modes, and improve operational efficiency.
🔗 Supply Chain Managers
Analyze transportation performance and optimize freight routes.
💰 Finance Teams
Monitor freight charges, duty taxes, operational costs, and profit margins.
📊 Business Executives
Gain strategic insights into logistics performance and support data-driven decision-making.
🌍 Global Trade Companies
Track international shipments, customer segments, and logistics costs.
Click here to read the Detailed blog post
Watch the step-by-step video tutorial: