Are your DevOps metrics hidden inside static spreadsheets? Are deployment issues, downtime risks, and performance gaps going unnoticed? ⚡
DevOps teams operate at high speed. They deploy frequently, automate continuously, and resolve incidents instantly. However, speed without measurement creates blind spots. Without structured KPI tracking, leadership cannot see where improvement is needed.
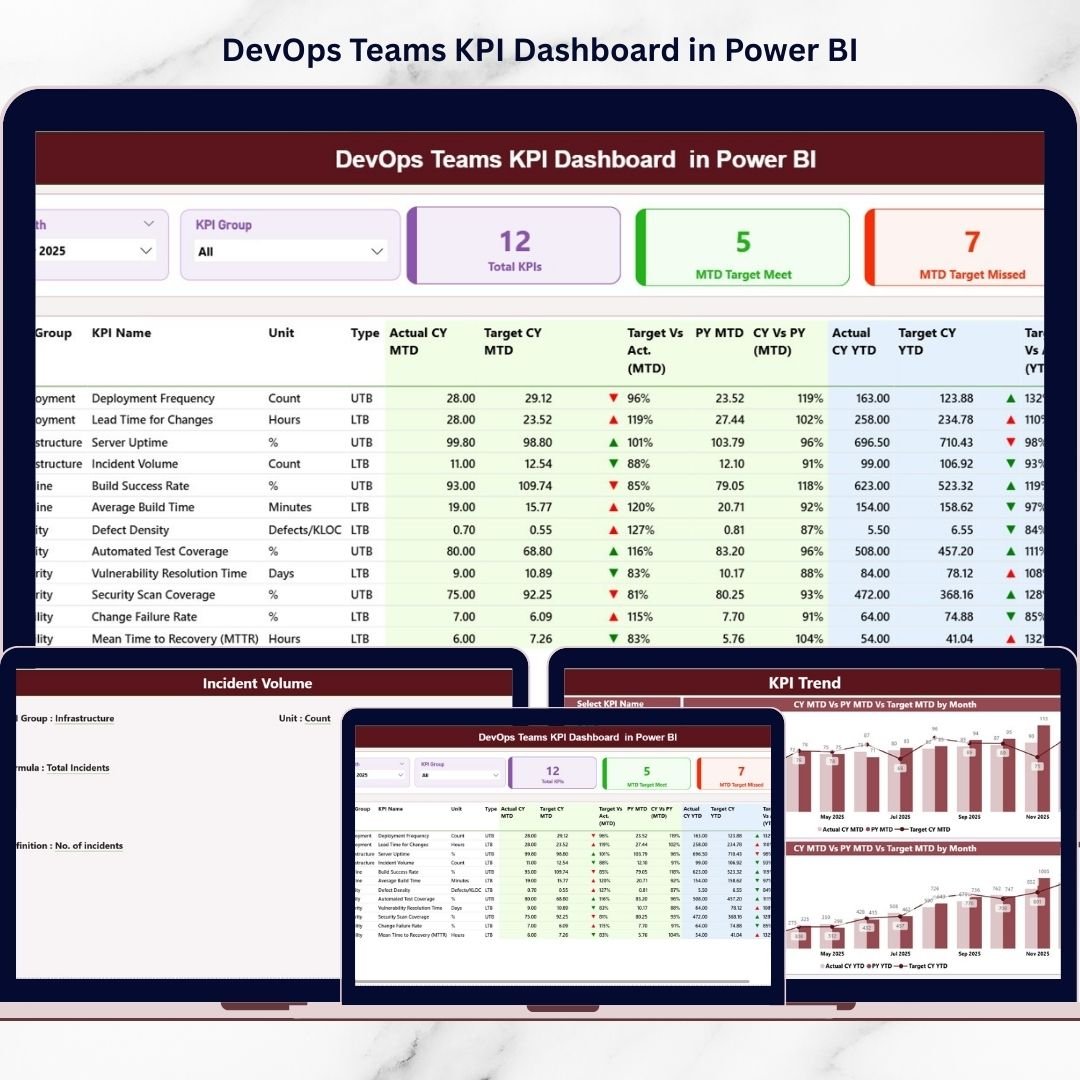
That is why you need the DevOps Teams KPI Dashboard in Power BI.
This ready-to-use, professionally designed Power BI dashboard transforms structured Excel data into dynamic, interactive visuals. It centralizes DevOps KPIs, compares Actual vs Target, analyzes Month-to-Date (MTD) and Year-to-Date (YTD) performance, and highlights Current Year vs Previous Year trends — all in one intelligent reporting system.
No more scattered files. No more manual calculations. Just clear, actionable insights.
Let us explore what makes this dashboard powerful.
🚀 Key Feature of DevOps Teams KPI Dashboard in Power BI
📊 Interactive Summary Page
Monitor all KPIs from one centralized dashboard with Month and KPI Group slicers for instant filtering.
🎯 MTD & YTD Performance Tracking
Track Actual vs Target and Current Year vs Previous Year comparisons automatically.
📈 Dynamic KPI Trend Page
Visual combo charts display MTD and YTD trends, helping leaders detect patterns early.
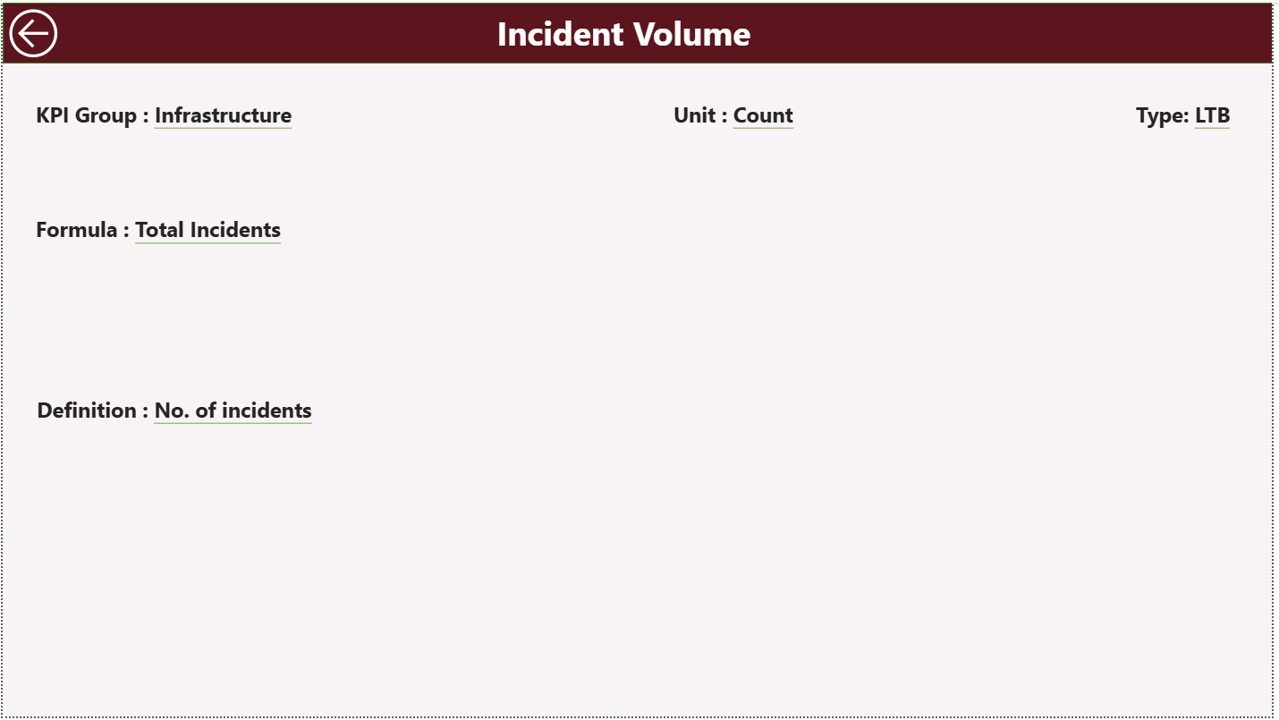
📘 Drill-Through KPI Definition Page
Right-click any KPI to view formula, definition, group, and performance type (LTB/UTB).
⚡ Automated Calculations
Target vs Actual % and CY vs PY % are calculated instantly inside Power BI.
🧩 Structured Excel Data Integration
Input Actual, Input Target, and KPI Definition sheets connect seamlessly to Power BI.
🔎 Conditional Formatting Icons
Green ▲ and Red ▼ indicators instantly show performance direction.
Because Power BI updates visuals automatically, decision-makers always see accurate and real-time insights.
📦 What’s Inside the DevOps Teams KPI Dashboard in Power BI
This dashboard includes 3 professionally structured report pages:
1️⃣ Summary Page
The main performance view showing:
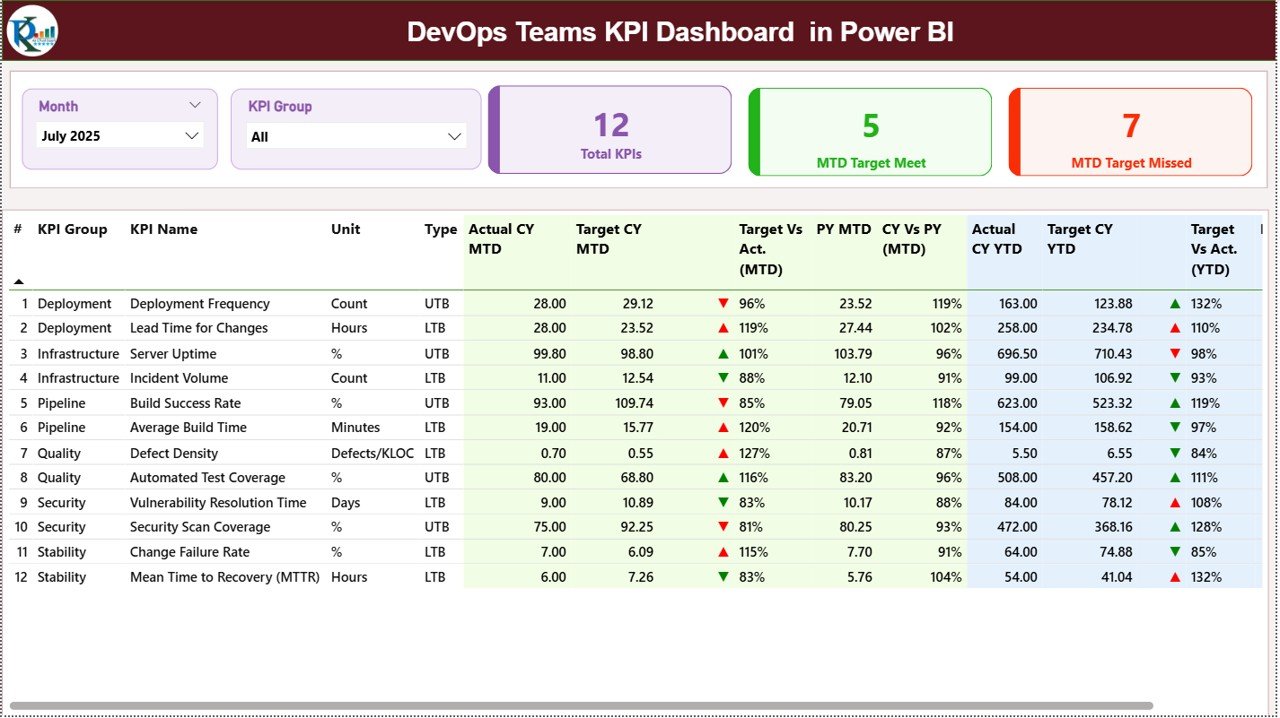
• KPI Count
• Target Meet / Miss Count
• Detailed KPI performance table
• MTD metrics (Actual, Target, PY, % comparisons)
• YTD metrics (Actual, Target, PY, % comparisons)
Everything updates instantly through slicers.
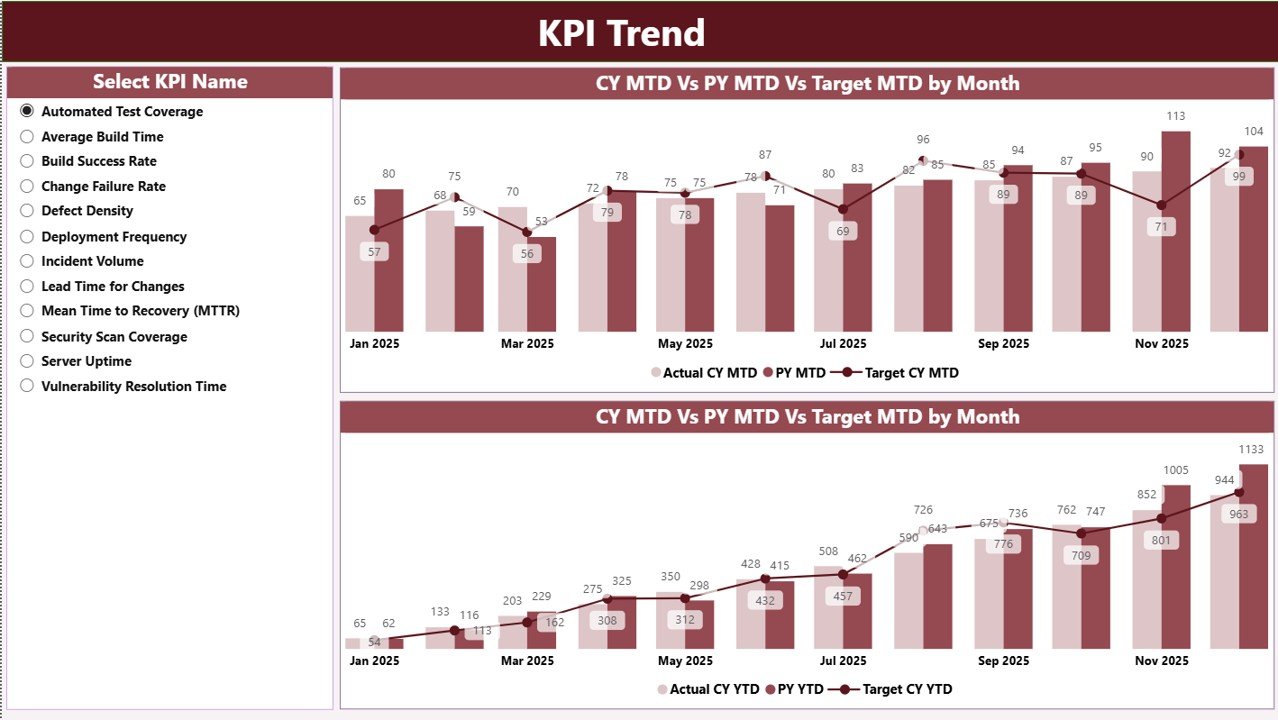
2️⃣ KPI Trend Page
A powerful visual analysis page featuring:
• KPI Name slicer
• MTD Trend Combo Chart
• YTD Trend Combo Chart
• Target vs Actual vs Previous Year comparison
This page helps identify performance patterns over time.
3️⃣ KPI Definition Page
A drill-through documentation page displaying:
• KPI Formula
• KPI Definition
• KPI Group
• KPI Type (Lower the Better / Upper the Better)
This ensures transparency and clarity for all stakeholders.
📊 How to Use the DevOps Teams KPI Dashboard in Power BI
Using this dashboard is simple:
1️⃣ Enter monthly performance data in the Input Actual Excel sheet.
2️⃣ Enter targets in the Input Target sheet.
3️⃣ Maintain KPI metadata in the KPI Definition sheet.
4️⃣ Refresh Power BI.
5️⃣ Use slicers to analyze performance instantly.
The dashboard automatically calculates:
• Target vs Actual (MTD & YTD)
• Current Year vs Previous Year growth
• KPI performance status
Because everything is automated, reporting becomes faster and more reliable.
You do not need advanced Power BI skills. Just update the Excel file and refresh.
👥 Who Can Benefit from This DevOps Teams KPI Dashboard in Power BI
This dashboard is ideal for:
👨💻 DevOps Managers
👨💼 CTOs
📊 Engineering Directors
🛠️ IT Operations Leaders
📈 Agile Delivery Managers
🚀 Technology Startups
🏢 Enterprise IT Teams
If your organization wants better visibility, faster decision-making, and structured DevOps reporting, this solution delivers measurable value.
This dashboard improves DevOps performance by:
✔ Highlighting bottlenecks
✔ Tracking deployment speed
✔ Monitoring downtime and stability
✔ Comparing year-over-year performance
✔ Measuring target achievement clearly
When teams see metrics visually, accountability improves and performance accelerates.
Stop guessing. Start measuring. Drive DevOps excellence with structured insights.
📘 Click here to read the Detailed blog post
Visit our YouTube channel to learn step-by-step video tutorials
👉 https://www.youtube.com/@PKAnExcelExpert


