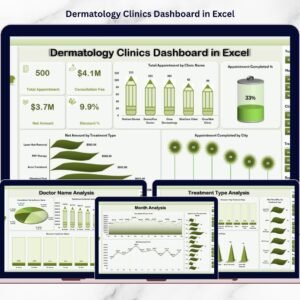
Running a modern Dermatology Clinics Dashboard more than medical expertise — it demands clear visibility into appointments, doctor performance, treatment revenue, and patient flow. However, many clinics still rely on scattered spreadsheets and manual reports. As a result, decision-makers struggle to monitor operations efficiently and miss critical growth signals.
That’s exactly why we created the Dermatology Clinics Dashboard in Excel — a powerful, ready-to-use analytics solution designed specifically for healthcare providers.
This professional Excel dashboard converts raw clinic data into meaningful visual insights using Pivot Tables, slicers, and dynamic charts. Consequently, clinic owners and managers can track performance, identify bottlenecks, and make faster data-driven decisions.
Whether you operate a single dermatology center or a multi-clinic network, this dashboard gives you the control and clarity needed to scale confidently.
🔑 Key Feature of Dermatology Clinics Dashboard in Excel
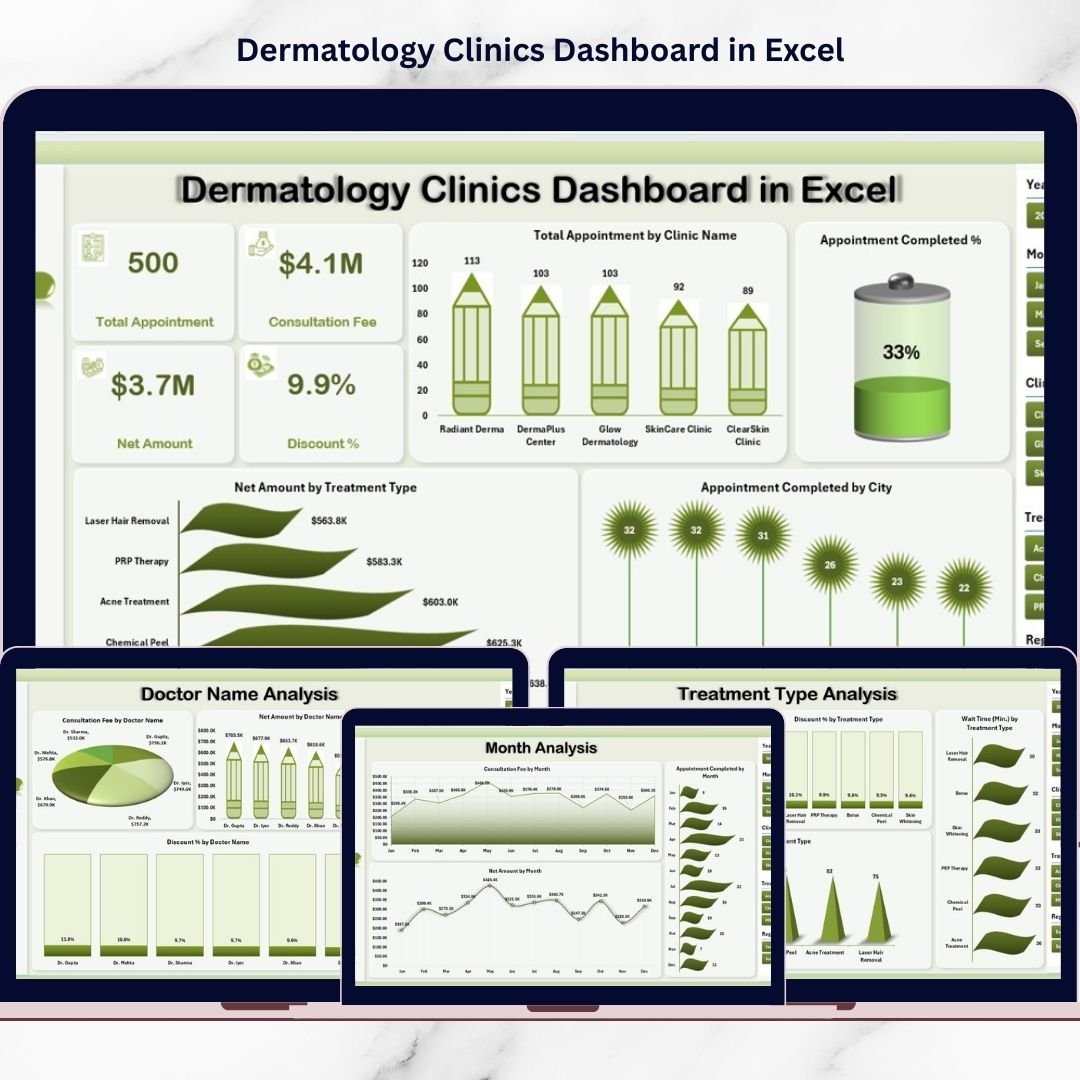
✨ Executive Overview Page
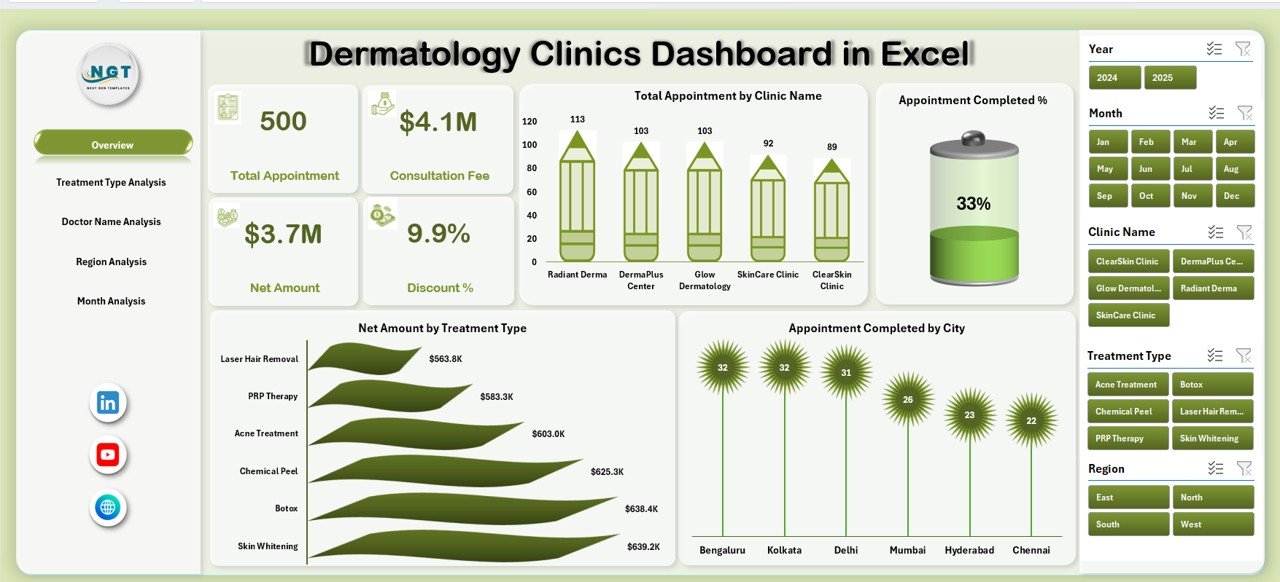
Instantly monitor key clinic KPIs with dynamic cards and interactive visuals.
📊 Interactive Left-Side Navigator
Switch between analytical pages smoothly for faster workflow.
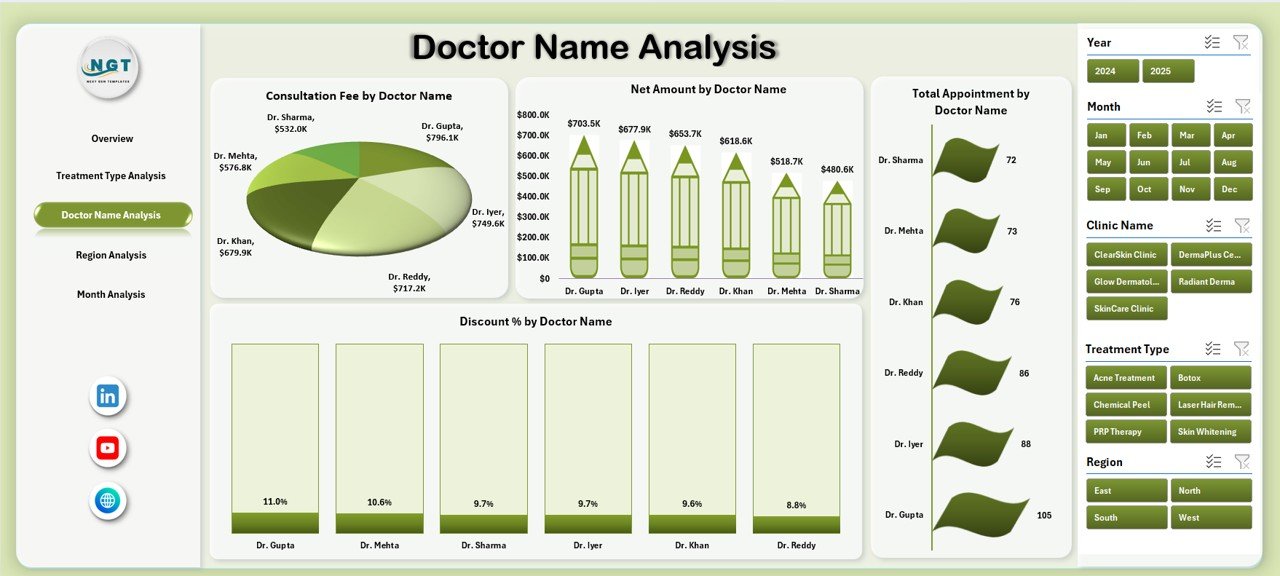
👨⚕️ Doctor Performance Tracking
Evaluate consultation revenue, discounts, and patient load by doctor.
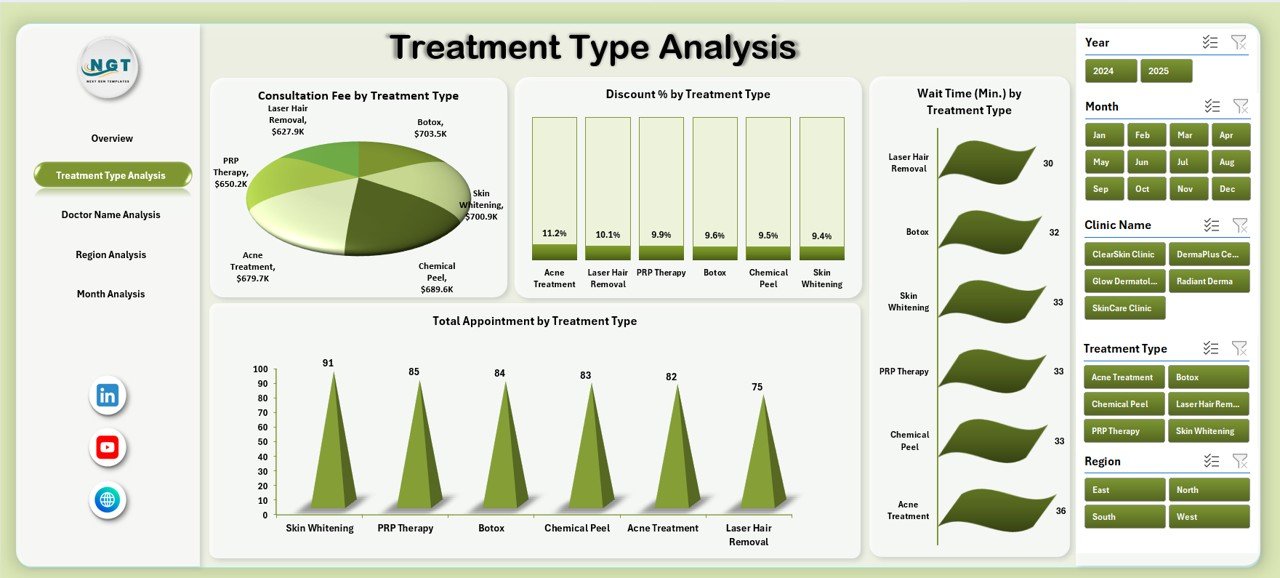
🔬 Treatment-Level Intelligence
Identify high-demand and high-profit treatments quickly.
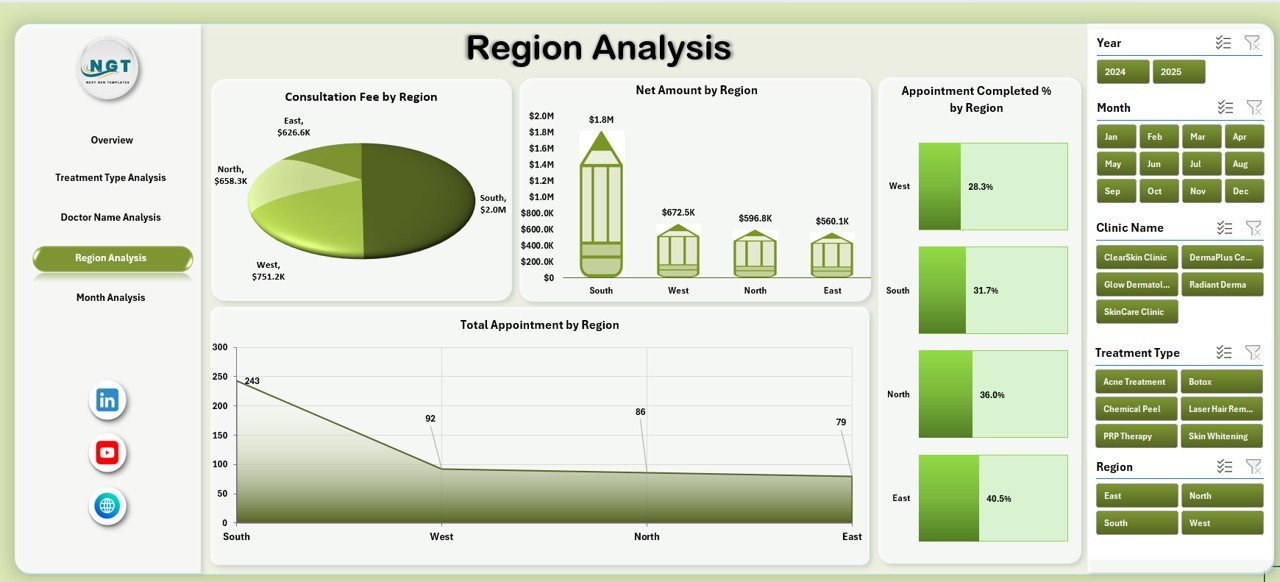
🌍 Regional Performance Insights
Compare clinic performance across cities and regions.
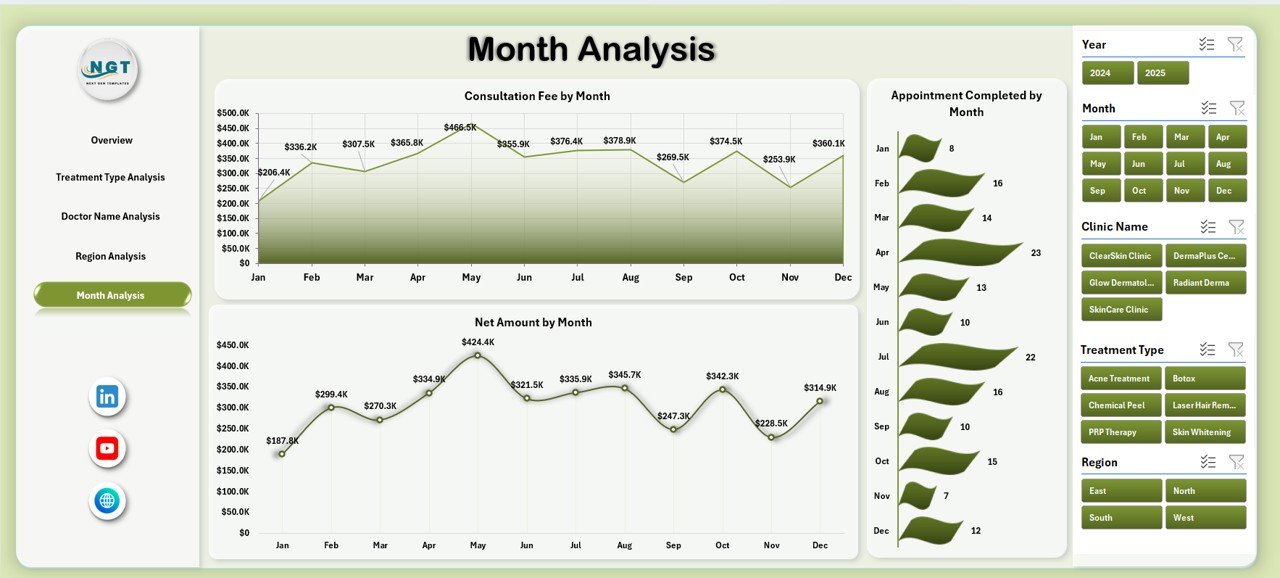
📅 Monthly Trend Monitoring
Track appointment volume and revenue seasonality over time.
⏱ Patient Wait Time Analysis
Monitor service efficiency and improve patient experience.
⚡ 100% Excel-Based Solution
Works seamlessly in Microsoft Excel — no advanced tools required.
📦 What’s Inside the Dermatology Clinics Dashboard in Excel
This ready-to-use template includes a complete analytical framework.
✔️ Interactive Dashboard (5 Analytical Pages)
✔️ Executive KPI Cards
✔️ Pivot-Based Charts and Visuals
✔️ Dynamic Slicers for Filtering
✔️ Structured Data Sheet
✔️ Support Sheet for Calculations
✔️ Easy Data Update Framework
Everything is pre-configured so you can start analyzing immediately.
🛠️ How to Use the Dermatology Clinics Dashboard in Excel
Getting started is simple and beginner-friendly.
Step 1: Download and open the Excel file
Step 2: Update the Data Sheet with your clinic data
Step 3: Refresh Pivot Tables
Step 4: Use slicers to filter insights
Step 5: Review KPI cards and charts
Within minutes, your clinic will have a professional performance command center.
🎯 Who Can Benefit from This Dermatology Clinics Dashboard in Excel
This dashboard is ideal for healthcare organizations that want structured performance monitoring.
✅ Dermatology Clinic Owners
✅ Healthcare Administrators
✅ Operations Managers
✅ Medical Directors
✅ Financial Analysts
✅ Multi-Clinic Networks
If your clinic wants better visibility, improved efficiency, and stronger revenue control, this tool is essential.
Why This Dashboard Is a Game-Changer
Unlike manual reporting methods, this dashboard provides:
✔️ Centralized clinic visibility
✔️ Real-time KPI monitoring
✔️ Doctor productivity insights
✔️ Treatment profitability tracking
✔️ Regional comparison
✔️ Faster executive reporting
As a result, your clinic shifts from reactive management to proactive growth.
### Click hare to read the Detailed blog post
📺 Visit our YouTube channel to learn step-by-step video tutorials
👉 Youtube.com/@PKAnExcelExpert