In today’s data-driven business world, organizations depend heavily on analytics to guide decisions, optimize operations, and maintain competitive advantages. Data Analytics KPI Scorecard in Excel Every day, companies generate vast amounts of data through systems, applications, and digital platforms. However, many organizations struggle to evaluate whether their analytics initiatives truly create measurable business value.
Without structured performance monitoring, analytics efforts often lose direction. Reports may exist, dashboards may be built, but teams lack a clear framework to measure success. This is why modern organizations increasingly rely on KPI scorecards to track analytics effectiveness consistently.
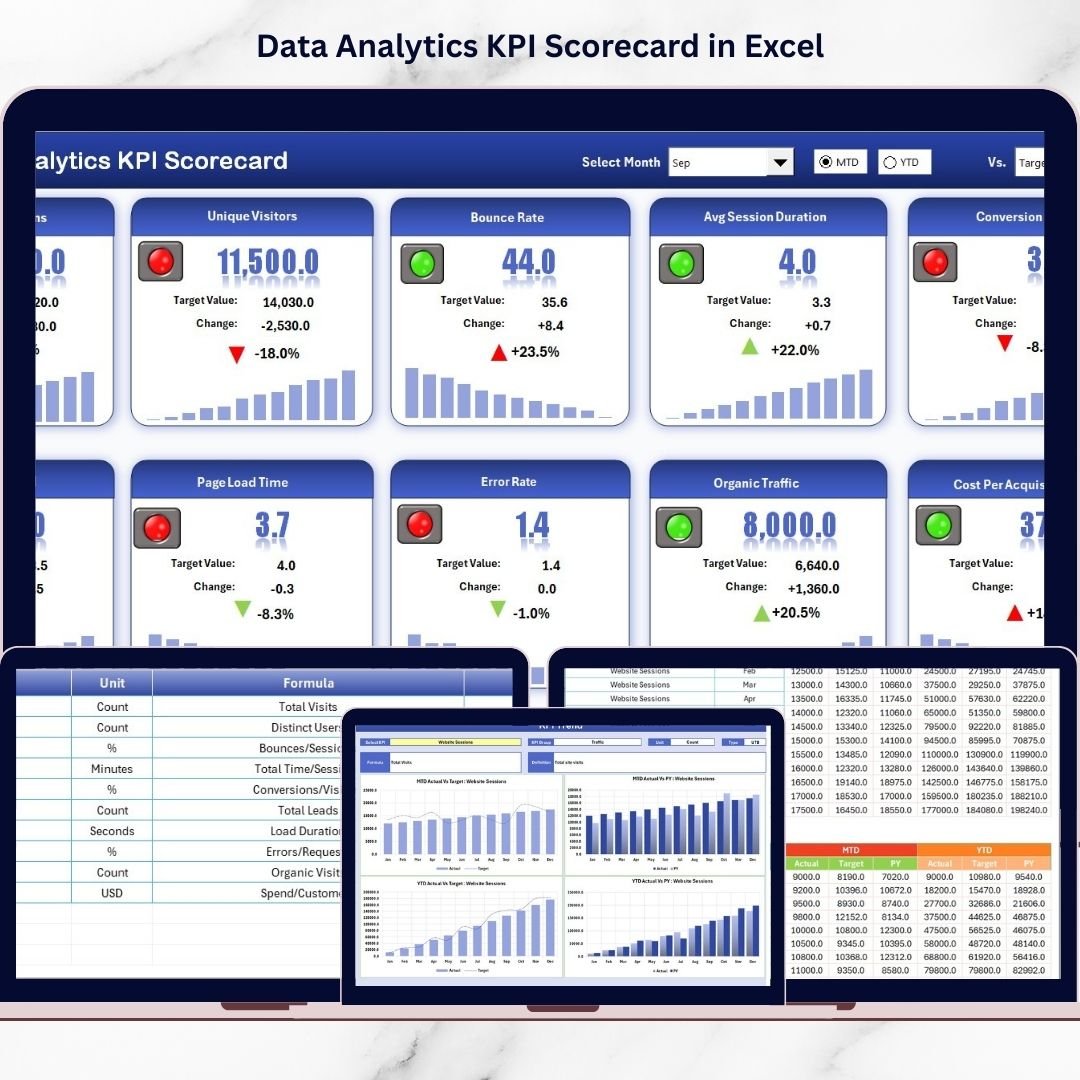
The Data Analytics KPI Scorecard in Excel is a ready-to-use performance monitoring solution designed to help businesses measure analytics success using structured Key Performance Indicators (KPIs). Instead of reviewing scattered spreadsheets and disconnected reports, teams can analyze performance through a centralized and interactive scorecard.
Data Analytics KPI Scorecard in Excel Built using Excel’s powerful yet familiar environment, this template combines automation, visualization, and flexibility. As a result, organizations can quickly implement analytics performance tracking without investing in expensive business intelligence tools.
Whether you want to measure dashboard adoption, data quality improvements, reporting efficiency, or analytics ROI, this scorecard transforms complex analytics activities into clear, actionable insights.
🚀 Key Feature of Data Analytics KPI Scorecard in Excel
📊 Centralized Analytics Performance Dashboard – Monitor all analytics KPIs from one structured interface.
🎯 MTD & YTD Performance Tracking – Evaluate both monthly and yearly analytics outcomes instantly.
📈 Actual vs Target Comparison – Automatically measure KPI performance against defined goals.
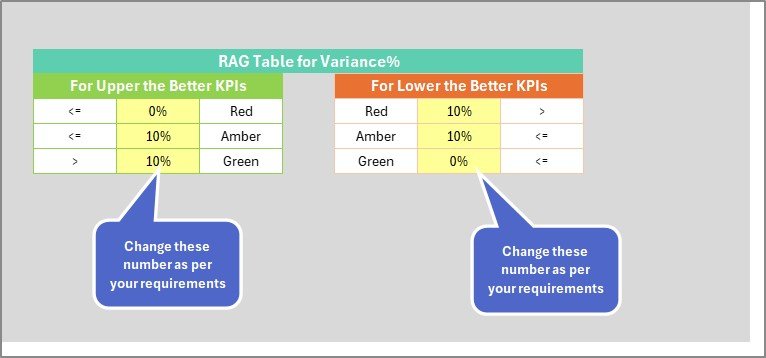
🟢 Visual Performance Indicators – Color-coded formatting highlights success areas and improvement needs.
📉 Dynamic KPI Trend Analysis – Track performance progress using automated trend charts.
🔄 Automatic Dashboard Updates – Enter data once and all calculations refresh instantly.
📂 Standardized KPI Definitions – Maintain consistent KPI logic across teams.
⚙️ Fully Customizable Template – Adapt KPIs easily according to organizational analytics strategy.
📦 What’s Inside the Data Analytics KPI Scorecard in Excel
This professionally designed Excel template includes four structured worksheets that create a complete analytics performance framework:
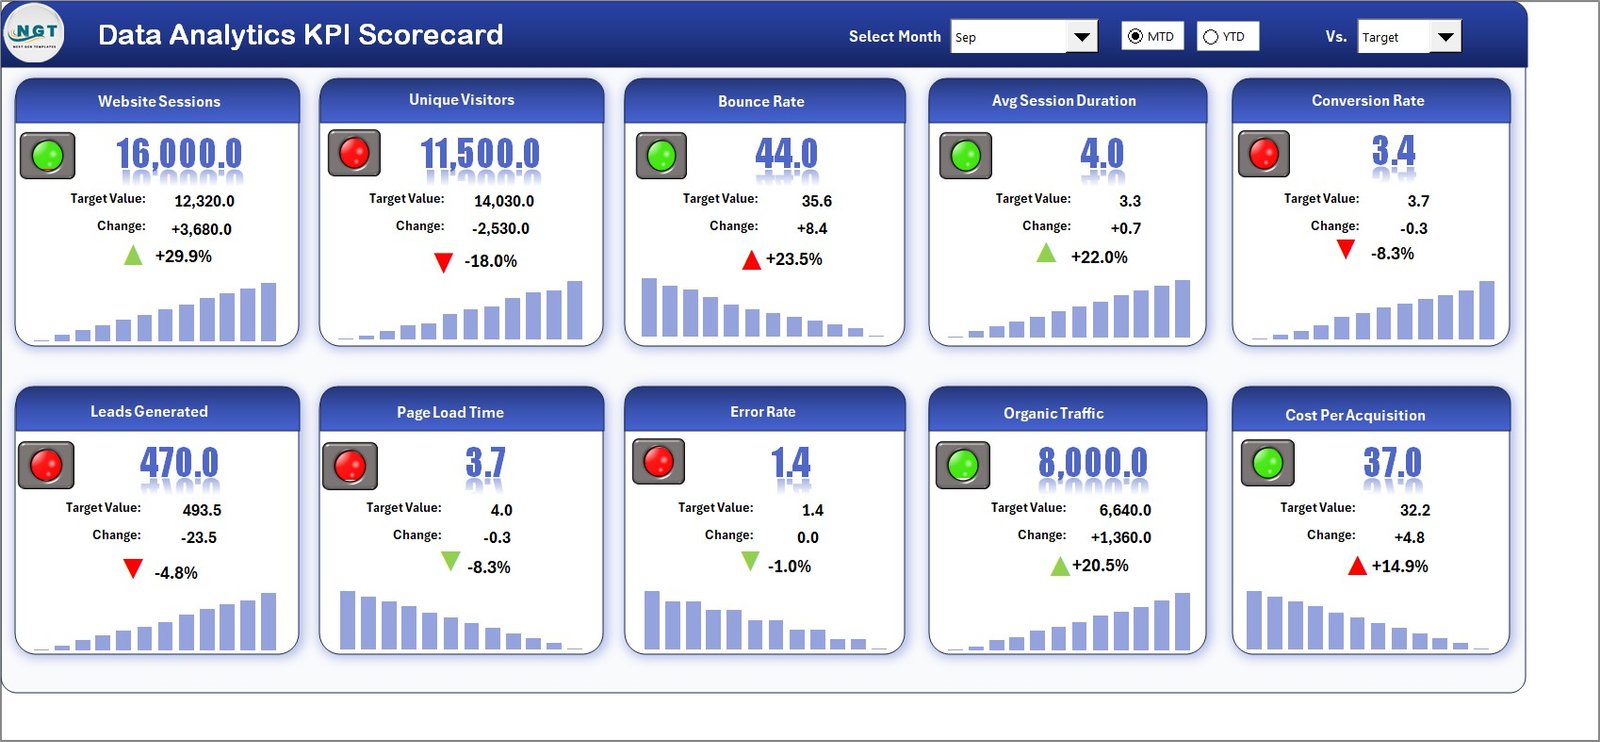
📊 Scorecard Sheet – Main Dashboard
The central performance interface where users review KPI performance with dropdown filters and automated MTD/YTD comparisons.
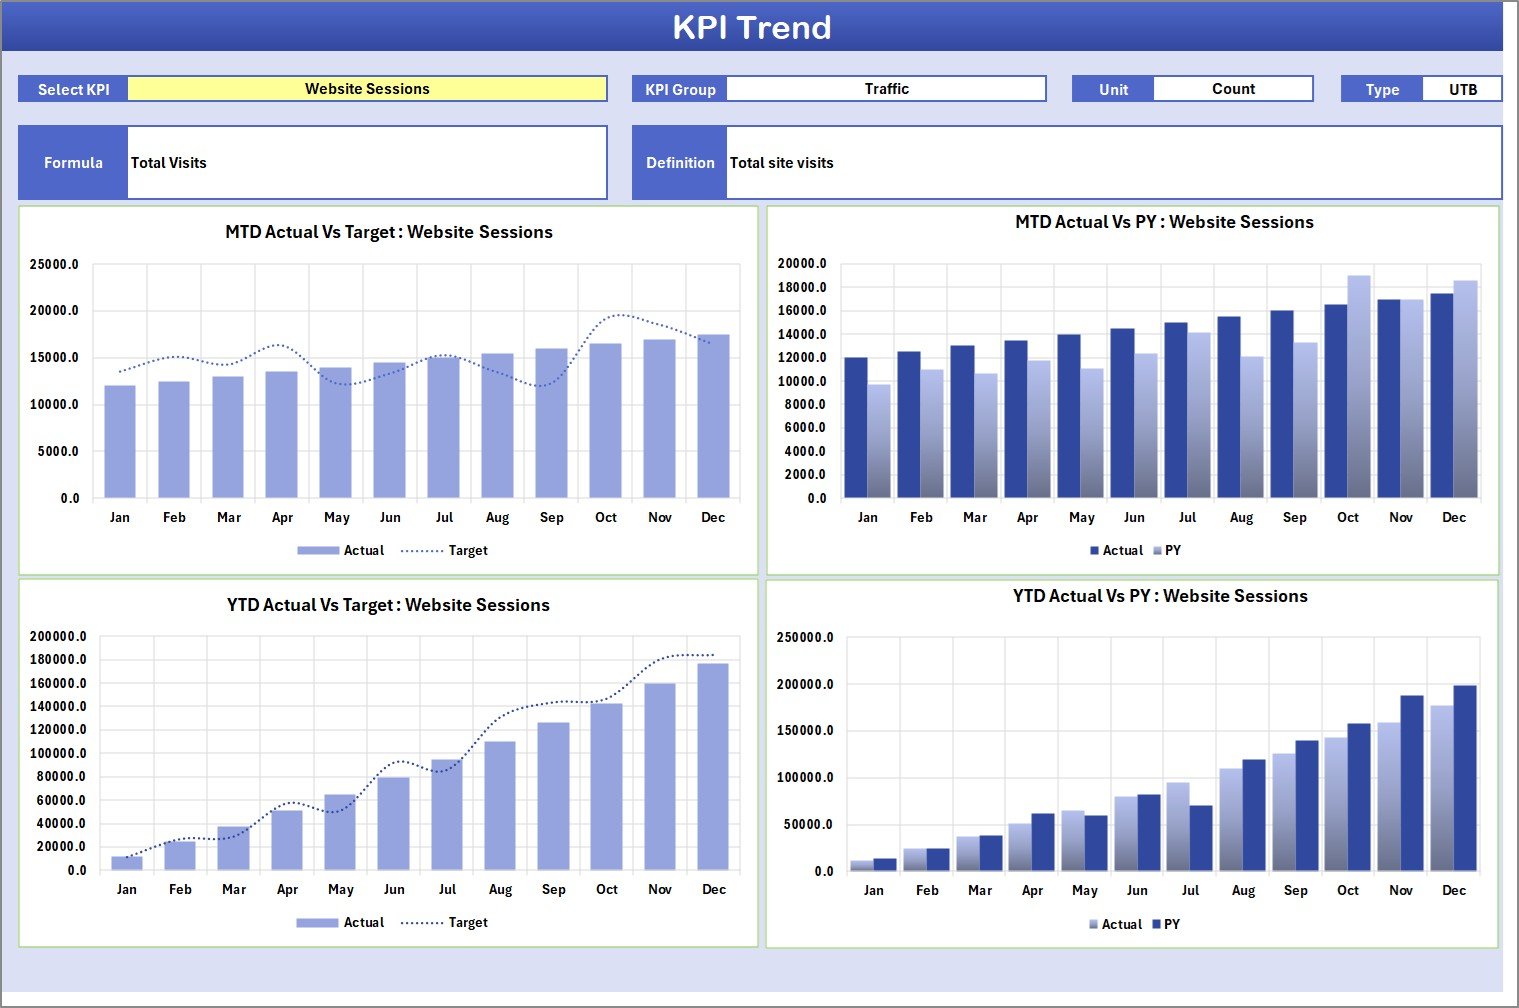
📈 KPI Trend Sheet
Provides detailed analysis through dynamic charts comparing Actual, Target, and Previous Year performance trends.
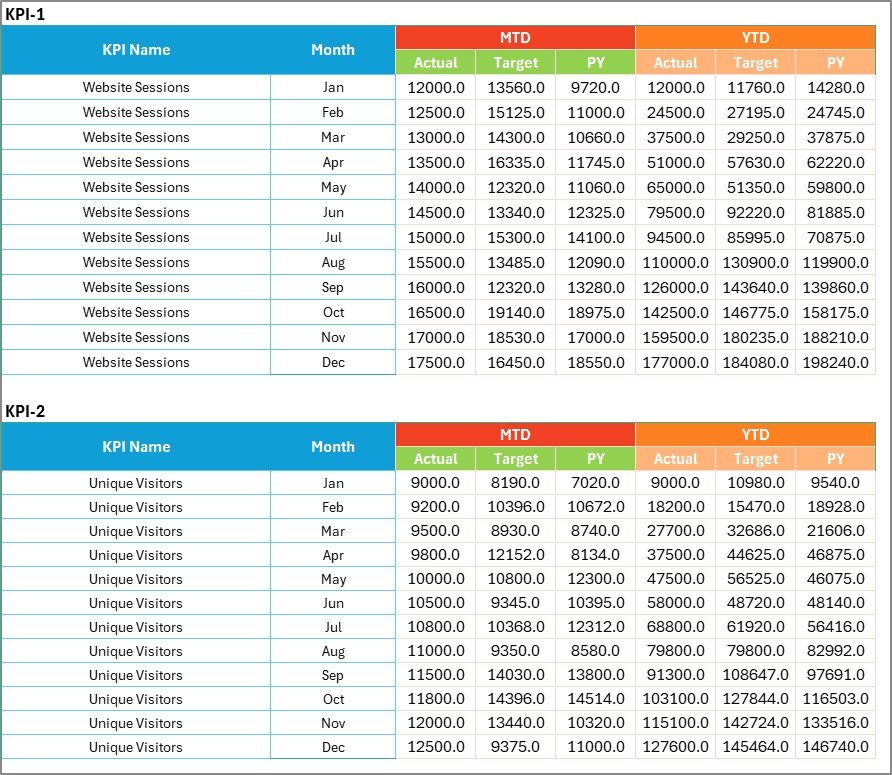
📝 Input Data Sheet
The primary data entry location where users record KPI values and targets, instantly updating the scorecard.
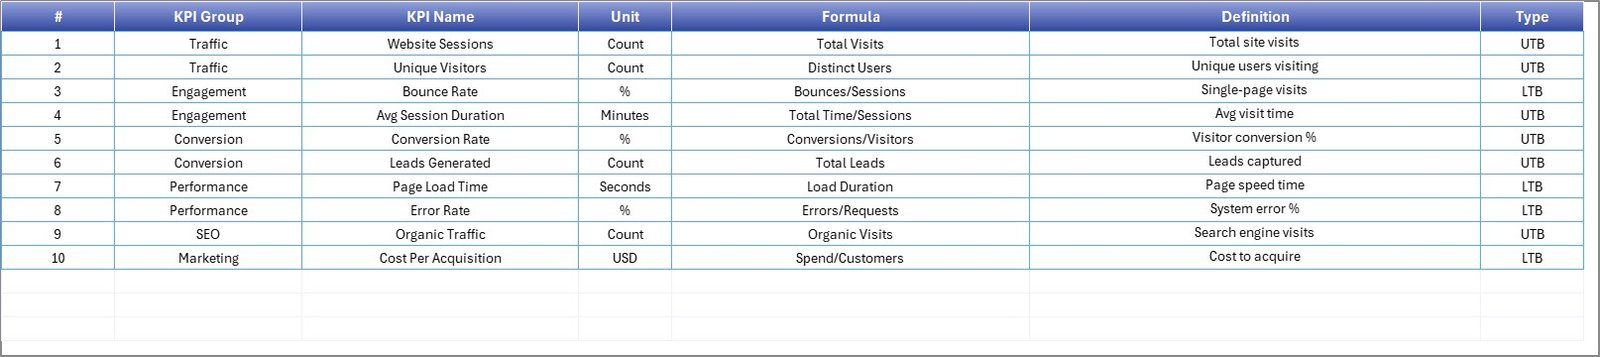
📘 KPI Definition Sheet
A documentation hub storing KPI formulas, definitions, units, and KPI types to ensure consistent reporting standards.
Together, these worksheets deliver structured analytics monitoring system.
⚙️ How to Use the Data Analytics KPI Scorecard in Excel
The template is designed for fast adoption and ease of use:
1️⃣ Define analytics KPIs aligned with business objectives.
2️⃣ Enter KPI details in the KPI Definition sheet.
3️⃣ Set performance targets.
4️⃣ Input actual KPI data regularly.
5️⃣ Select Month, MTD, or YTD using dropdown menus.
6️⃣ Analyze performance insights through dashboard visuals.
Within minutes, organizations gain meaningful analytics visibility.
👥 Who Can Benefit from This Data Analytics KPI Scorecard in Excel
This scorecard is ideal for professionals responsible for analytics and performance management:
📊 Data Analysts
📈 Business Intelligence Teams
💼 Analytics Managers
🏢 Operations Leaders
👔 Executives & Decision Makers
📉 Data Governance Teams
Both small businesses and enterprise organizations can implement this solution to strengthen analytics accountability and strategic decision-making.
By transforming analytics activities into measurable KPIs, organizations move from reporting-focused operations to performance-driven analytics cultures.
The Data Analytics KPI Scorecard in Excel helps teams convert data into measurable outcomes, improving alignment between analytics initiatives and business goals.
### Click here to read the Detailed blog post
Visit our YouTube channel to learn step-by-step video tutorials:
👉 https://youtube.com/@PKAnExcelExpert