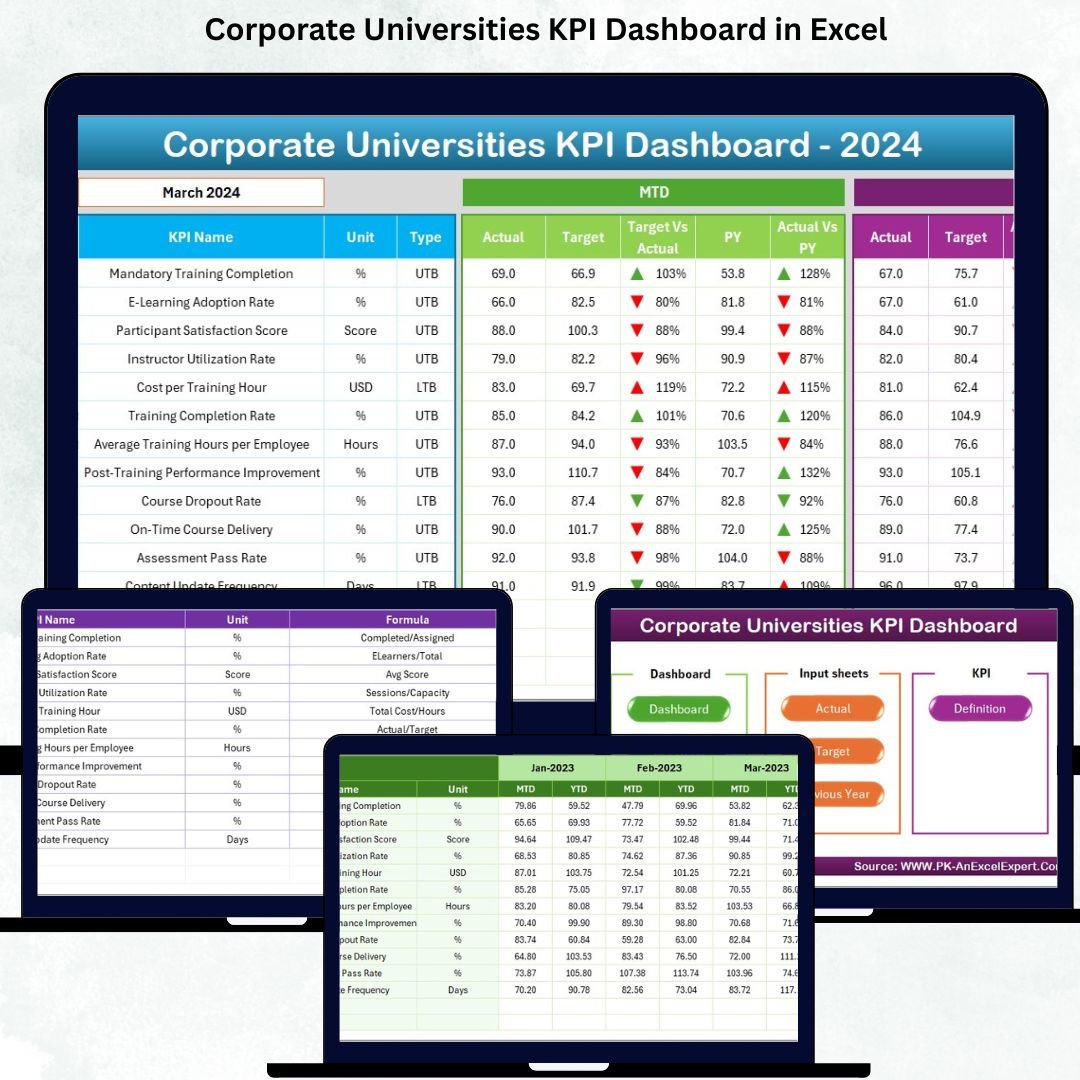
Corporate learning plays a critical role in building a skilled, competitive, and future-ready workforce. As organizations evolve, employees need continuous training, certification programs, leadership development, and skill-building initiatives. Managing all these activities through spreadsheets and manual reports becomes confusing and slow. Leaders need clear visibility into learning performance—and that’s where the Corporate Universities KPI Dashboard in Excel becomes a powerful solution.
This ready-to-use dashboard helps HR teams, L&D managers, and corporate university leaders track training KPIs, review performance month by month, compare results with targets, and identify improvement areas instantly. With clean navigation, dynamic visuals, trend charts, MTD & YTD tracking, and automated formulas, this dashboard transforms complex learning data into simple and actionable insights.
Since the dashboard runs inside Excel, it requires no technical skills. Anyone can update numbers, refresh charts, and analyze performance with ease—making it the perfect tool for corporate learning environments.
✨ Key Features of the Corporate Universities KPI Dashboard in Excel
🎓 Complete Learning KPI Monitoring
Track training hours, participation rate, completion rate, certification achievements, program effectiveness, and other essential L&D metrics.
📅 Dynamic Monthly Selection
Choose any month from a drop-down menu and the entire dashboard instantly updates MTD, YTD, and previous year comparisons.
🎯 MTD & YTD KPI Blocks for Deeper Insights
Every KPI displays:
-
MTD Actual
-
MTD Target
-
MTD Previous Year
-
YTD Actual
-
YTD Target
-
YTD Previous Year
Plus performance comparisons and conditional indicators.
🟢🔴 Clear Performance Arrows (UTB/LTB)
Green ↑ = Performance meets/exceeds target
Red ↓ = Performance falls below target
These visuals make it easy to identify strong and weak areas.
📈 Trend Charts for Long-Term Analysis
View month-wise MTD and YTD performance trends for any KPI. These charts help identify patterns, improvements, or sudden drops.
🧭 Easy Navigation System
The Home Sheet includes navigation buttons that take users directly to Dashboard, Trend Sheet, Actuals, Targets, PY sheet, and Definitions.
🧮 Automated Excel Workflow
Just update actuals, targets, and previous year numbers—the dashboard refreshes automatically using formulas and lookups.
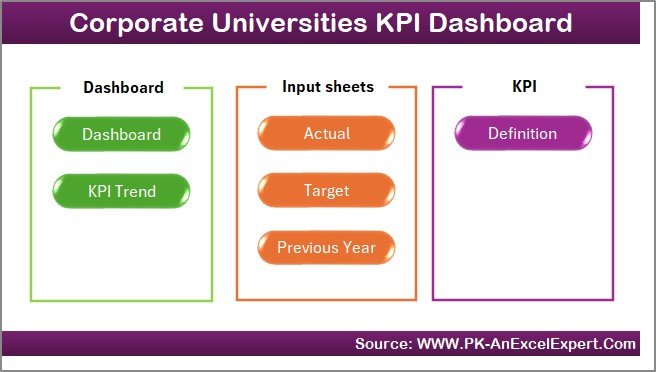
📦 What’s Inside the Corporate Universities KPI Dashboard in Excel
The dashboard includes 7 structured sheets, each designed to support corporate learning analysis:
✔ 1. Home Sheet – Navigation Hub
A clean index page with buttons for quick movement across all sheets. Easy for both beginners and advanced users.
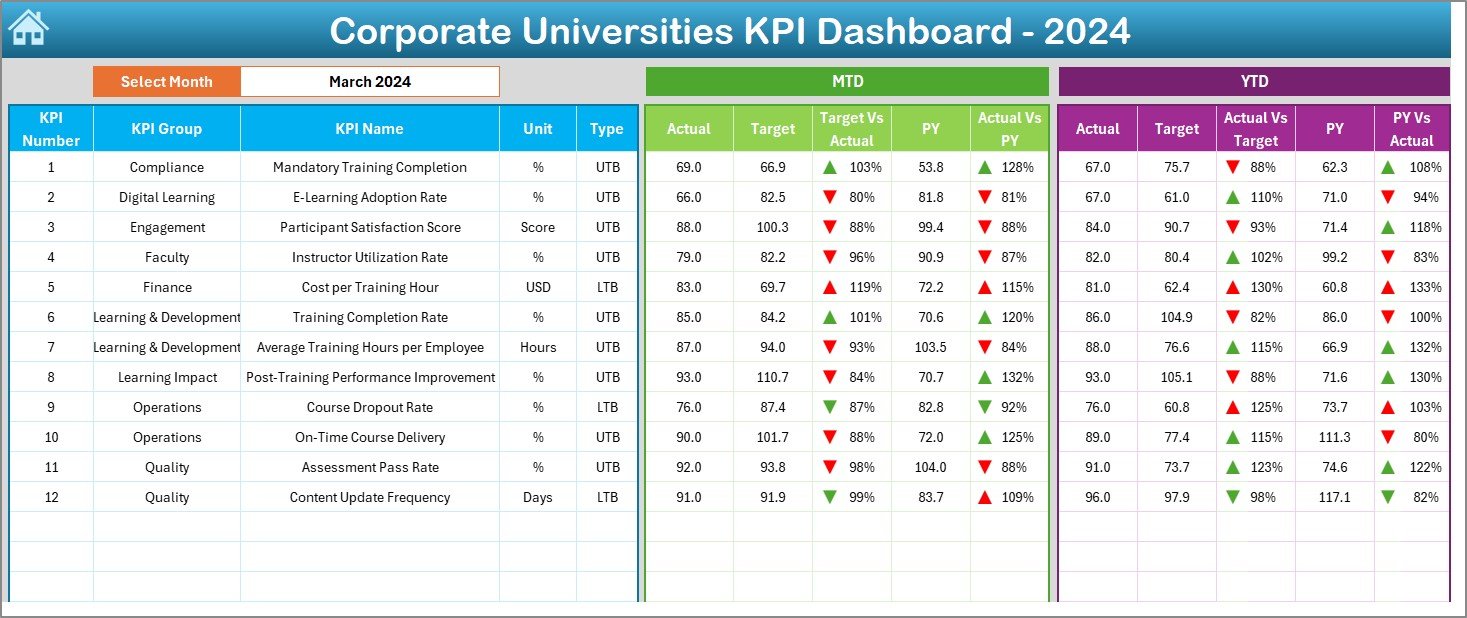
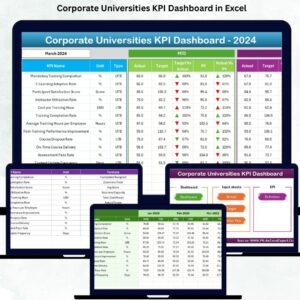
✔ 2. Dashboard Sheet – Main KPI Summary
The heart of the template, showing all learning KPIs in one view. Monthly selection triggers automatic updates across all KPI blocks.
Includes:
-
MTD block
-
YTD block
-
PY comparisons
-
Conditional arrows
-
Target vs Actual %
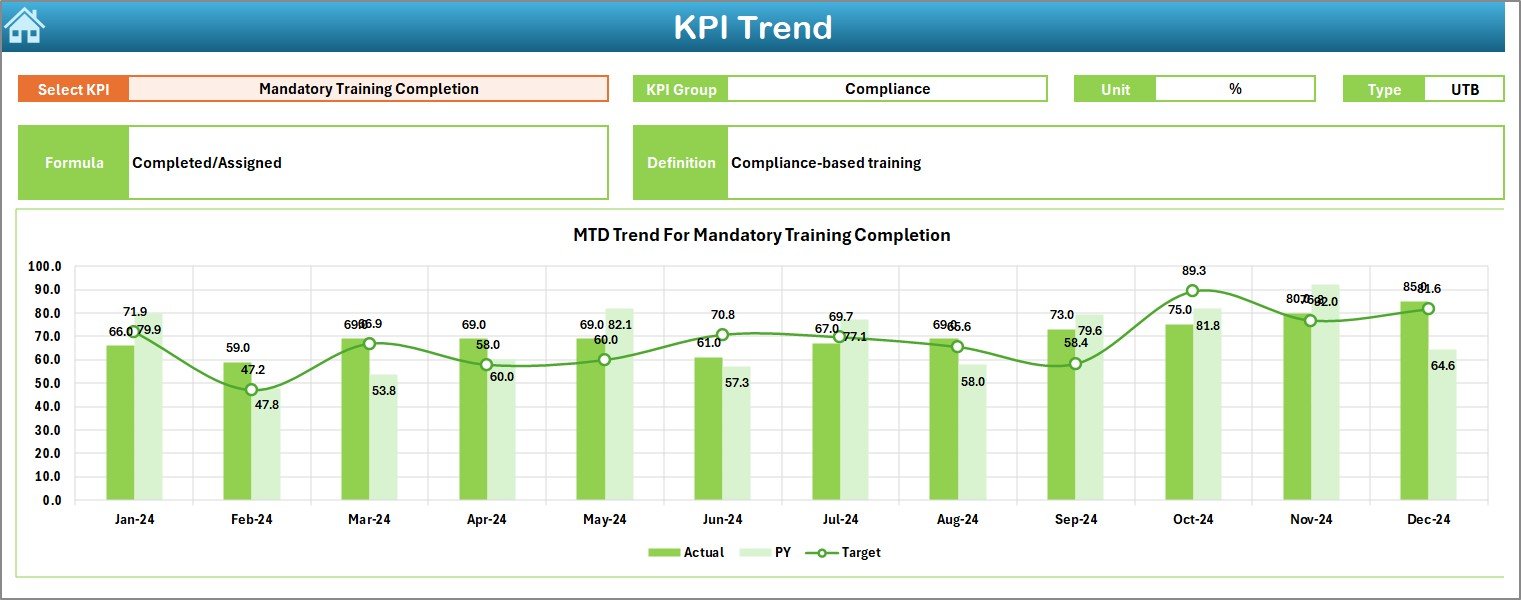
✔ 3. KPI Trend Sheet – Monthly MTD & YTD Trends
Choose a KPI from the drop-down to see:
-
KPI group
-
Unit
-
Formula
-
Definition
-
KPI Type (UTB/LTB)
Plus two clean charts for MTD and YTD trends.
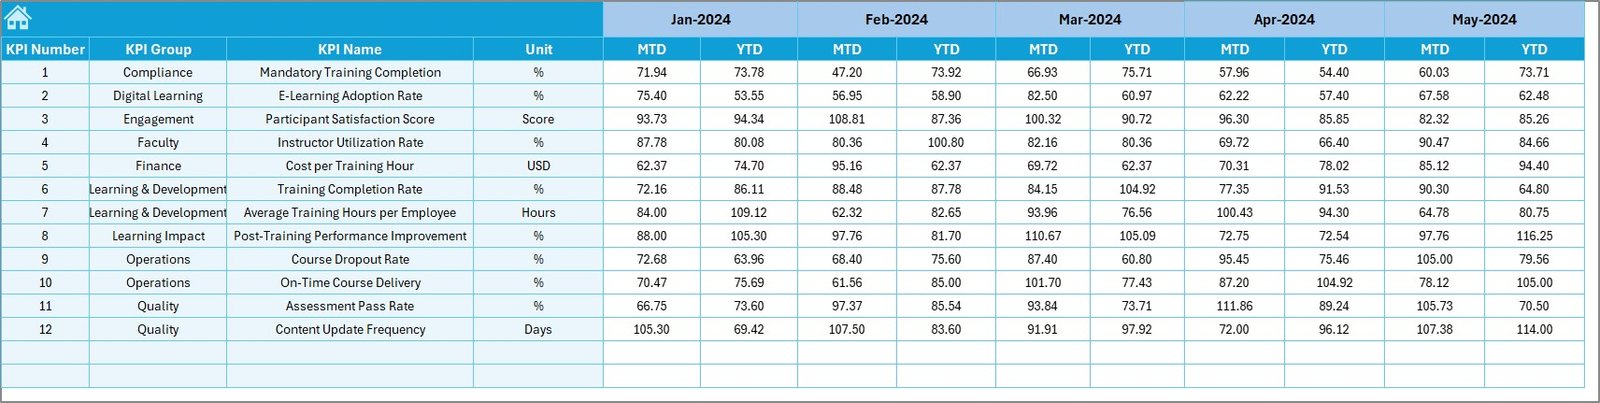
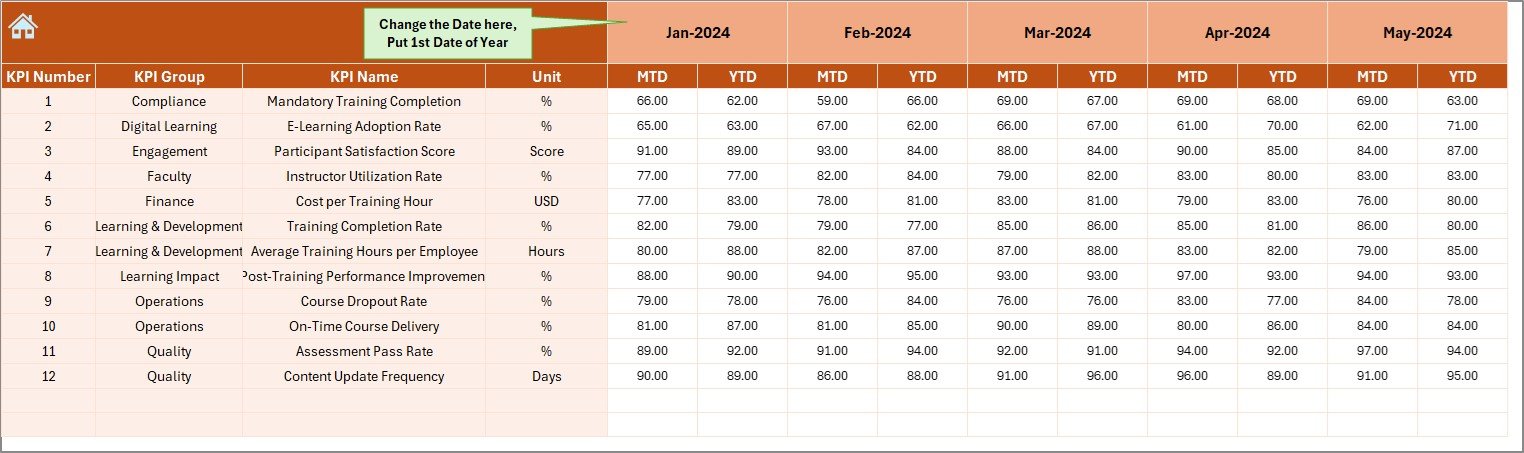
✔ 4. Actual Numbers Input Sheet
Enter actual MTD and YTD KPI values. The first month (cell E1) sets the reporting year and auto-adjusts the timeline.
✔ 5. Target Sheet
Store Monthly Targets for both MTD and YTD. These values drive the comparison charts and conditional formatting.
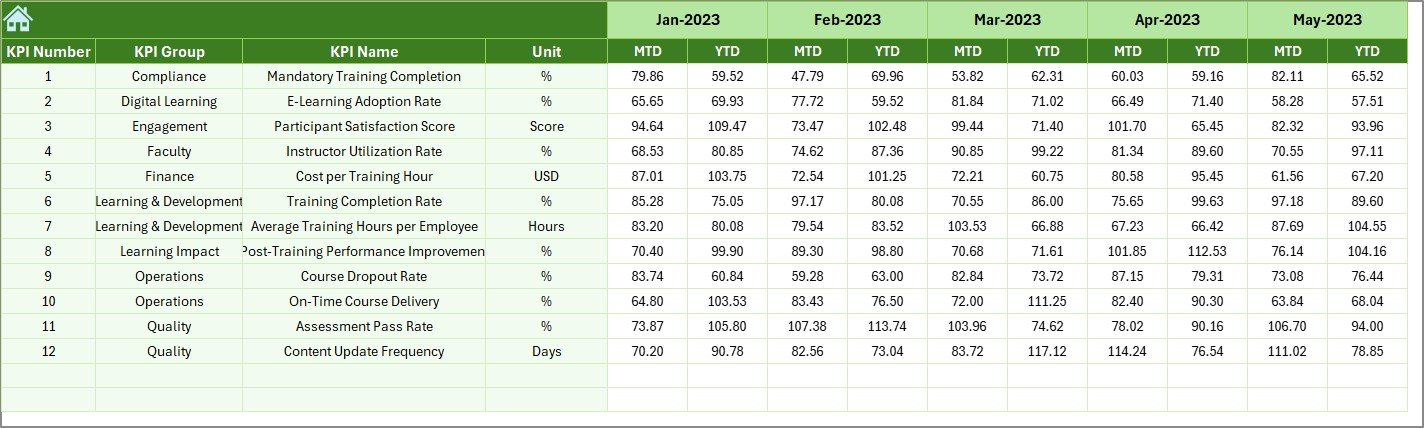
✔ 6. Previous Year Sheet
Holds last year’s MTD and YTD values to support benchmarking and growth analysis.
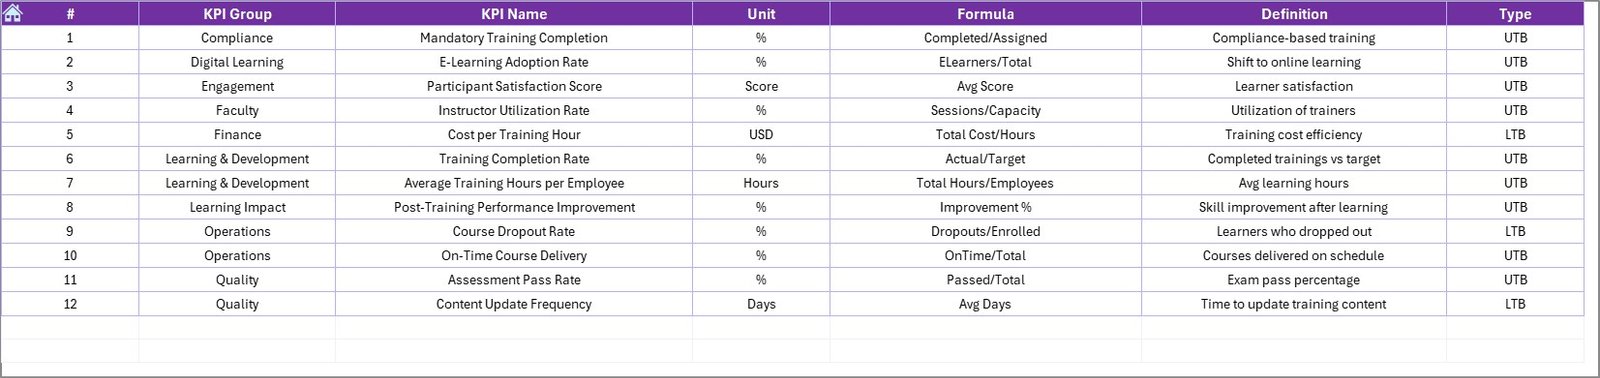
✔ 7. KPI Definition Sheet
Stores KPI formulas, definitions, groups, and units. Ensures reporting consistency across teams.
🛠 How to Use the Corporate Universities KPI Dashboard in Excel
Using this dashboard is extremely simple:
➤ Step 1: Update MTD & YTD Actuals
Enter numbers in the Actual Sheet.
➤ Step 2: Update Monthly Targets
Enter MTD and YTD targets for every KPI.
➤ Step 3: Fill Previous Year Data
Add PY numbers for comparison.
➤ Step 4: Select Month on Dashboard
All values refresh instantly with automated formulas.
➤ Step 5: View Trends for Any KPI
Use KPI Trend Sheet to see monthly MTD & YTD movement.
➤ Step 6: Review KPI Definitions
Understand formulas and KPI logic using the definition sheet.
This simple workflow ensures fast, accurate reporting every month.
👥 Who Can Benefit from This Dashboard
Ideal for:
🎓 Corporate universities
🏢 HR & L&D teams
📘 Training coordinators
📊 Organizational development managers
👨🏫 Leadership training units
🏭 Departmental training teams
🧑💼 Senior management
Whether you run onboarding programs, technical training, soft-skills workshops, or leadership academies—this dashboard supports every learning initiative.


Reviews
There are no reviews yet.