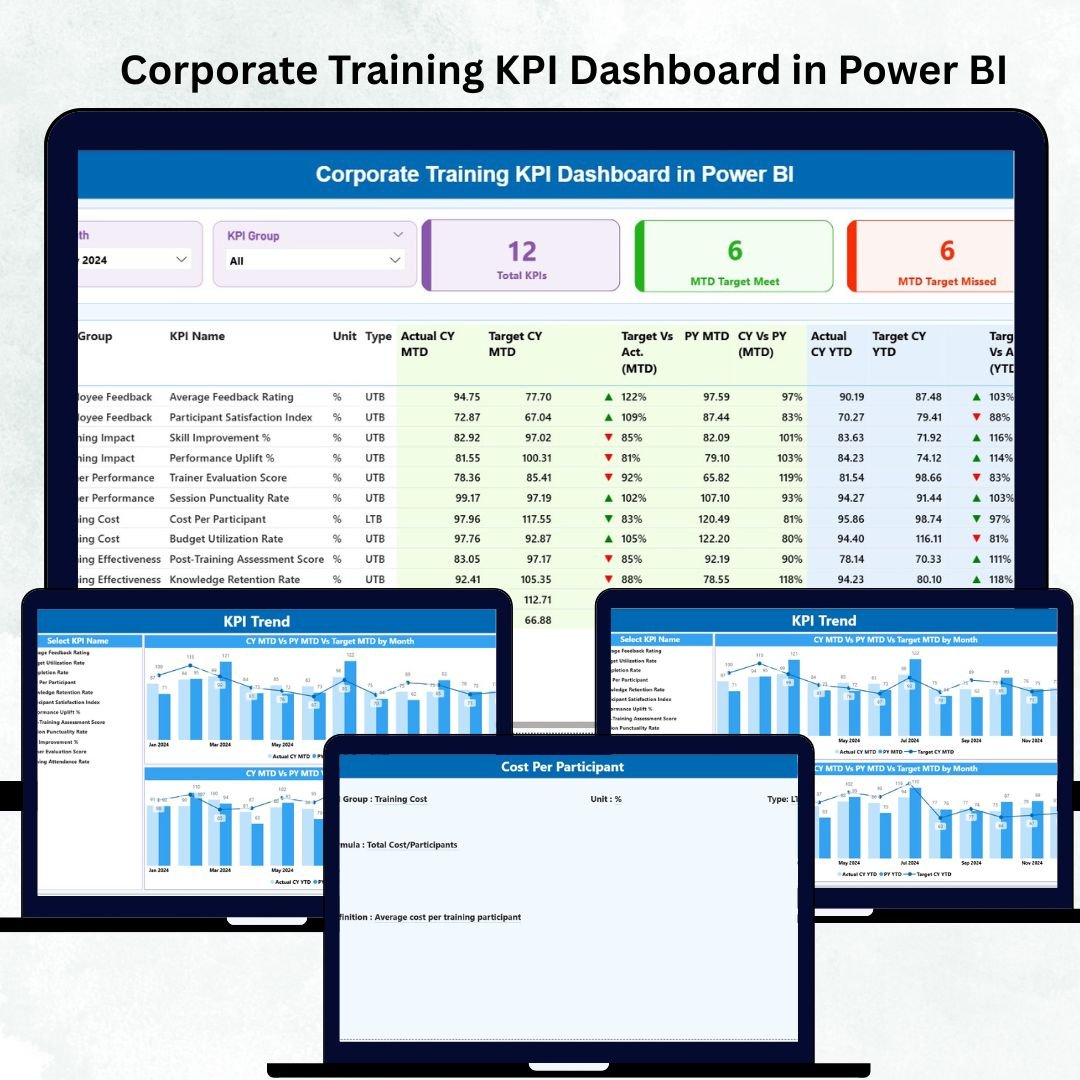
Corporate training plays a vital role in employee development, performance improvement, and long-term business success. But without the right reporting system, training managers struggle to understand which programs work, where employees need support, and how to improve skill-building initiatives. A Corporate Training KPI Dashboard in Power BI solves this problem by transforming raw training data into clear, visual, and meaningful insights.
Built using Power BI and powered by Excel data sources, this dashboard gives organizations a complete view of all training KPIs—MTD, YTD, Actual vs Target, CY vs PY, assessment performance, trainer quality, attendance, and more. With slicers, KPI cards, drill-through features, and trend charts, the dashboard helps L&D teams take smarter decisions that boost workforce productivity.
Whether you manage employee onboarding, leadership development, technical upskilling, or compliance training, this ready-to-use dashboard brings clarity, structure, and real-time reporting to your training ecosystem.
✨ Key Features of the Corporate Training KPI Dashboard in Power BI
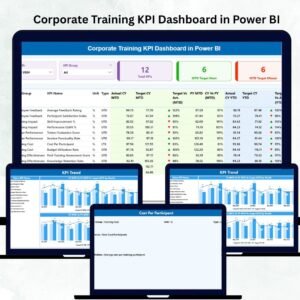
📊 Summary Page – Your Central Training Performance Hub
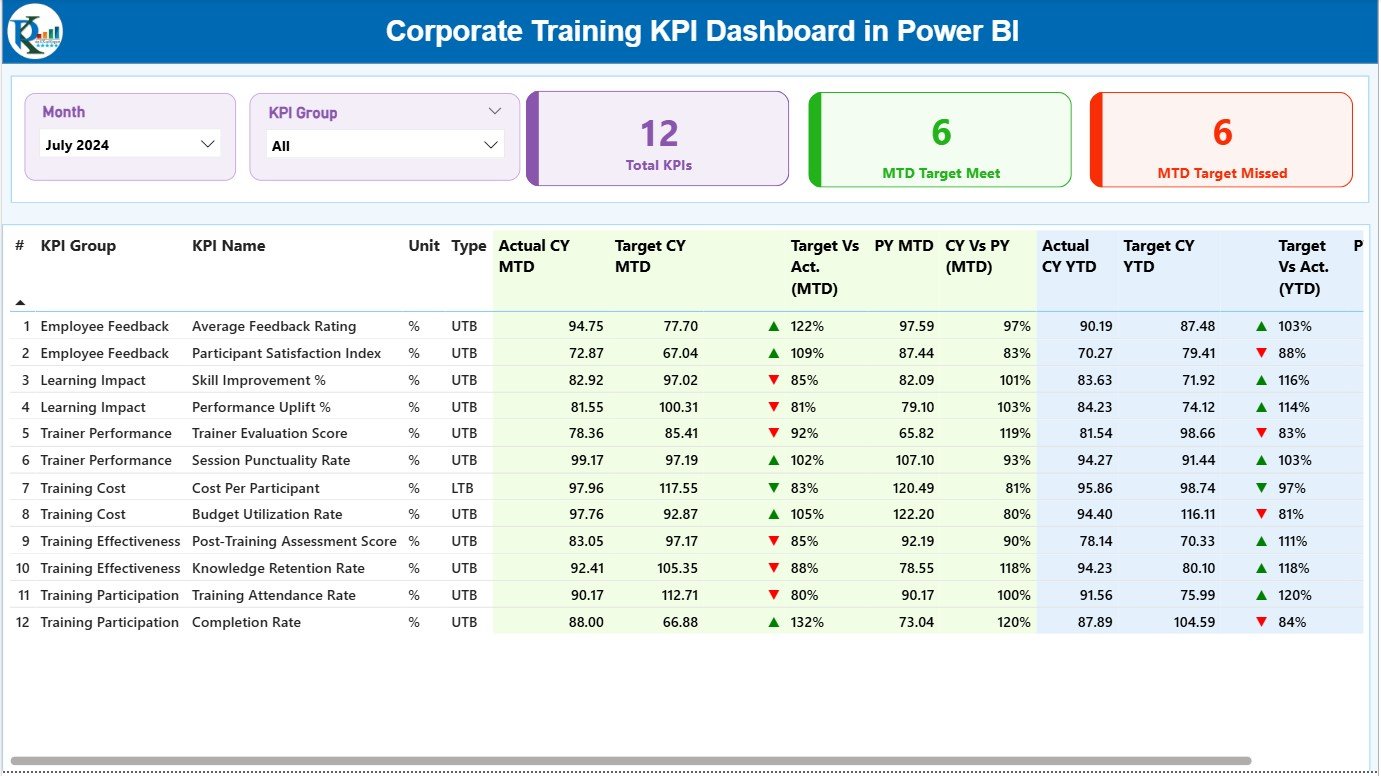
This page gives a complete overview of all training KPIs in one place.
-
🔽 Month & KPI Group Slicers – Filter data instantly by month and KPI category.
-
⭐ Key KPI Cards – View Total KPIs Count, MTD Target Met, and MTD Target Missed in a single glance.
-
📋 Detailed KPI Table – Includes:
-
KPI Number
-
KPI Group
-
KPI Name
-
Unit of Measurement
-
KPI Type (UTB / LTB)
-
Actual CY MTD & Target CY MTD
-
MTD Status Icon (▲▼)
-
Actual vs Target %
-
Previous Year MTD & CY vs PY
-
Actual CY YTD & Target CY YTD
-
YTD Status Icon (▲▼)
-
Actual vs Target YTD %
-
PY YTD & CY vs PY YTD %
-
This table gives training managers complete clarity on where performance is improving and where corrective action is needed.
📘 What’s Inside the Corporate Training KPI Dashboard in Power BI
1️⃣ Summary Page – Quick Performance Snapshot
A clean, visual interface that summarizes all training effectiveness metrics with powerful KPI cards and detailed comparisons.
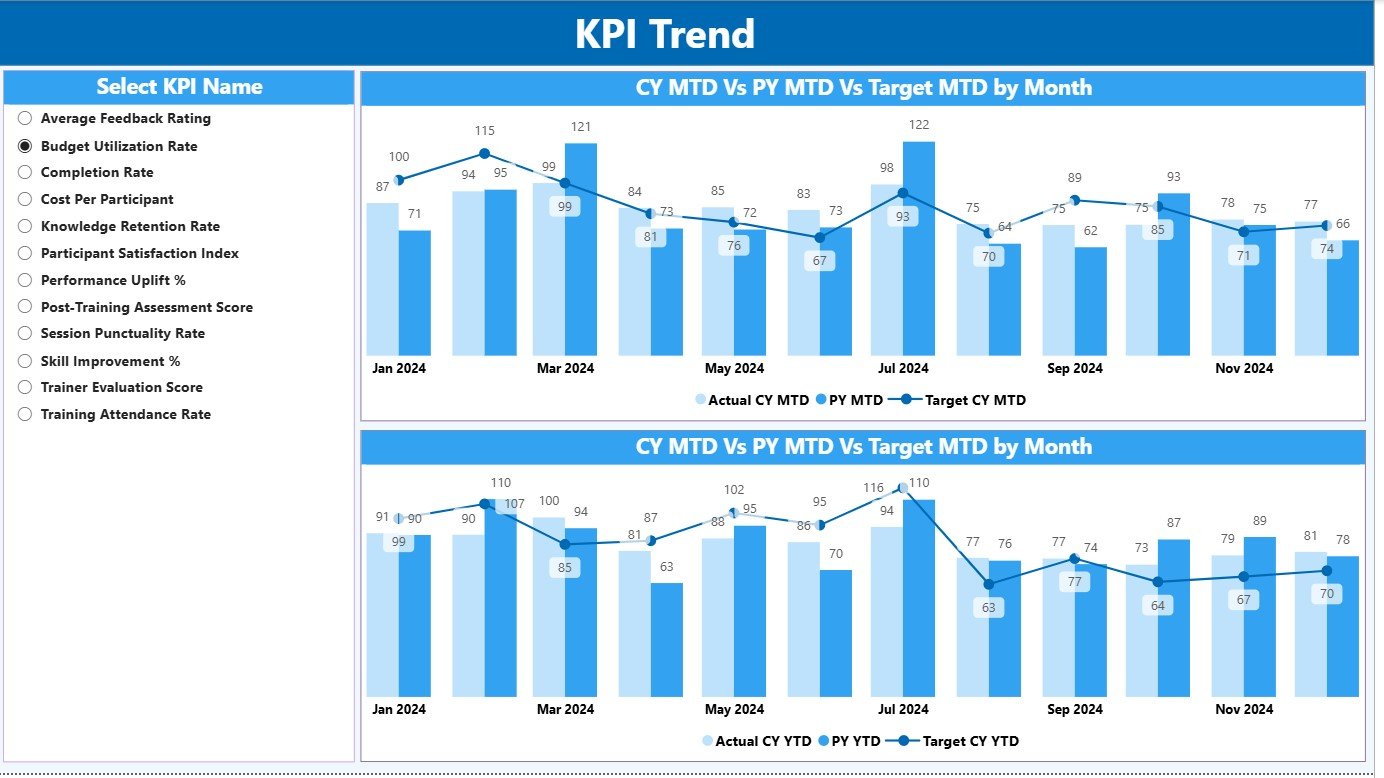
2️⃣ KPI Trend Page – Understand Performance Movement Over Time
The trend page helps L&D teams identify skill gaps, training improvements, and performance declines.
Includes two combo charts:
-
MTD Trend Chart – Actual, Target & Previous Year
-
YTD Trend Chart – Cumulative progress across the year
A KPI slicer allows users to select specific KPIs and see how they evolve month-by-month.
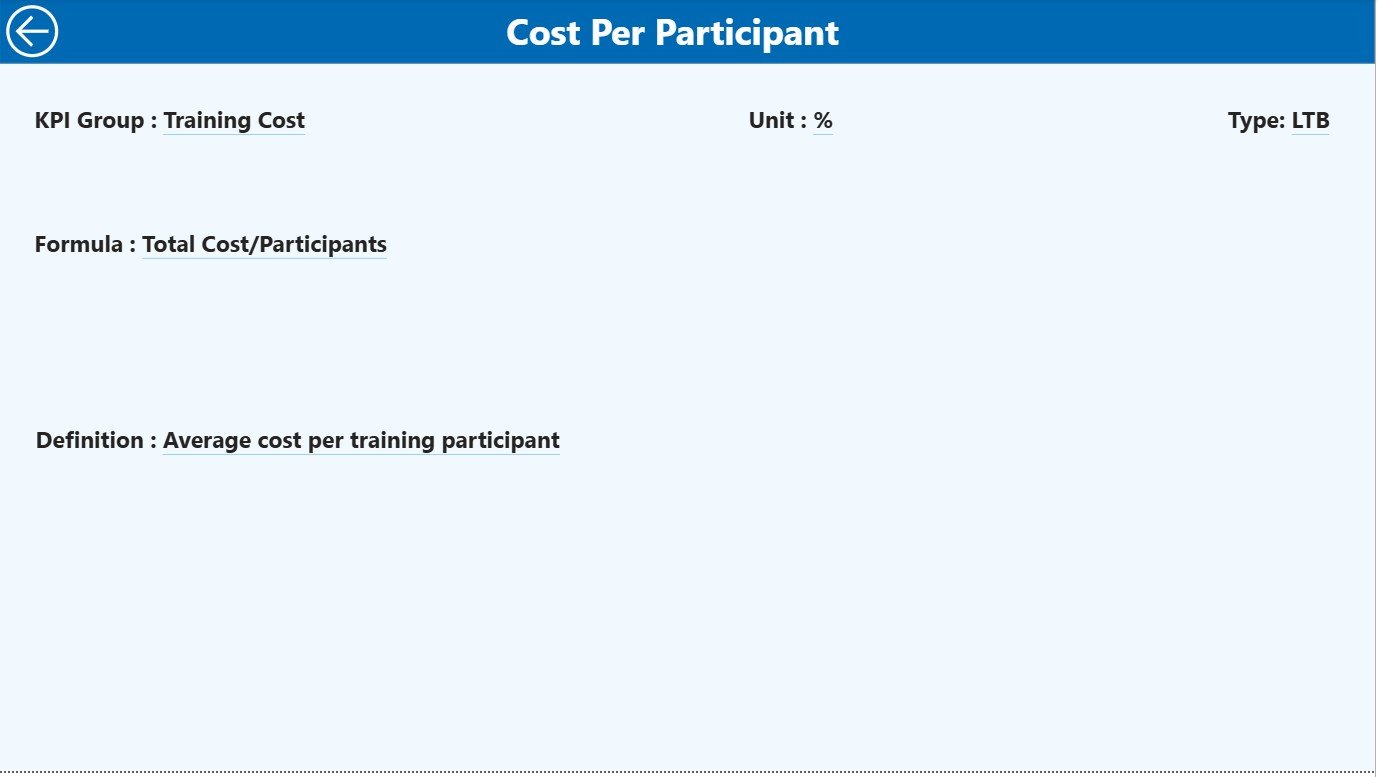
3️⃣ KPI Definition Page – Drill-Through for Metric Clarity
This hidden page becomes visible when users drill through from the summary page.
It includes:
-
KPI Name & Number
-
KPI Group
-
Unit
-
Type (UTB or LTB)
-
Formula
-
KPI Definition
Users can return to the Main Summary Page using the Back button.
🛠 How the Dashboard Works (Excel + Power BI Integration)
The dashboard connects to an Excel file containing three critical sheets:
📄 1. Input Actual Sheet
Enter:
-
KPI Name
-
Month (first day of each month)
-
MTD Actual
-
YTD Actual
📄 2. Input Target Sheet
Enter:
-
KPI Name
-
Month
-
MTD Targets
-
YTD Targets
📄 3. KPI Definition Sheet
Record all KPI metadata:
-
KPI Number
-
KPI Group
-
KPI Name
-
Unit
-
Formula
-
KPI Definition
-
Type (UTB / LTB)
Because of this structure, the dashboard updates automatically whenever data is refreshed.
🎯 Who Can Benefit from This Corporate Training KPI Dashboard
🏢 Corporate L&D Teams
Track training effectiveness across departments and skill sets.
👩💼 HR Departments
Monitor employee participation, learning outcomes, and compliance scores.
🧑🏫 Training Managers & Instructors
Analyze trainer performance, learner engagement, and assessment quality.
🧑💻 Talent Development Teams
Identify training gaps and plan future programs strategically.
👥 Leadership Teams
Understand overall workforce skill progress and training ROI.
🔍 Why Organizations Need This Dashboard
-
📈 Measure training effectiveness accurately
-
🎯 Align training goals with business objectives
-
⚡ Take rapid action based on real-time performance
-
🧮 Compare Actual vs Target results instantly
-
📊 Track year-over-year training performance
-
🧠 Spot learning gaps and improvement areas early
-
🔧 Customize KPIs, visuals, and layouts anytime
-
💰 Save time and reduce manual reporting efforts


Reviews
There are no reviews yet.