Running a convenience store chain without real-time performance visibility is like driving in traffic with your eyes closed. Sales may look healthy on the surface, but margins, inventory gaps, missed targets, and operational inefficiencies silently eat into profits. Because convenience stores operate on thin margins and high volumes, decisions must be fast, accurate, and data-driven.
That is exactly why the Convenience Stores KPI Dashboard in Power BI is a must-have analytics solution for modern retailers.
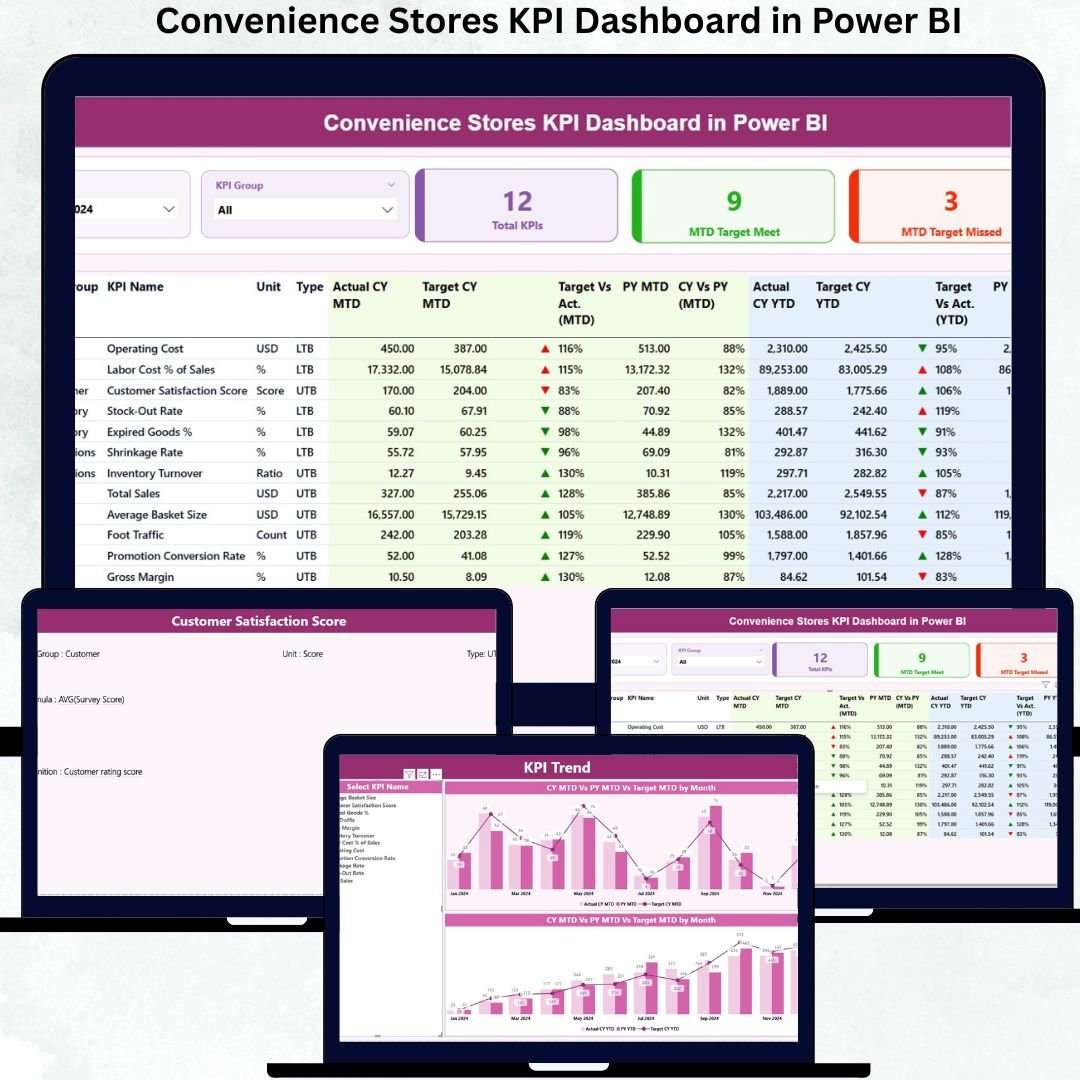
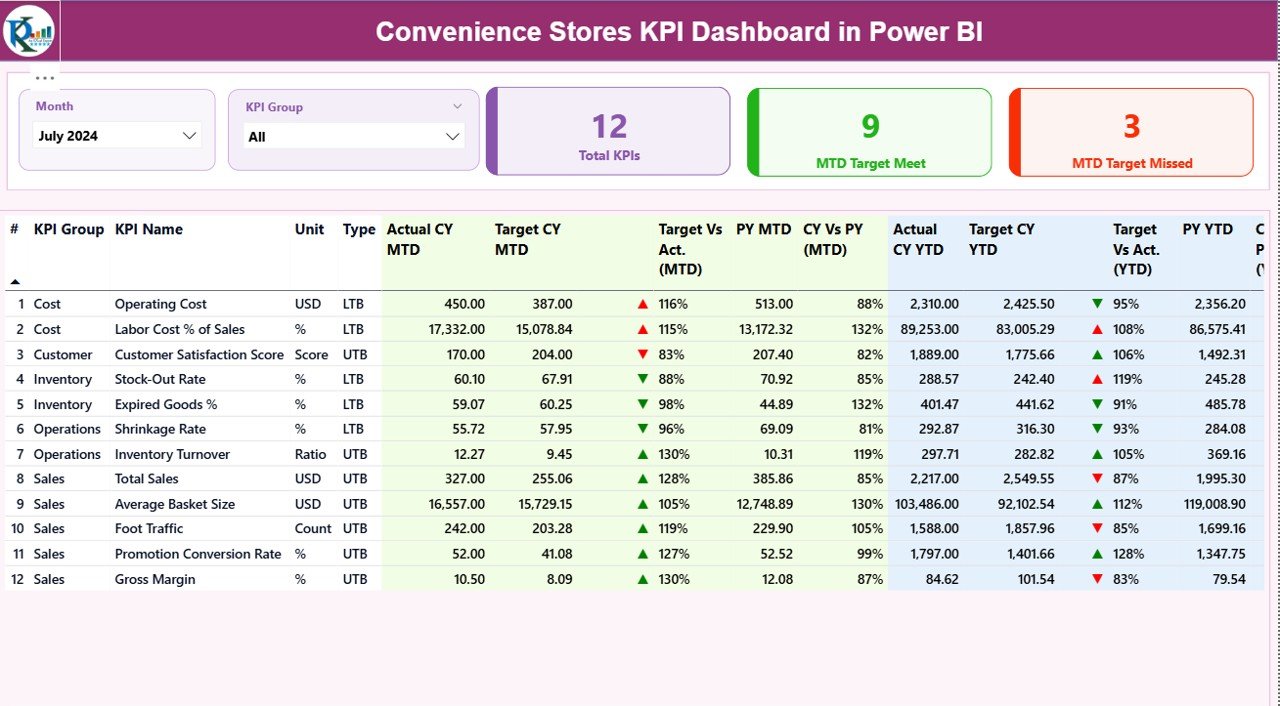
This ready-to-use Power BI dashboard converts scattered Excel data into a single, interactive performance control center. It gives store owners, regional managers, and retail analysts instant visibility into KPIs, targets, trends, and gaps—without manual reporting or complex calculations. With Excel as the data source and Power BI for visualization, this dashboard delivers speed, clarity, and scalability in one powerful package.
Whether you manage a single store or a multi-location chain, this dashboard helps you monitor what matters every day and take action before problems grow.
Key Features of Convenience Stores KPI Dashboard in Power BI
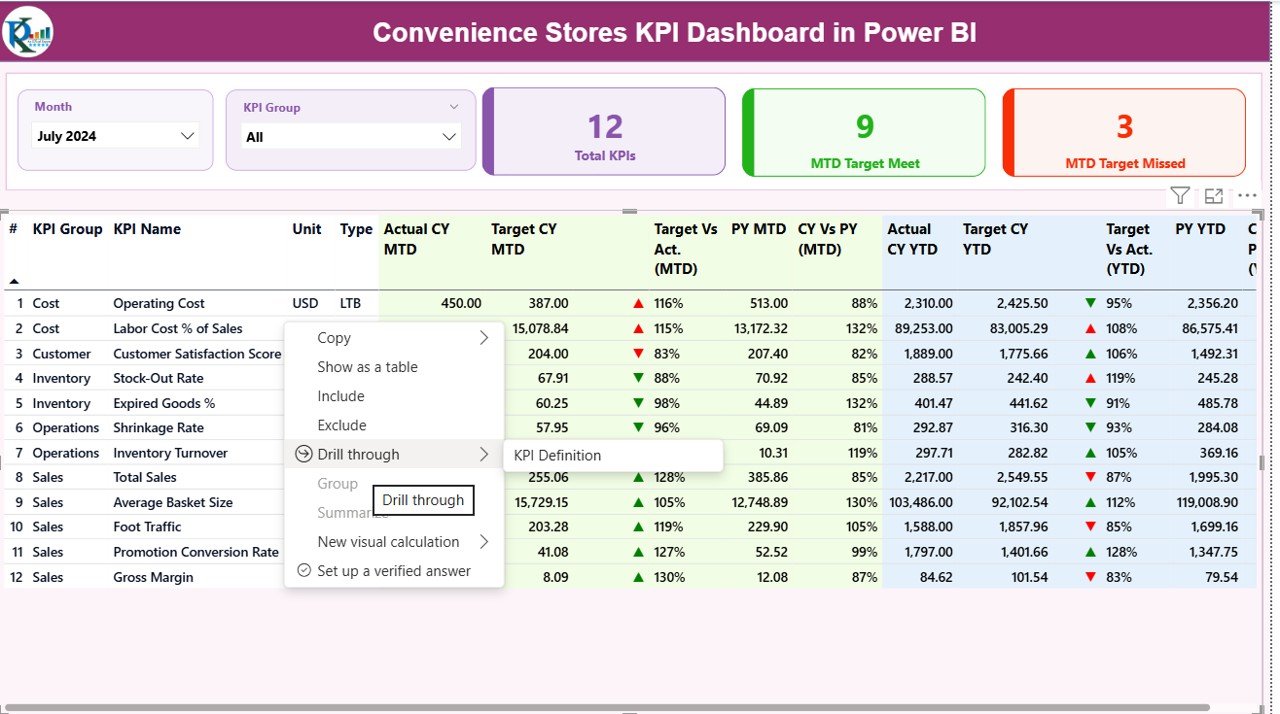
📊 Executive-Ready Summary Page
Instantly view overall KPI performance with Total KPIs, MTD Target Met, and MTD Target Missed cards.
📅 Dynamic Month & KPI Group Slicers
Switch months or focus on specific KPI categories in one click.
✅ Complete MTD & YTD Performance Tracking
Track Actual vs Target for both Month-to-Date and Year-to-Date.
📈 CY vs PY Comparison
Compare current year performance with previous year results to spot growth or decline.
🔴🟢 Visual KPI Status Indicators
Green and red arrows immediately highlight achieved and missed targets.
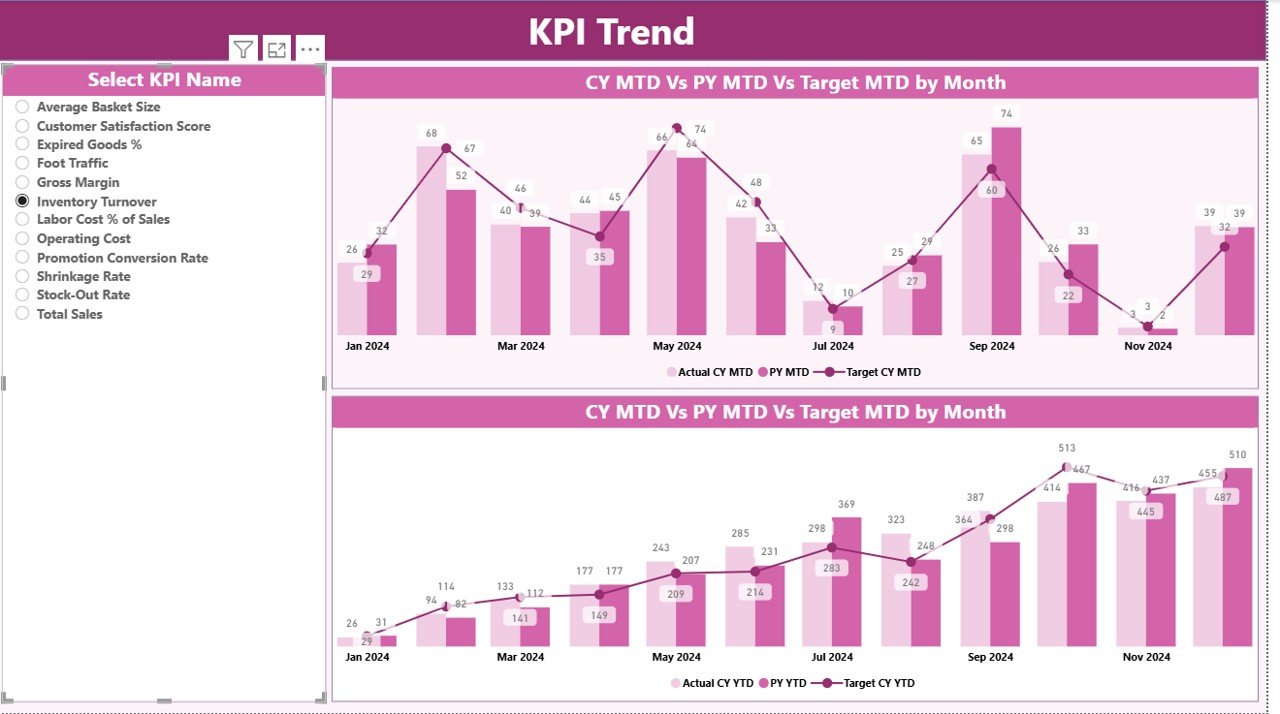
📉 Interactive KPI Trend Analysis
Analyze MTD and YTD trends using combo charts for deeper insights.
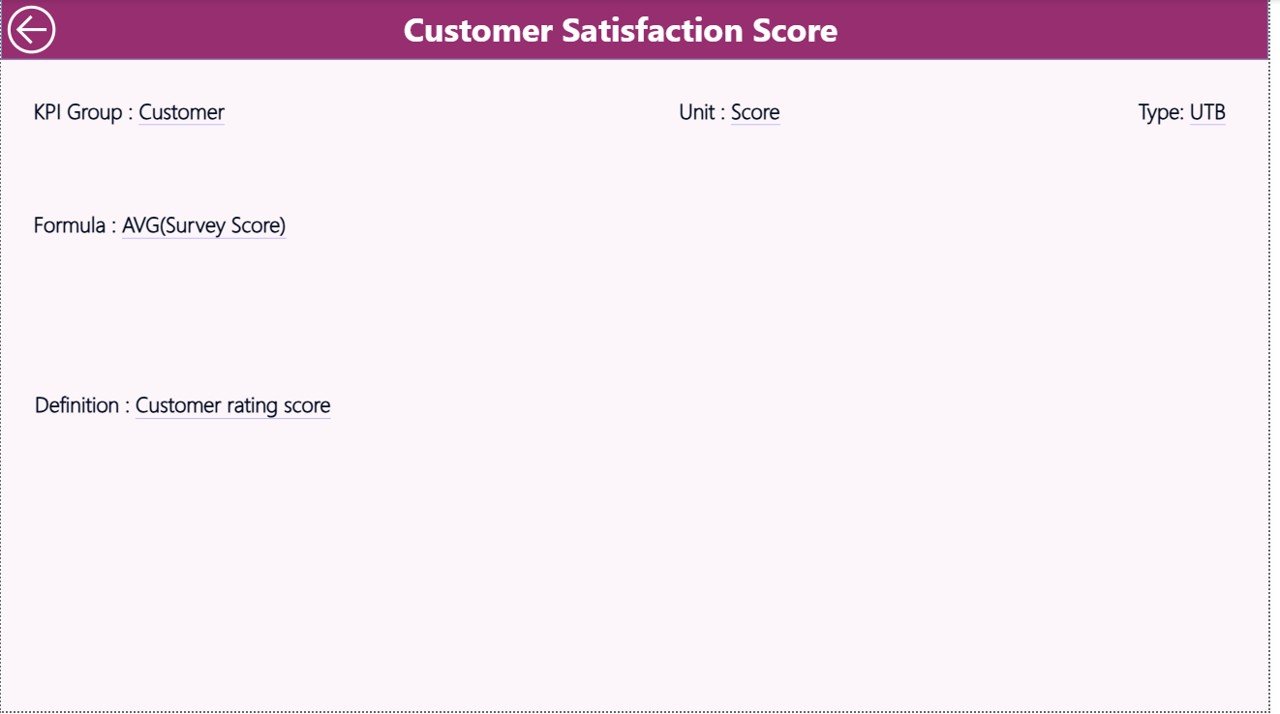
📘 Built-in KPI Definition Page
View KPI formulas and definitions via drill-through—no confusion, no guesswork.
📂 Simple Excel-Based Data Input
Update data in Excel and refresh Power BI—no Power BI expertise required.
What’s Inside the Convenience Stores KPI Dashboard in Power BI
📌 Power BI Dashboard File (.pbix)
Includes three professionally designed pages:
-
Summary Page
-
KPI Trend Page
-
KPI Definition Page
📌 Excel Data Input File
-
Input_Actual sheet for actual values
-
Input_Target sheet for target data
-
KPI Definition sheet for metadata and logic
📌 Pre-Built KPIs Structure
-
Sales KPIs
-
Inventory KPIs
-
Cost & Margin KPIs
-
Operational KPIs
📌 Ready-to-Use Visuals
-
KPI tables
-
Performance cards
-
Combo trend charts
-
Status indicators
Everything is structured, scalable, and business-ready.
How to Use the Convenience Stores KPI Dashboard in Power BI
🚀 Step 1: Enter actual performance data in the Excel Input_Actual sheet
🎯 Step 2: Update monthly and yearly targets in the Input_Target sheet
📊 Step 3: Maintain KPI details in the KPI Definition sheet
🔄 Step 4: Refresh the Power BI dashboard
📈 Step 5: Analyze KPIs, trends, and gaps instantly
No manual calculations. No broken formulas. Just insights.
Who Can Benefit from This Convenience Stores KPI Dashboard in Power BI
🏪 Convenience Store Owners – Gain complete control over store performance
🧭 Regional & Area Managers – Track targets across teams and locations
📊 Retail & Business Analysts – Perform trend, gap, and KPI analysis
💼 Operations Heads – Improve accountability and execution
💰 Finance & Planning Teams – Monitor margins, targets, and efficiency
Whether you manage one store or an entire retail network, this dashboard adapts to your business.
Click here to read the Detailed blog post
Watch the step-by-step video tutorial:


Reviews
There are no reviews yet.