
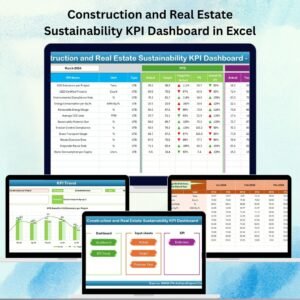
🌱 Construction and Real Estate Sustainability KPI Dashboard in Excel
In today’s construction and real estate industry, sustainability isn’t just a trend — it’s a core business priority. Clients expect eco-friendly practices, regulatory bodies demand detailed sustainability reporting, and companies that fail to track their environmental impact risk losing both revenue and reputation.
The Construction and Real Estate Sustainability KPI Dashboard in Excel is a powerful and cost-effective solution designed to help builders, developers, and property managers monitor their sustainability performance with ease. Instead of juggling multiple spreadsheets, emails, and static reports, this interactive Excel-based dashboard gives you real-time visibility into the KPIs that matter most — including energy usage, carbon emissions, water consumption, waste generation, and recycling rates.
Whether you’re managing a single project or overseeing sustainability across multiple sites, this dashboard provides you with structured data, visual insights, and actionable analytics — all in one place.
✨ Key Features of the Construction and Real Estate Sustainability KPI Dashboard
✅ Home Sheet (Quick Navigation Hub) – Easily jump to any sheet with one click. Perfect for first-time users and rapid access.
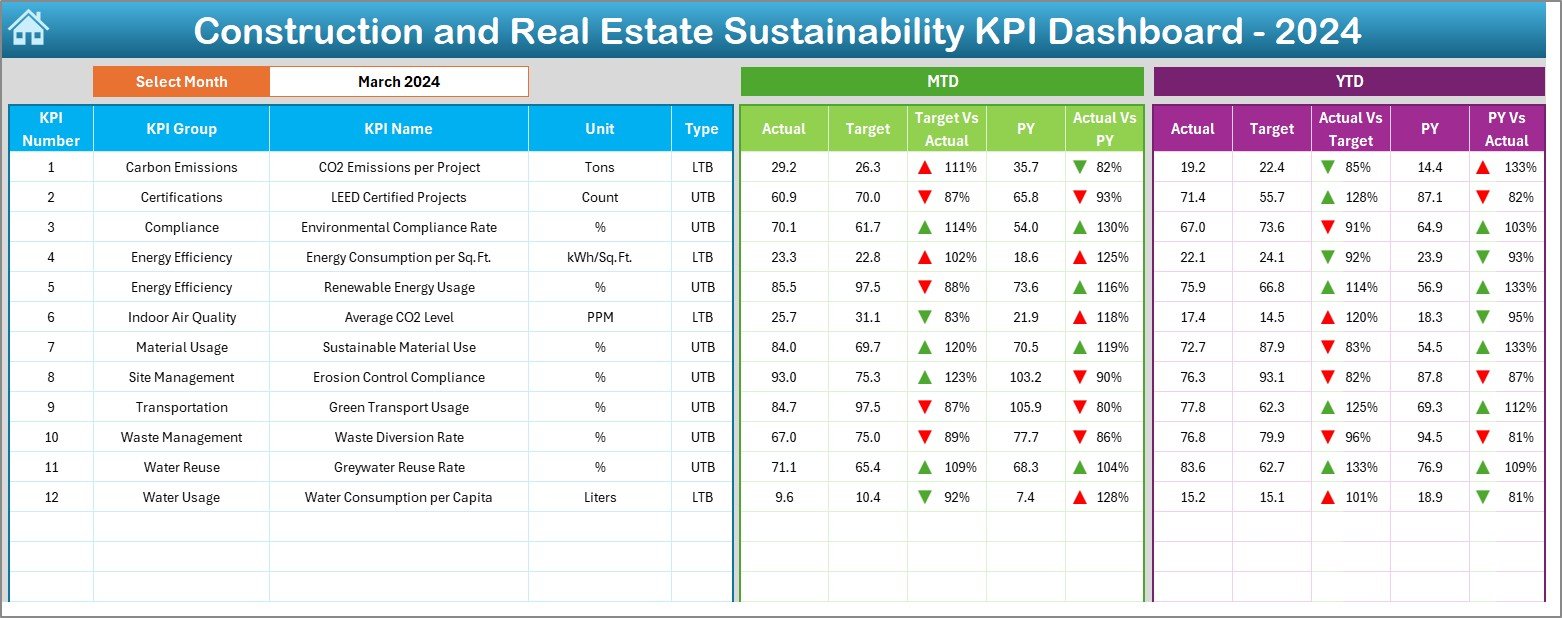
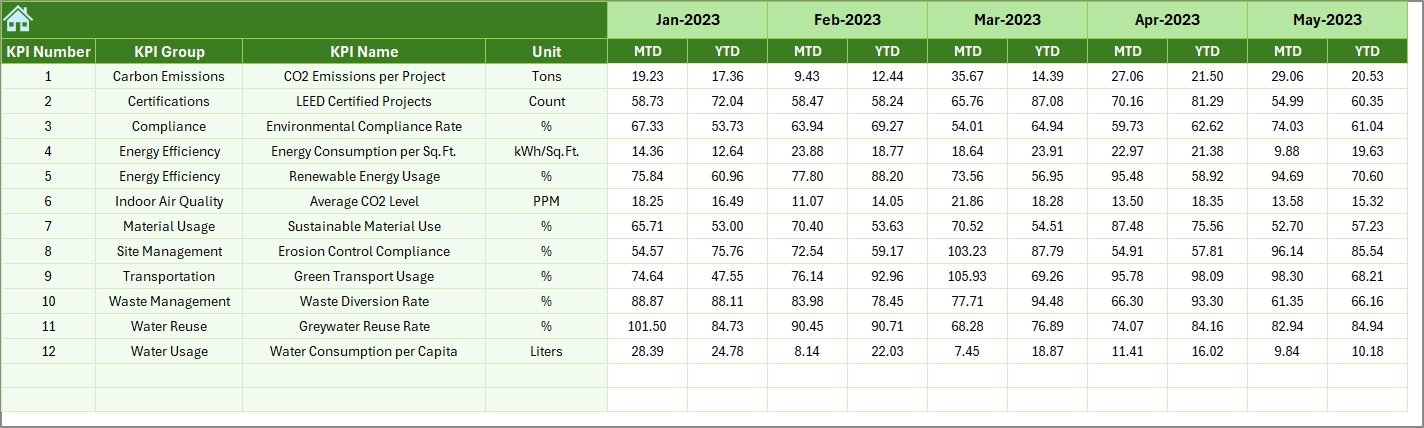
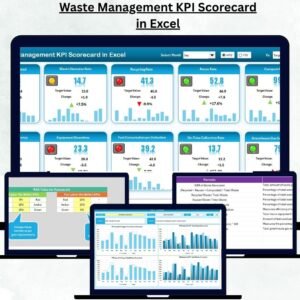
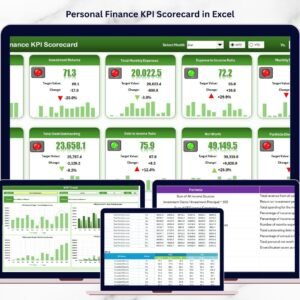
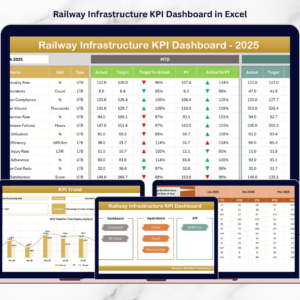
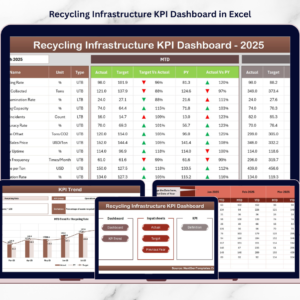
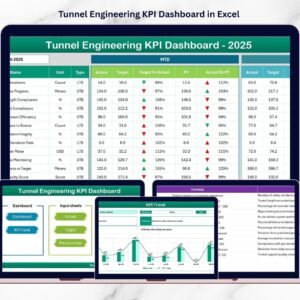
✅ Dashboard Sheet – Live performance overview of all KPIs with MTD vs Target vs Previous Year comparisons, plus YTD values.
✅ Conditional Formatting – Arrow icons instantly signal whether performance is improving or declining.
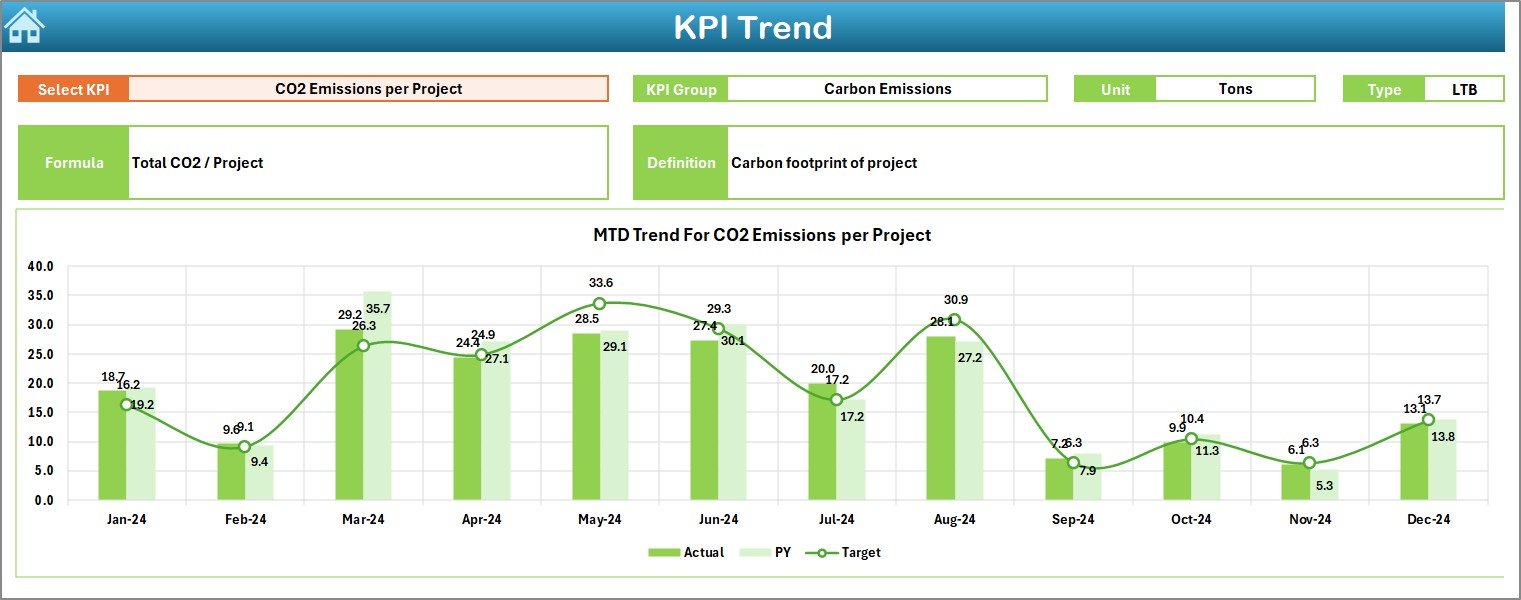
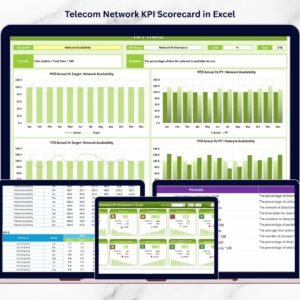
✅ KPI Trend Sheet – Select any KPI and analyze its monthly trend across the year (both MTD and YTD). Includes KPI definition, group, unit, and formula for full transparency.
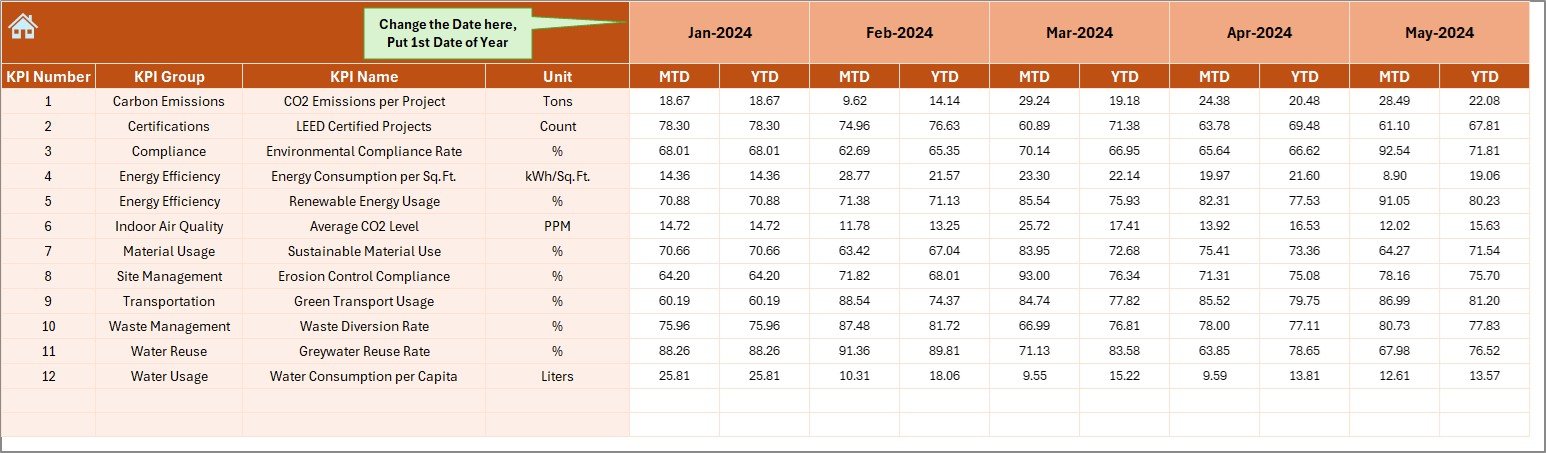
✅ Actual Numbers Input Sheet – Enter the monthly real performance values. Flexible start-month to suit both calendar and fiscal years.
✅ Target Sheet – Define monthly targets for each KPI (MTD & YTD) and measure actual progress against them.
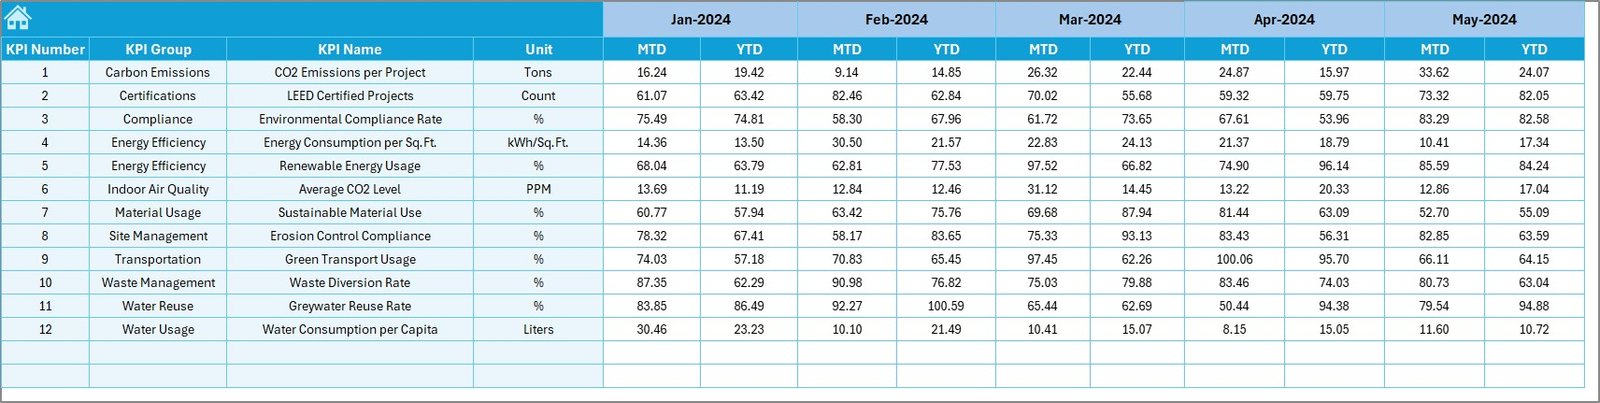
✅ Previous Year Numbers Sheet – Store historical data for year-on-year comparison and accurate benchmarking.
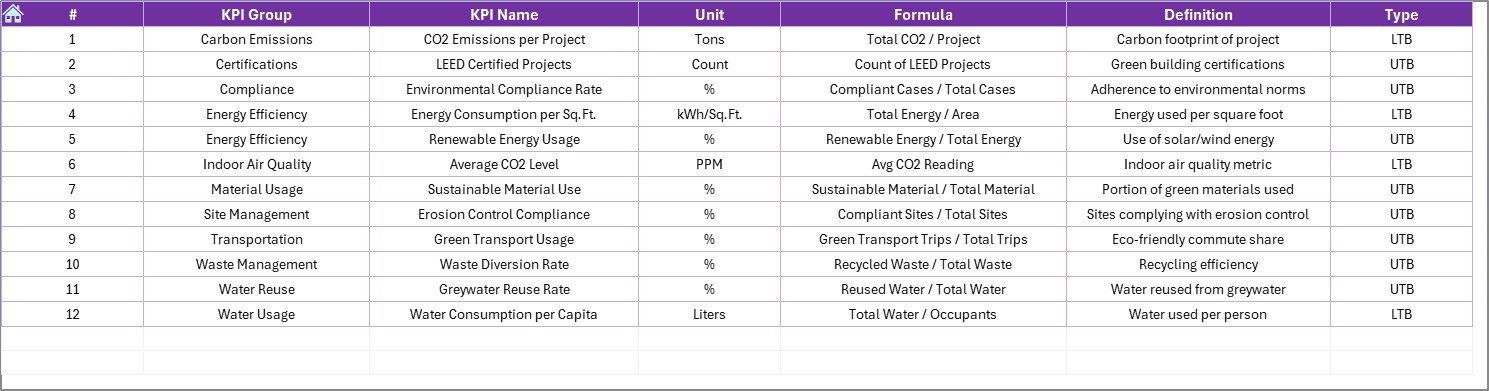
✅ KPI Definition Sheet – Central place to define KPI names, units, formulas, and whether a higher or lower value is better (UTB or LTB).
📂 What’s Inside the Sustainability KPI Dashboard
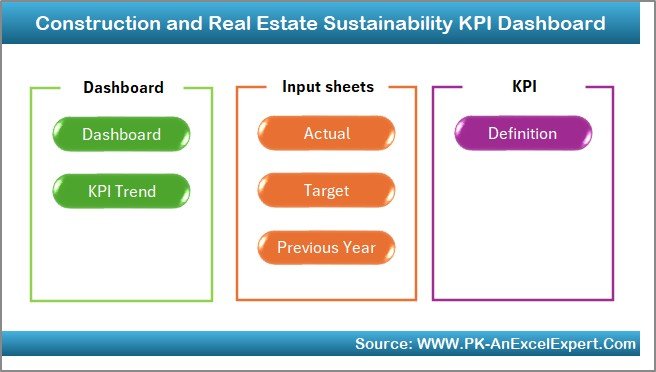
This template includes seven structured worksheets:
| Sheet Name | Purpose |
|---|---|
| Home | Navigation hub with clickable buttons |
| Dashboard | High-level performance overview of all KPIs |
| KPI Trend | Detailed trend analysis for a selected KPI |
| Actual | Monthly entry of actual performance data |
| Target | Monthly entry of MTD / YTD targets |
| Previous Year | Historical data for baseline comparison |
| KPI Definition | Setup and documentation of all KPIs |
Each page is fully dynamic and automatically connected to the dashboard and charts — no manual calculations required!
🛠 How to Use the Sustainability KPI Dashboard (Step-by-Step)
-
Define Your KPIs → Add KPI name, unit, and formula in the KPI Definition Sheet.
-
Set Targets → Enter monthly MTD and YTD targets in the Target Sheet.
-
Enter Actual Data → Record monthly sustainability performance in the Actual Numbers Input Sheet.
-
Add Previous Year Values → Input last year’s numbers in the Previous Year Sheet for comparison.
-
Review the Dashboard → Go to the Dashboard Sheet, select a month, and view the KPI performance with arrows and charts.
-
Explore Trends → Visit the KPI Trend Sheet to analyze each KPI over the full year.
-
Take Action → Use the visual insights to adjust strategies, reduce waste, and improve sustainability performance.
🎯 Who Can Benefit from This Dashboard
🏗 Construction Project Managers – Identify inefficiencies and act before they impact sustainability goals.
🏢 Real Estate Developers – Track energy, water, and waste KPIs across multiple developments.
🌍 Sustainability Teams – Monitor performance and prepare reports for clients & regulators.
📈 Executives & Board Members – Get a clear, visual overview for better decision-making.
🚀 Why This Tool is a Must-Have
-
✅ Real-Time Sustainability Insights
-
✅ Regulatory & Client Reporting Readiness
-
✅ Structured, Centralized Data Management
-
✅ Quick Identification of Gaps & Underperformance
-
✅ No Coding or Software Required – 100% Excel-Based
📖 Click here to read the Detailed blog post
Visit our YouTube channel to learn step-by-step video tutorials
Watch the step-by-step video tutorial:


Reviews
There are no reviews yet.