
The Conditional Formatting in Multiple Batteries Chart is a visually engaging Excel tool that helps you represent data with multiple progress bars (batteries) and conditional formatting, allowing for clearer data interpretation and decision-making. This chart is ideal for visualizing performance metrics, project progress, sales data, and KPIs across multiple categories, all within a single chart.
The use of multiple batteries with conditional formatting allows you to quickly highlight key performance indicators in real-time. Whether you’re monitoring team productivity, sales targets, or project milestones, this chart dynamically updates to reflect the data input and changes in performance, providing you with actionable insights to improve efficiency and achieve your goals.
Key Features of the Conditional Formatting in Multiple Batteries Chart:
⚡ Multiple Batteries for Data Representation
Display several metrics (KPIs, project progress, sales figures, etc.) in individual battery progress bars. This format makes it easy to compare multiple data points in one chart, ensuring you have an at-a-glance view of performance.
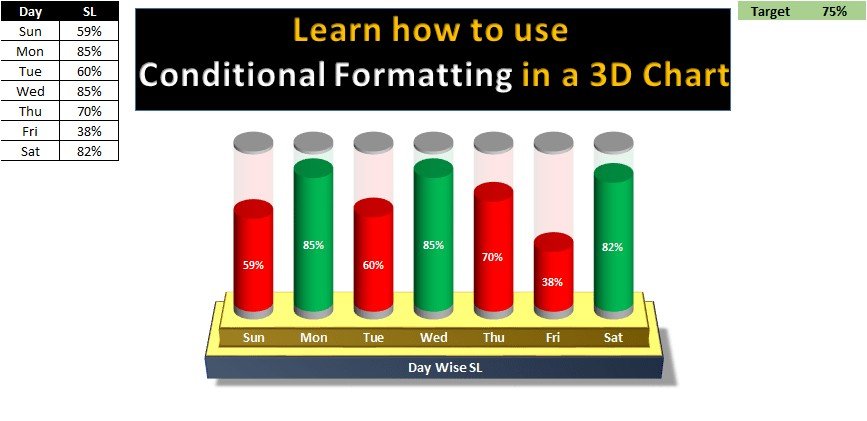
🎨 Conditional Formatting for Visual Impact
Automatically change the color of each battery as the data changes, helping you to easily identify progress and areas that require attention. For example, when a metric is on track, it may appear green, while when it is behind schedule, it turns red.
📈 Customizable Performance Indicators
Adjust the chart to reflect your specific needs. Whether you’re tracking project milestones, team performance, or business KPIs, this chart allows you to input your unique data and customize the chart to suit your organizational requirements.
🔄 Real-Time Data Updates
The chart updates automatically in real-time as you input or modify your data, ensuring that your charts are always accurate and up-to-date.
📊 Easy-to-Read Design
With clearly labeled progress bars and color-coded indicators, the chart makes it easy to read and interpret complex data at a glance, enabling you to make informed decisions quickly.
Why You’ll Love the Conditional Formatting in Multiple Batteries Chart:
✅ Streamline Data Visualization – Represent multiple metrics in a single, easy-to-understand chart with color-coded batteries, allowing you to track performance effortlessly. ✅ Real-Time Monitoring – Watch as your data automatically updates and adjusts, reflecting your performance in real-time. ✅ Quickly Spot Trends – Use the color-coding system to quickly identify which metrics are on track and which need attention. ✅ Fully Customizable – Adjust the chart’s colors, labels, and data to suit your specific needs, whether you’re tracking sales, project milestones, or team performance. ✅ Perfect for Dashboards and Presentations – This chart is ideal for presenting performance data in dashboards, reports, and presentations, making it an excellent choice for decision-makers.
What’s Inside the Conditional Formatting in Multiple Batteries Chart:
- Multiple Batteries for Tracking – Monitor multiple KPIs or metrics in one chart using color-coded battery progress bars.
- Conditional Formatting – Use automatic color changes to highlight data points based on performance.
- Customizable Design – Tailor the chart’s appearance to your unique requirements, from colors to labels.
- Real-Time Updates – As data is input, the chart updates automatically, providing real-time insights.
- Simple Layout – The easy-to-read layout makes it simple to track and interpret data at a glance.
How to Use the Conditional Formatting in Multiple Batteries Chart:
1️⃣ Download the Template – Access your Excel file instantly after purchase. 2️⃣ Input Your Data – Enter your data and KPIs into the designated fields. 3️⃣ Customize the Chart – Adjust the colors, labels, and appearance of the batteries to match your needs. 4️⃣ Track and Analyze Performance – Use the chart to monitor your progress and make adjustments where necessary.
Who Can Benefit from the Conditional Formatting in Multiple Batteries Chart:
- Business Owners
- Project Managers
- Sales Teams
- Marketing Teams
- Operations Managers
- Data Analysts
- HR and Performance Management Teams
This chart is perfect for anyone looking to monitor performance, visualize progress, and make data-driven decisions in an easy-to-understand, visually compelling format.
Click here to read the Detailed blog post
https://www.pk-anexcelexpert.com/conditional-formatting-in-multiple-batteries-chart/


Reviews
There are no reviews yet.