Compliance Tracking Dashboard in HTML is a powerful, interactive, and ready-to-use analytics solution built for compliance officers, risk managers, legal teams, operations managers, and quality assurance professionals who need to monitor compliance tasks, track estimated costs, analyze departmental compliance rates, and evaluate timeline trends from a single centralized web-based interface. This dashboard includes 5 interactive analytical pages and a comprehensive data view — making it one of the most complete HTML Dashboard Templates for compliance management available today.
Compliance Tracking Dashboard in HTML transforms your approach to regulatory compliance monitoring by delivering real-time visual insights through a modern browser-based interface. The dashboard tracks 5 key metrics including Total Tasks, Compliance Rate, Total Estimated Cost, Non-Compliant, and Avg Time Spent (hrs) — giving you complete visibility into your compliance operations across departments, compliance areas, responsible persons, and monthly timelines.
🔑 Key Features of Compliance Tracking Dashboard in HTML
📊 5 Interactive Dashboard Pages + Data View — Overview, Department Analysis, Compliance Areas, Timeline Analysis, and Data View deliver 360-degree visibility into compliance task management, cost tracking, and performance monitoring.
📈 5 High-Level KPI Cards on Overview — Total Tasks, Compliance Rate, Total Estimated Cost, Non-Compliant, and Avg Time Spent (hrs) provide an executive-level summary of your compliance health instantly.
🎛 Multiple Slicers for Quick Filtering — Apply dynamic filters across the entire dashboard to quickly drill down into specific departments, compliance areas, responsible persons, or time periods.
🏢 Department Analysis Module — Dedicated page analyzes Compliance Rate by Department, Estimated Cost by Department, Status Breakdown by Department, Avg Time Spent by Department, and Compliance Type by Department for granular department-level insights.
📋 Compliance Areas Breakdown — Track Tasks by Compliance Area, Compliance Rate by Area, Tasks by Compliance Type, Estimated Cost by Compliance Type, and Time Spent by Compliance Area to understand which compliance domains demand the most resources.
📅 Timeline Analysis — Visualize Monthly Estimated Cost, Monthly Time Spent, Monthly Status Breakdown, Avg Days Overdue by Month, and Tasks by Responsible Person per Month for historical trend analysis and capacity planning.
🔍 Data Explorer with Search and Export — Access a detailed data table with search functionality, sortable columns, pagination, and CSV export for deeper analysis of all compliance records.
🔒 100% Client-Side Privacy — All data processing happens locally in your browser. No server, no tracking, no cloud dependency — your compliance data stays completely private and secure.
📦 What’s Inside the Compliance Tracking Dashboard in HTML
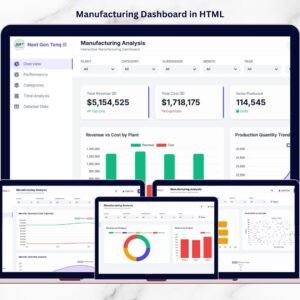
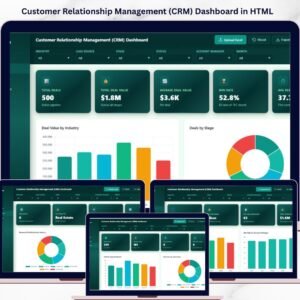
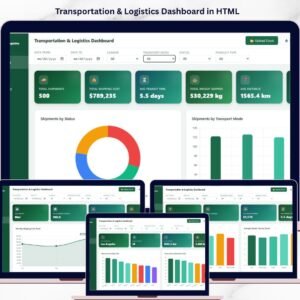
📁 1 — Overview Page — Displays 5 KPI cards (Total Tasks, Compliance Rate, Total Estimated Cost, Non-Compliant, Avg Time Spent) along with charts showing Compliance Status Distribution analyzing the breakdown of compliant vs non-compliant tasks, Tasks by Department revealing which departments carry the highest compliance workload, Estimated Cost by Compliance Area showing cost distribution across regulatory domains, Tasks by Responsible Person tracking individual workload distribution, and Monthly Task Distribution revealing seasonal patterns in compliance activity. Multiple slicers allow instant filtering across all dimensions.
📁 2 — Department Analysis — Deep-dive into department-level compliance performance with charts showing Compliance Rate by Department, Estimated Cost by Department, Status Breakdown by Department, Avg Time Spent by Department, and Compliance Type by Department. Identify which departments consistently meet compliance targets and which need process improvements.
📁 3 — Compliance Areas — Analyze compliance performance by regulatory domain with charts showing Tasks by Compliance Area, Compliance Rate by Area, Tasks by Compliance Type, Estimated Cost by Compliance Type, and Time Spent by Compliance Area. Understand which compliance domains consume the most resources and where compliance gaps exist.
📁 4 — Timeline Analysis — Track temporal patterns with charts showing Monthly Estimated Cost, Monthly Time Spent (hrs), Monthly Status Breakdown, Avg Days Overdue by Month, and Tasks by Responsible Person per Month. Spot seasonal patterns, workload spikes, and overdue trends across your compliance operations.
📁 5 — Data View — Searchable and sortable detailed data table with pagination and CSV export for record-level analysis of all compliance tasks and records.
⚙️ How to Use the Compliance Tracking Dashboard in HTML
1️⃣ Download and Unzip — Unzip the downloaded file and locate the index.html file.
2️⃣ Open in Browser — Open the HTML dashboard file in any modern web browser (Chrome, Firefox, Edge).
3️⃣ Replace Sample Data — Update the sample data with your own compliance task records in the data file.
4️⃣ Apply Filters — Use slicers to filter data by department, compliance area, responsible person, status, or time period.
5️⃣ Navigate Dashboard Pages — Explore all five pages to analyze compliance overview, departments, areas, timelines, and detailed records.
6️⃣ Export Data — Use the Data View page to search, sort, and export filtered compliance records to CSV.
👥 Who Can Benefit from This Compliance Tracking Dashboard in HTML
✔️ Compliance Officers — Monitor compliance rates, task completion, and non-compliant items across the organization.
✔️ Risk Managers — Track estimated costs, overdue tasks, and compliance gaps for proactive risk mitigation.
✔️ Legal and Regulatory Teams — Analyze compliance by area and type for audit readiness and regulatory reporting.
✔️ Operations Managers — Evaluate departmental compliance performance and resource allocation efficiency.
✔️ Quality Assurance Professionals — Monitor compliance type distribution and time spent analysis for continuous improvement.
Whether you manage regulatory compliance, internal audit programs, or organizational quality standards, this HTML Dashboard provides the visibility you need to ensure compliance across every department.
❓ Frequently Asked Questions
What KPIs does the Compliance Tracking Dashboard in HTML track?
The Compliance Tracking Dashboard in HTML tracks 5 key performance indicators including Total Tasks, Compliance Rate, Total Estimated Cost, Non-Compliant, and Avg Time Spent (hrs). Additional analysis across 5 interactive pages covers compliance status distribution, department-level compliance rates, compliance area breakdowns, timeline trends, and detailed data exploration with export capabilities.
Do I need any technical skills to use this HTML dashboard?
No. Simply unzip the file, open index.html in any modern web browser, and start analyzing. No coding, database, or server setup is required. Replace sample data with your own and all charts update automatically.
Can I filter the dashboard by department or compliance area?
Yes. The dashboard includes multiple interactive slicers that let you filter all pages simultaneously by Department, Compliance Area, Responsible Person, Status, and time period for instant drill-down analysis.
Is my compliance data secure with this dashboard?
Absolutely. This dashboard runs 100% client-side in your browser. No data is sent to any server, cloud, or third party. Your compliance records remain completely private on your local machine.
What is the best HTML dashboard template for compliance tracking?
The Compliance Tracking Dashboard in HTML from NextGenTemplates is one of the best options available. It includes 5 interactive pages covering overview, department analysis, compliance areas, timeline analysis, and detailed data view with search, sort, and CSV export capabilities.
🔗 Explore Related Templates
📊 IT Services Dashboard in HTML — Track IT service requests, SLA compliance, team performance, and service trends with interactive browser-based analytics.
📊 Security Dashboard in Google Sheets — Monitor security incidents, threats, compliance frameworks, and response analytics in Google Sheets.
📊 IT SLA Compliance and Ticket Monitoring Dashboard in Google Sheets — Track IT ticket SLA compliance, response times, and agent performance with interactive Google Sheets analytics.
Browse all HTML Dashboard Templates on NextGen Templates.
📖 Click here to read the Detailed Blog Post
🎥 Visit our YouTube channel to learn step-by-step video tutorials
👉 YouTube.com/@NextGenTemplates
Watch the step-by-step video tutorial:
YouTube


Reviews
There are no reviews yet.