
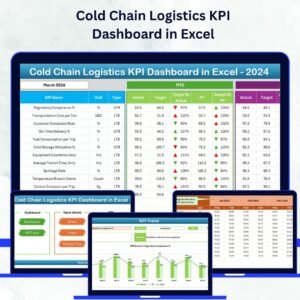
In temperature-sensitive logistics, precision and control are everything. Whether you manage pharmaceuticals, dairy, or frozen goods, the Cold Chain Logistics KPI Dashboard in Excel helps you track every critical parameter — ensuring product integrity, regulatory compliance, and operational excellence from source to destination.
This ready-to-use Excel dashboard empowers logistics professionals to analyze real-time performance, monitor KPIs, and identify improvement areas — all within a simple, intuitive interface. Built with data accuracy and usability in mind, it transforms your raw numbers into actionable insights that keep your cold chain running smoothly.Cold Chain Logistics KPI Dashboard in Excel
🧩 Key Features of Cold Chain Logistics KPI Dashboard in Excel
🌡️ Comprehensive KPI Tracking – Monitor temperature compliance, delivery timeliness, spoilage rates, and equipment performance across your entire supply chain.
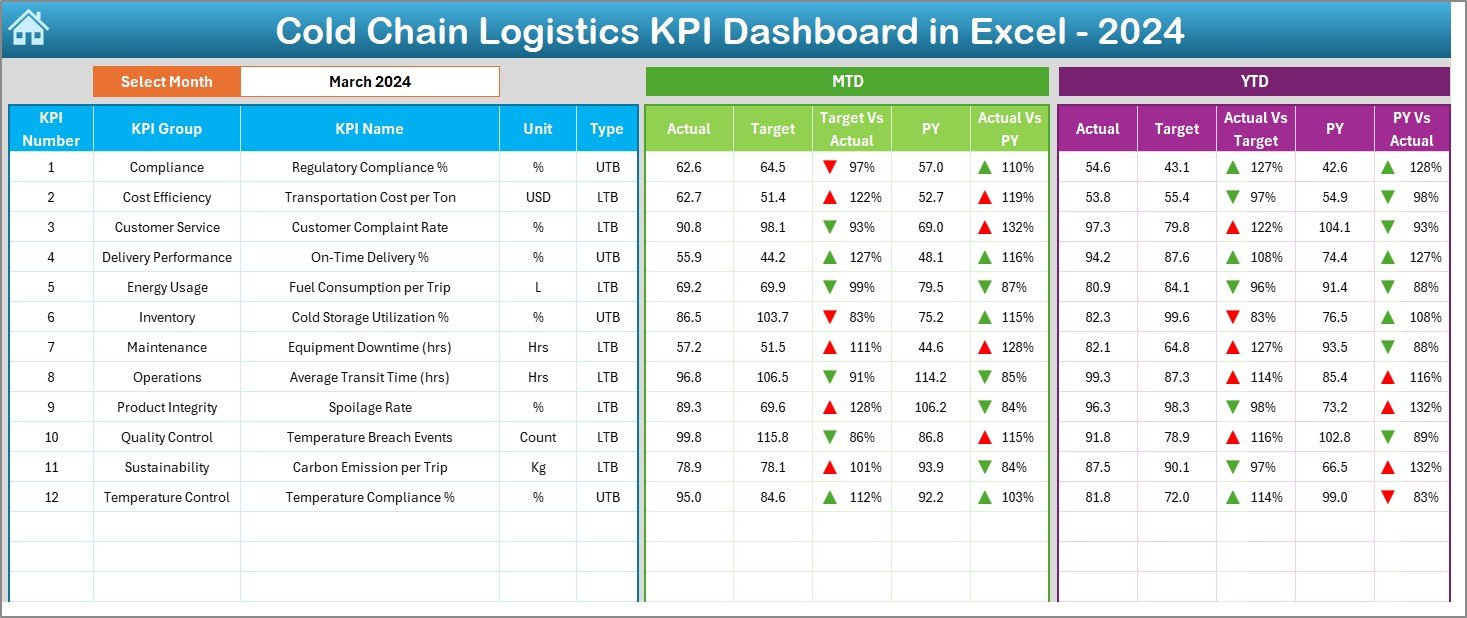
📊 Interactive Dashboard – Select a month and instantly view MTD vs YTD performance with automatic updates and color-coded visuals for clarity.
🧭 One-Click Navigation – Jump between worksheets (Dashboard, Trend, Targets, etc.) using interactive buttons on the Home sheet — no manual scrolling needed.Cold Chain Logistics KPI Dashboard in Excel
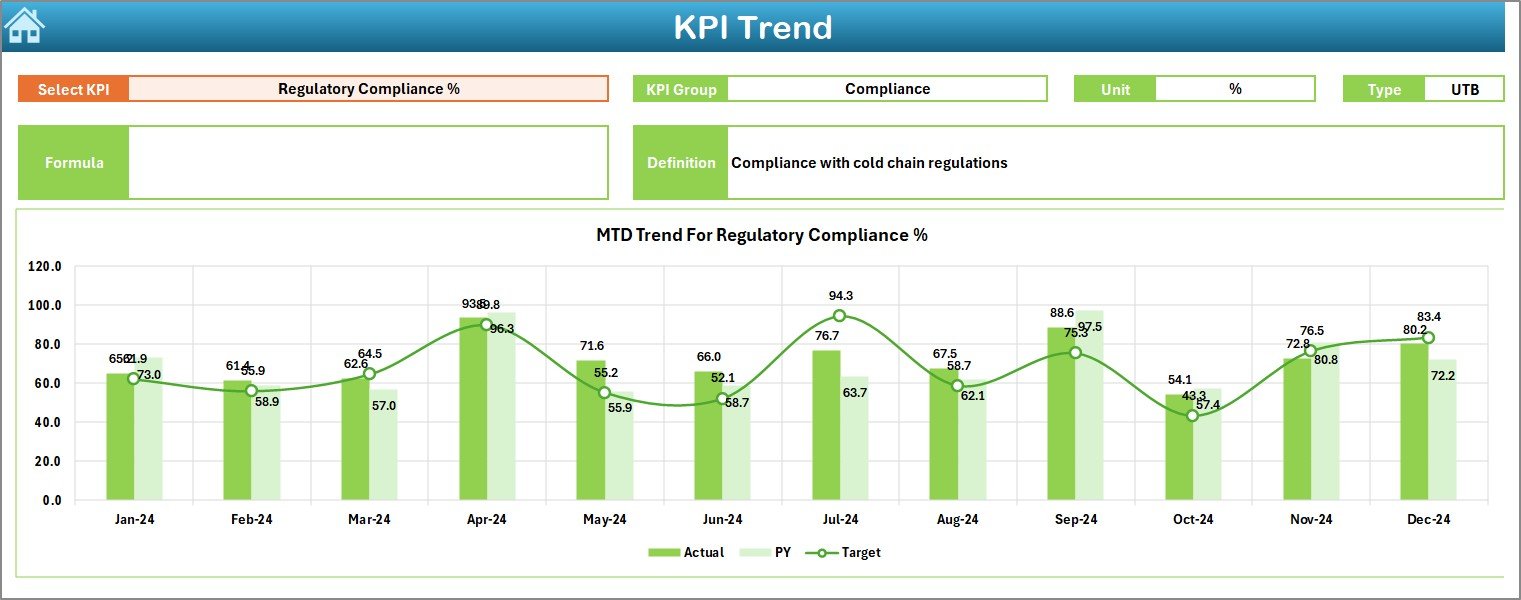
📈 Dynamic Trend Analysis – Identify seasonal trends, long-term patterns, and improvement areas through easy-to-read Actual vs Target vs Previous Year trend charts.
💡 Customizable Framework – Add new KPIs, modify formulas, and integrate data sources without advanced Excel skills.
🧾 Data Consistency & Accuracy – Designed with structured inputs and validation-ready layouts to minimize errors and ensure accurate reporting.
💻 100% Excel-Based – No software installation required. Fully compatible with Excel 2016 and later versions.
📂 What’s Inside the Cold Chain Logistics KPI Dashboard in Excel
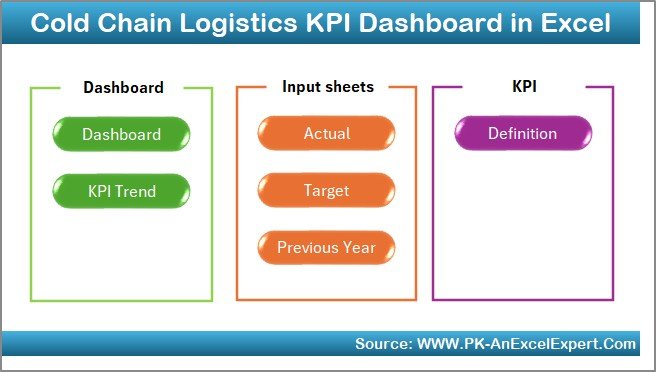
This professional-grade dashboard includes seven interactive worksheet tabs, each designed for specific functions:
1️⃣ Home Sheet: Acts as your main control hub with interactive buttons for instant navigation.
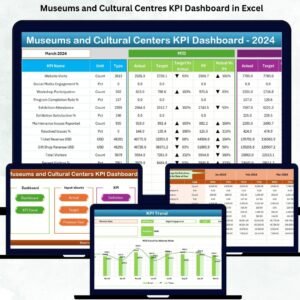
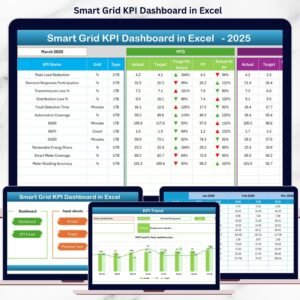
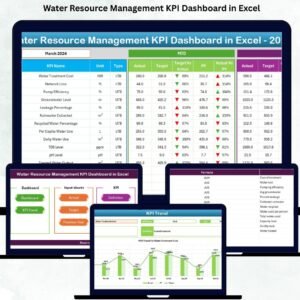
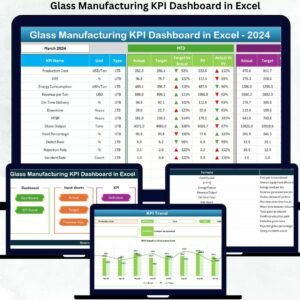
2️⃣ Dashboard Sheet: Displays MTD and YTD KPI performance, visual cards, and conditional formatting arrows to indicate performance health.
3️⃣ KPI Trend Sheet: Provides dynamic visuals for each KPI with definitions, formulas, and historical comparisons.
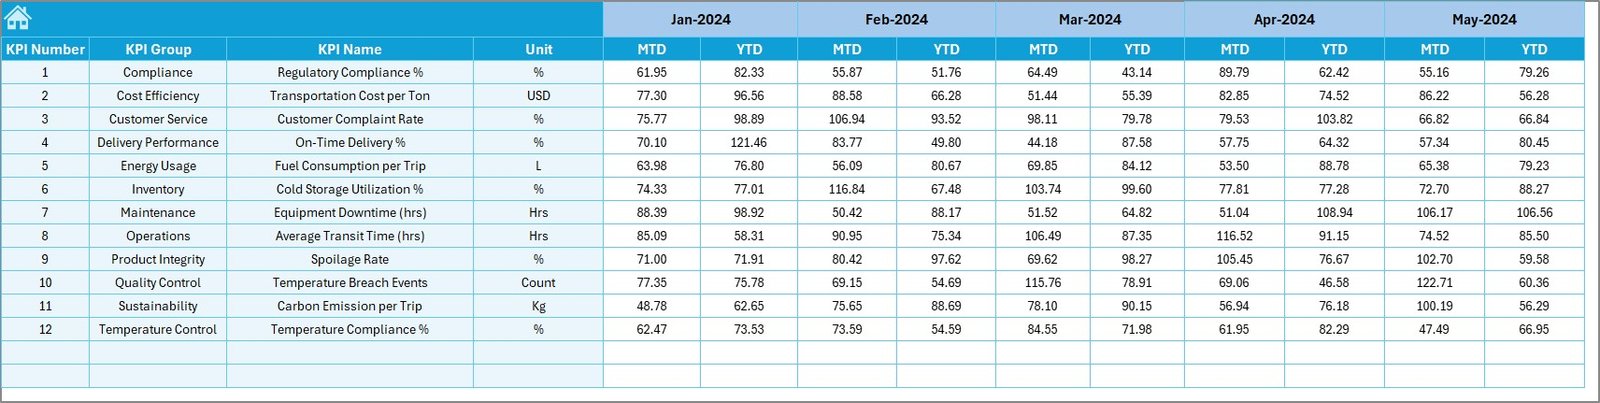
4️⃣ Actual Numbers Input Sheet: The area for entering monthly operational data.
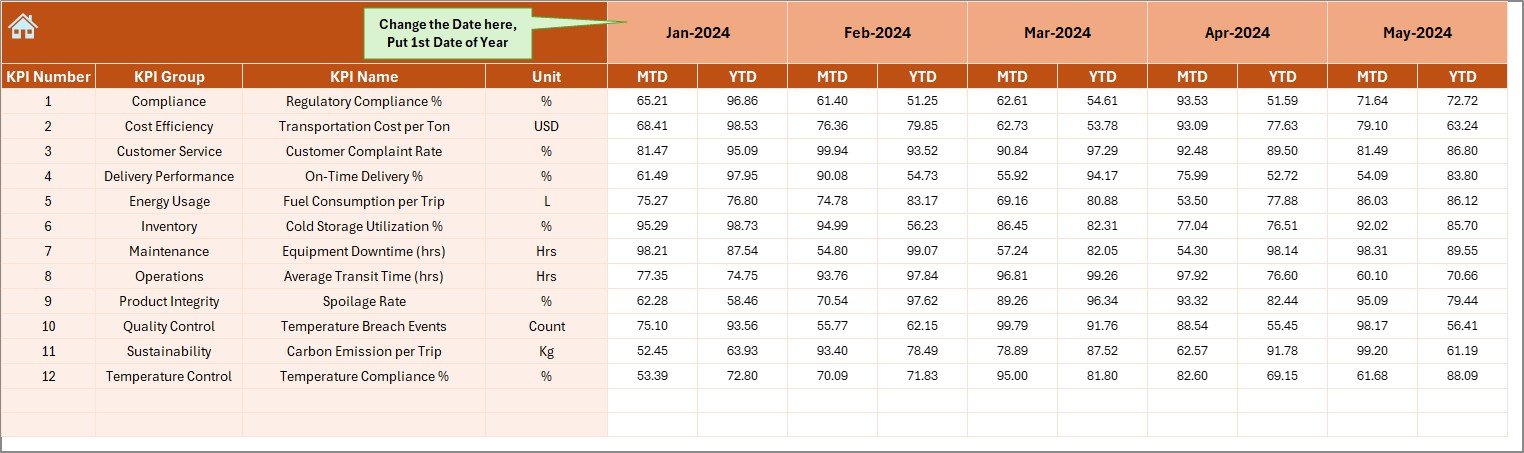
5️⃣ Target Sheet: Helps set clear MTD and YTD benchmarks for accountability.
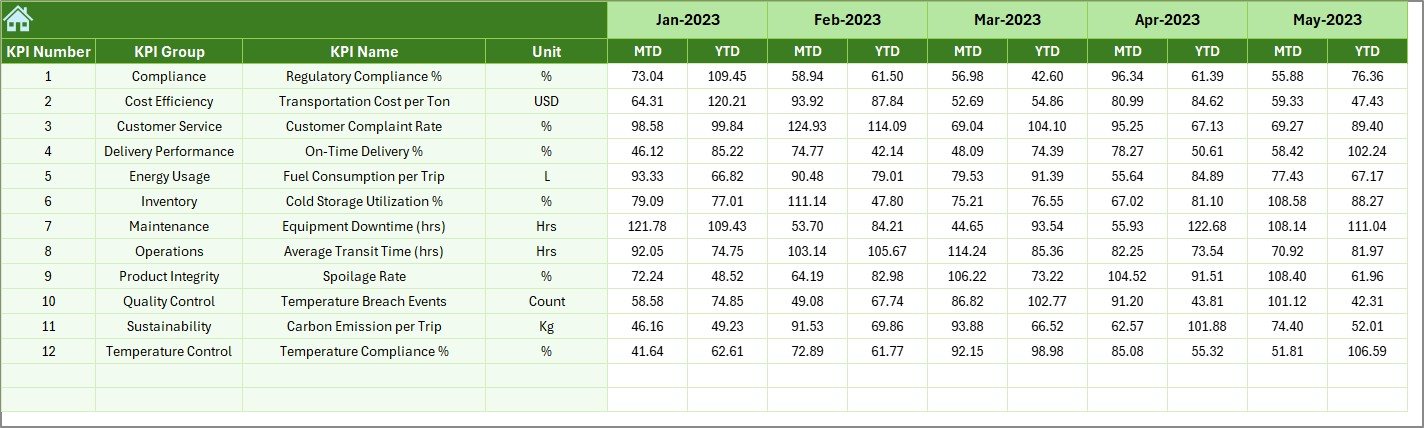
6️⃣ Previous Year Sheet: Stores historical metrics for YoY analysis and trend identification.
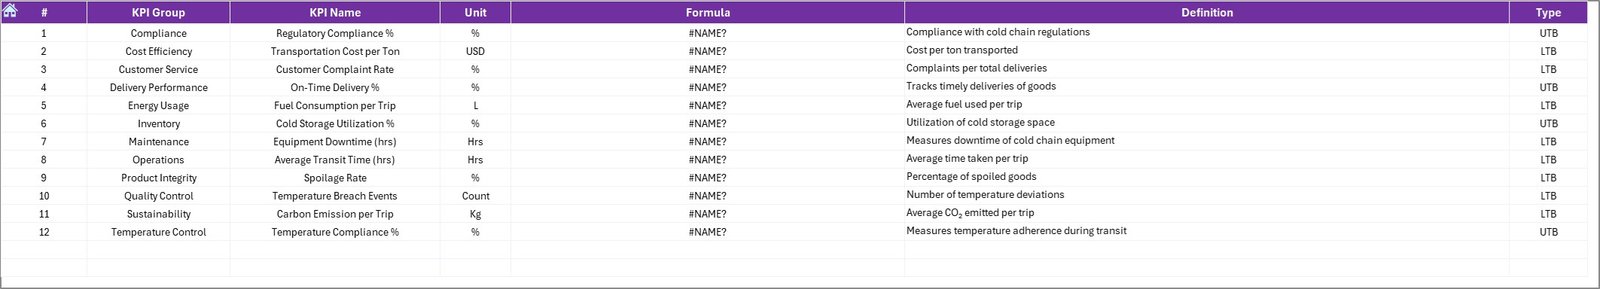
7️⃣ KPI Definition Sheet: A centralized database for all KPIs — complete with group, unit, type, and formula details.
Every tab is interconnected, ensuring seamless data flow and zero redundancy.
⚙️ How to Use the Cold Chain Logistics KPI Dashboard in Excel
🧩 Step 1: Open the file and review KPI definitions in the KPI Definition sheet.
📆 Step 2: Update MTD and YTD targets in the Target sheet.
🧾 Step 3: Enter current month actuals in the Actual Numbers Input sheet.
📅 Step 4: Add previous year values for comparison in the Previous Year sheet.
📊 Step 5: Go to the Dashboard tab, choose your month, and watch all visuals update automatically.
📈 Step 6: Use the KPI Trend sheet to track month-over-month progress and identify focus areas.
💡 Pro Tip: Combine this dashboard with Power Query or Power BI for deeper automation and real-time reporting.
👥 Who Can Benefit from This Cold Chain Logistics KPI Dashboard in Excel
🚛 Logistics Managers: To monitor fleet performance, route efficiency, and delivery timelines.
🧊 Quality Assurance Teams: To track temperature compliance, spoilage, and product safety.
🏭 Warehouse Supervisors: To manage storage conditions, uptime, and maintenance.
💰 Finance Teams: To evaluate cost efficiency and variance between targets and actuals.
📈 Operations Analysts: To generate performance reports and visualize long-term trends.
This dashboard is perfect for supply chain companies, food distributors, pharmaceutical transporters, and any organization where temperature integrity equals trust.
🎯 Why Choose This Dashboard?
-
Ensures performance transparency across the supply chain.
-
Delivers real-time decision support with Excel-powered analytics.
-
Offers cost-effective performance tracking — no coding or external software needed.
-
Provides scalability and flexibility, allowing easy customization for your business model.


Reviews
There are no reviews yet.