

Managing a coding bootcamp is not easy. You need to track student performance, monitor KPIs, and ensure targets are met every month. However, when data is scattered across multiple sheets, it becomes difficult to analyze performance and make quick decisions.
Coding Bootcamps KPI Dashboard in Excel comes in.
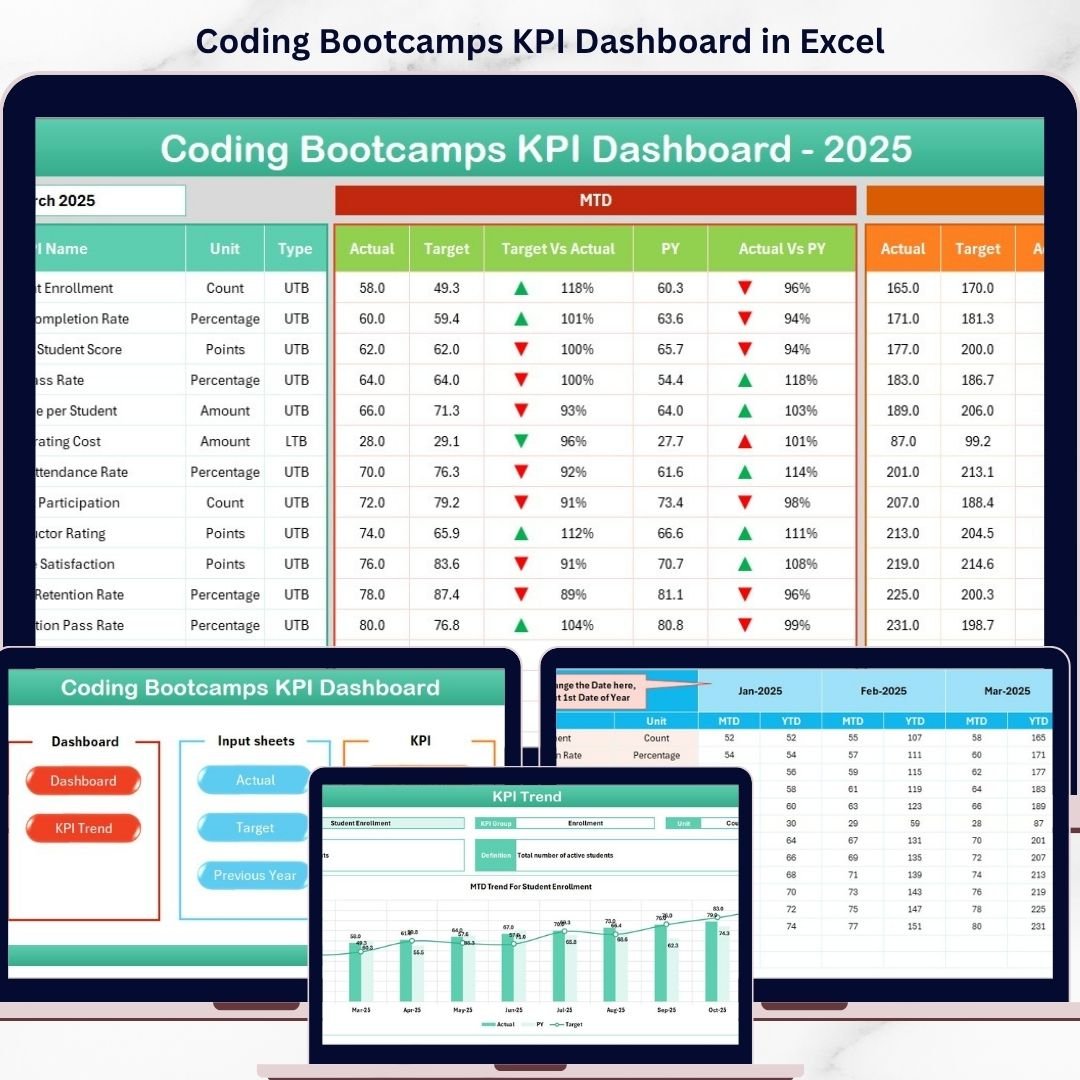
This powerful and ready-to-use Excel dashboard helps you track, analyze, and improve your bootcamp’s performance with ease. Instead of spending hours on manual reporting, you can now visualize all your KPIs in one place and make data-driven decisions instantly.
Designed with a structured layout and interactive features, this dashboard simplifies complex data into clear insights. Whether you want to monitor Monthly (MTD) or Yearly (YTD) performance, compare targets, or analyze trends — everything is just a click away.

🚀 Key Features of Coding Bootcamps KPI Dashboard in Excel
📊 Interactive KPI Dashboard – View all key metrics in a centralized dashboard with dynamic month selection.
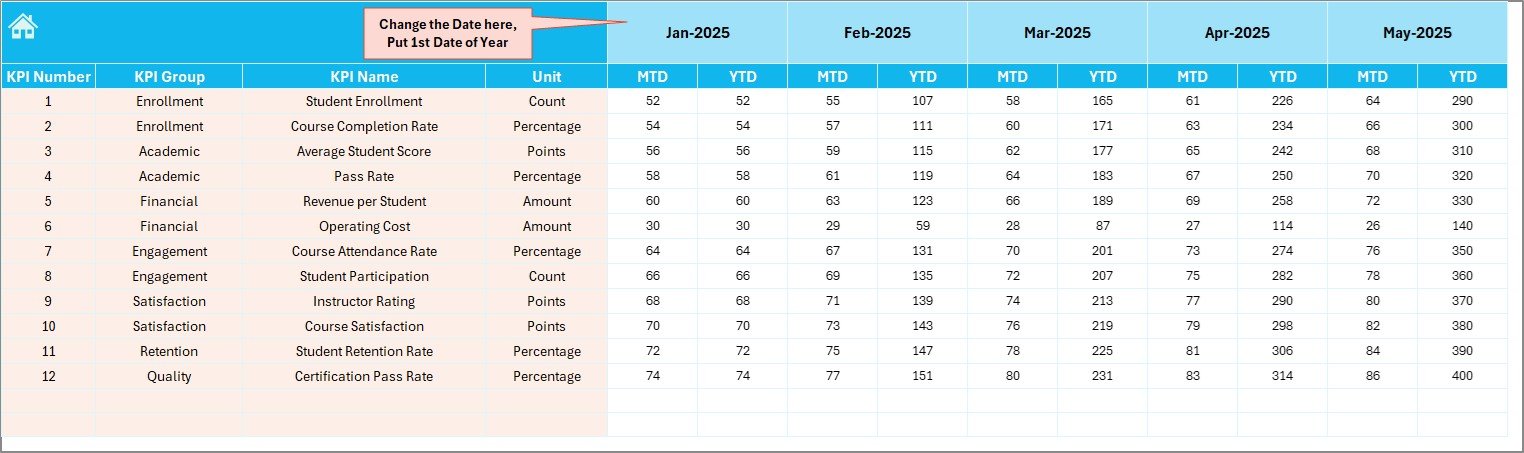
📅 MTD & YTD Tracking – Compare Actual, Target, and Previous Year data for better performance evaluation.
📈 Trend Analysis Charts – Visualize KPI performance over time using intuitive charts.
🔺 Conditional Formatting Indicators – Instantly identify performance gaps using up/down arrows.
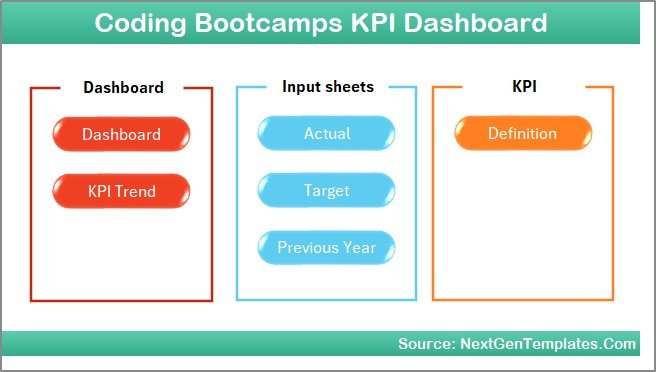
📂 7 Structured Worksheets – Organized sheets for seamless data input and analysis.
🎯 KPI Selection Dropdowns – Analyze specific KPIs with interactive dropdown filters.
📘 Detailed KPI Definitions – Understand each KPI with unit, formula, and type (LTB/UTB).
⚡ User-Friendly Navigation – Easily switch between sheets using the Home page buttons.
📂 What’s Inside the Coding Bootcamps KPI Dashboard in Excel
This Excel dashboard includes 7 well-structured worksheets to ensure smooth KPI tracking:
📌 Home Sheet
Acts as a navigation hub with clickable buttons to access all sections quickly.
📌 Dashboard Sheet
Displays all KPIs with MTD and YTD Actual, Target, and Previous Year comparisons along with trend indicators.
📌 KPI Trend Sheet
Analyze individual KPIs with details like KPI group, unit, type, formula, and trend charts.
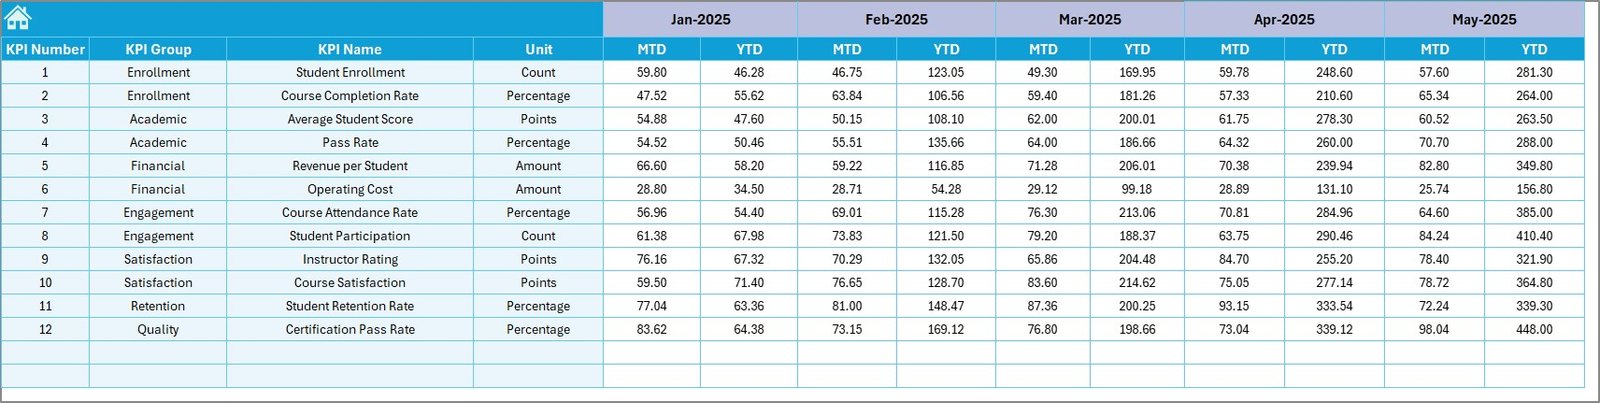
📌 Actual Numbers Input Sheet
Enter actual KPI values for monthly and yearly tracking.
📌 Target Numbers Input Sheet
Set KPI targets and monitor goal achievement.
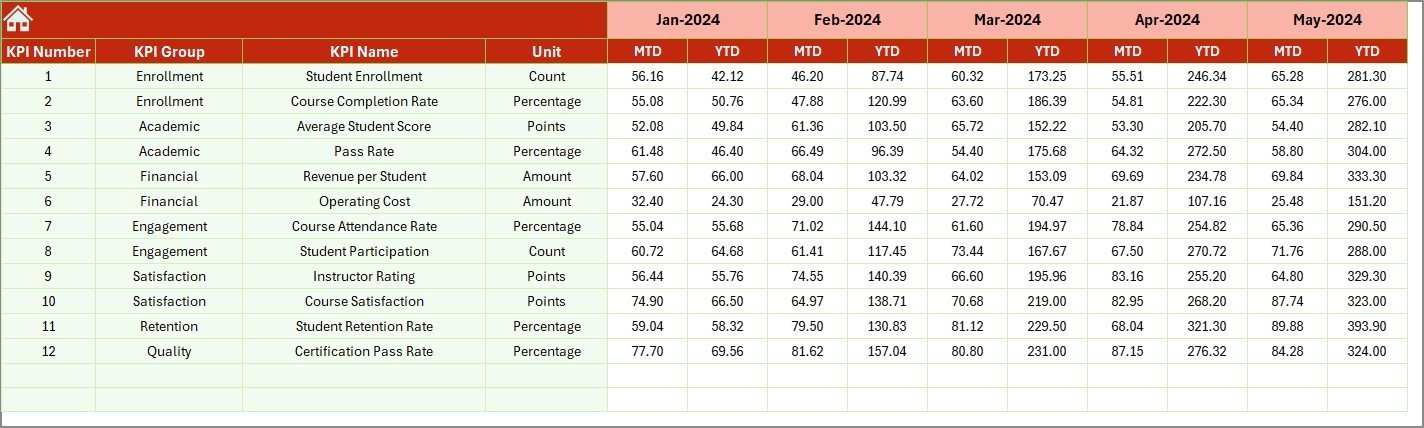
📌 Previous Year Data Sheet
Compare current performance with last year’s data for better insights.
📌 KPI Definition Sheet
Maintain complete KPI details including formulas, definitions, and types.
🛠️ How to Use the Coding Bootcamps KPI Dashboard in Excel
Using this dashboard is simple and beginner-friendly:
1️⃣ Enter KPI data in Actual, Target, and Previous Year sheets
2️⃣ Update the starting month if needed
3️⃣ Select the desired month from the Dashboard
4️⃣ Analyze MTD and YTD performance instantly
5️⃣ Use the KPI Trend sheet for detailed KPI insights
6️⃣ Monitor trends and identify performance gaps
7️⃣ Take data-driven actions to improve results
Within minutes, you can turn raw data into powerful insights.
👥 Who Can Benefit from This Coding Bootcamps KPI Dashboard in Excel
This dashboard is ideal for:
👨🏫 Coding Bootcamp Owners managing operations and performance
📊 Data Analysts tracking KPI trends and insights
👨💼 Managers monitoring targets and outcomes
📈 Training Coordinators analyzing student and program performance
💼 Consultants optimizing bootcamp efficiency
Whether you run a small bootcamp or a large training institute, this dashboard helps you stay organized and focused on growth.
With this dashboard, you no longer need to rely on complex spreadsheets or manual calculations. Everything is automated, structured, and easy to understand. As a result, you save time, reduce errors, and make smarter decisions.
So, if you want to track KPIs effectively, improve performance, and manage your coding bootcamp like a pro, this dashboard is the perfect solution.