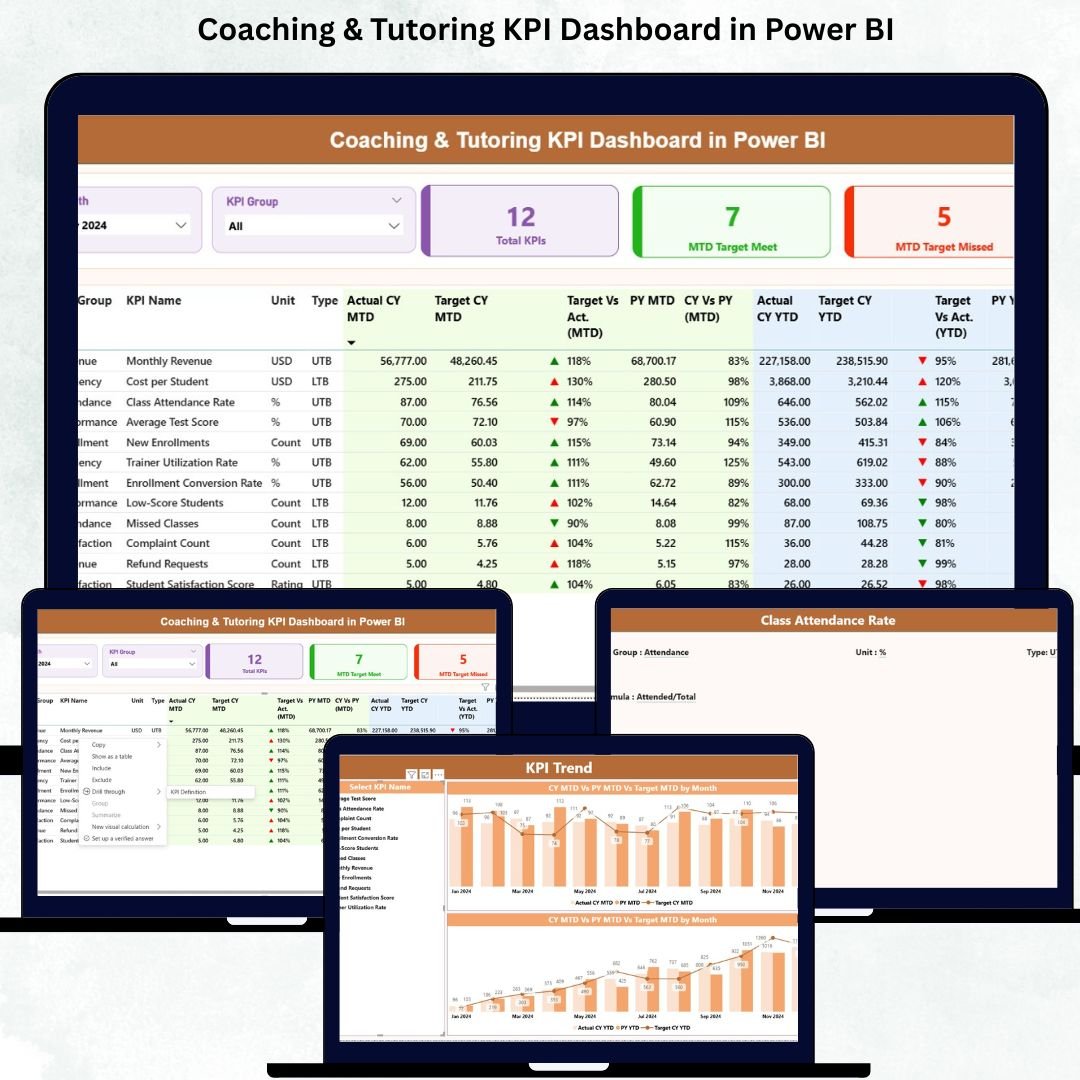
Managing a coaching or tutoring institution is challenging when data stays scattered across spreadsheets, slow reports, or manual trackers. Academic leaders want faster insights about student performance, enrollment trends, attendance behavior, subject-wise outcomes, instructor efficiency, and financial growth. This is exactly where the Coaching & Tutoring KPI Dashboard in Power BI becomes your most powerful performance-management tool.
Designed for coaching owners, administrators, teachers, coordinators, and academic directors, this dashboard gives you real-time clarity, instant insights, and complete control over every KPI that matters. With interactive visuals, slicers, drill-through pages, and dynamic trend charts, your entire institution can track performance with confidence and accuracy. 🚀📚
Built using Power BI and fed through a simple Excel sheet, this dashboard requires no technical skills, making it the perfect solution for institutes of all sizes—online, offline, hybrid, or multi-branch.
Key Features of Coaching & Tutoring KPI Dashboard in Power BI 📌
This ready-to-use dashboard is thoughtfully designed with three powerful pages that simplify every performance review process:
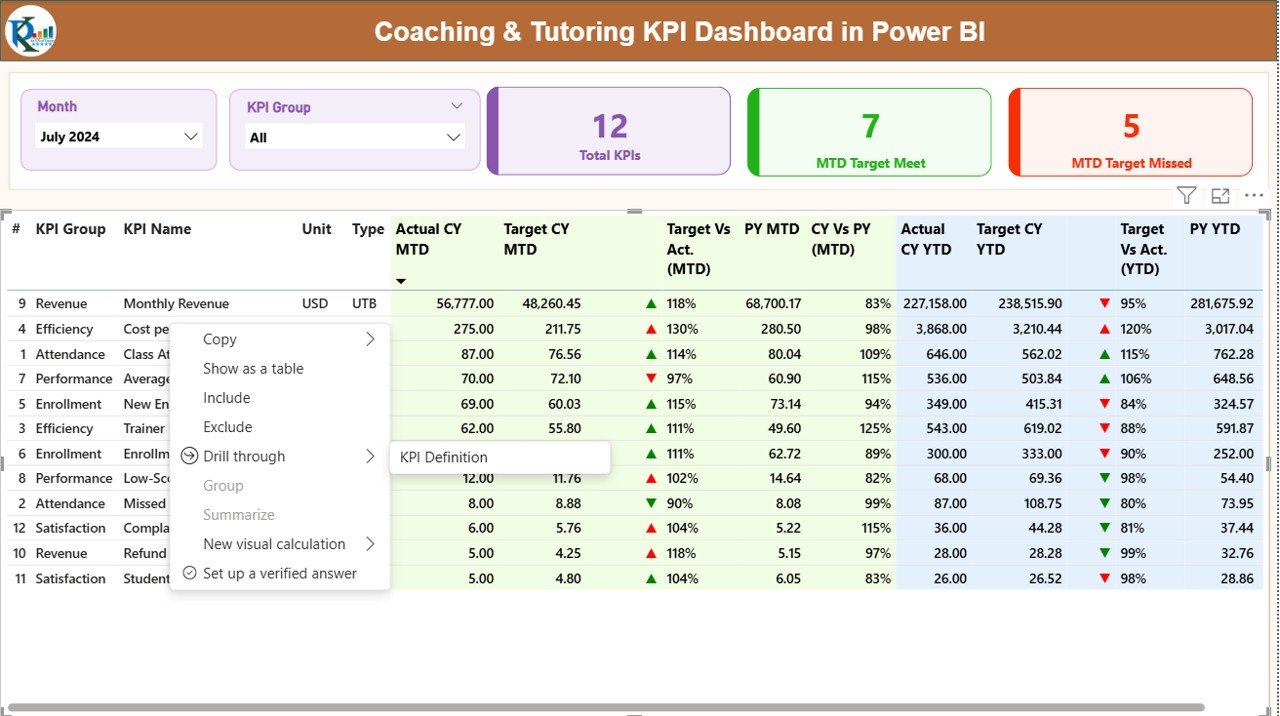
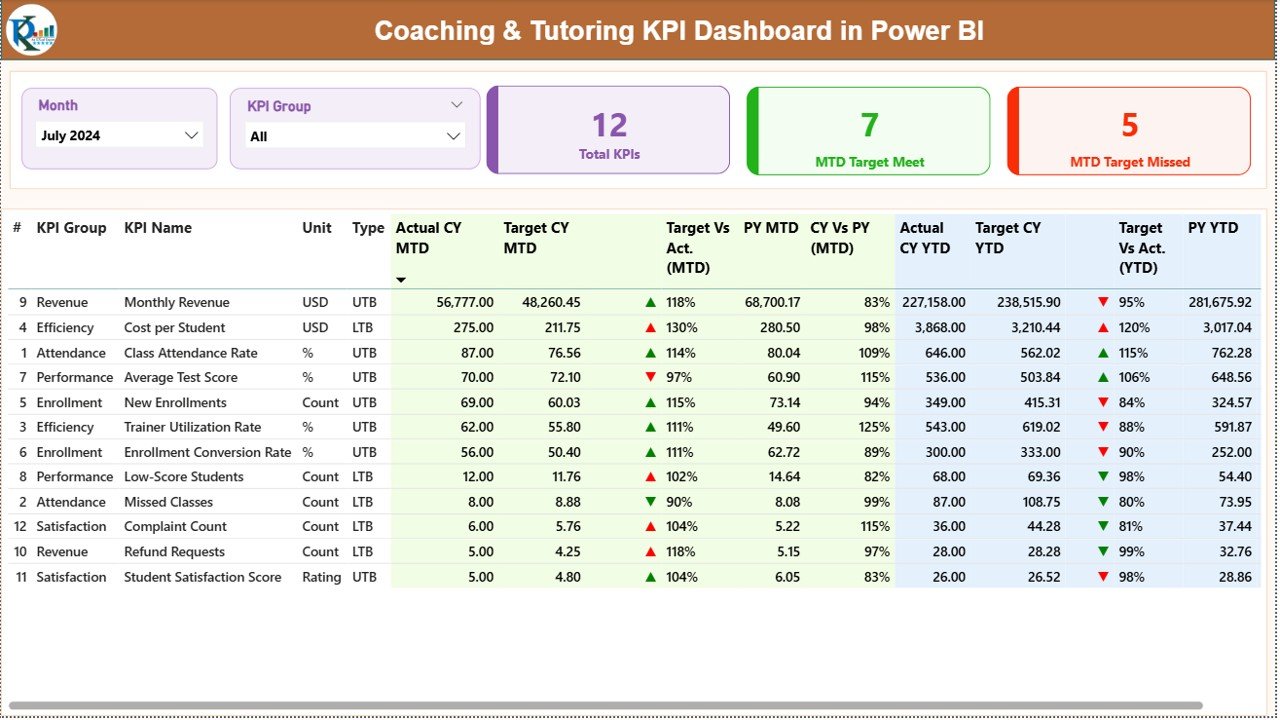
🔹 Summary Page – Your Complete Performance Snapshot
The main dashboard page includes month slicers, KPI group filters, and cards showing:
-
Total KPIs
-
MTD Target Met
-
MTD Target Missed
It also displays a detailed KPI table containing actuals, targets, PY values, percentages, and up/down arrows for quick interpretation.
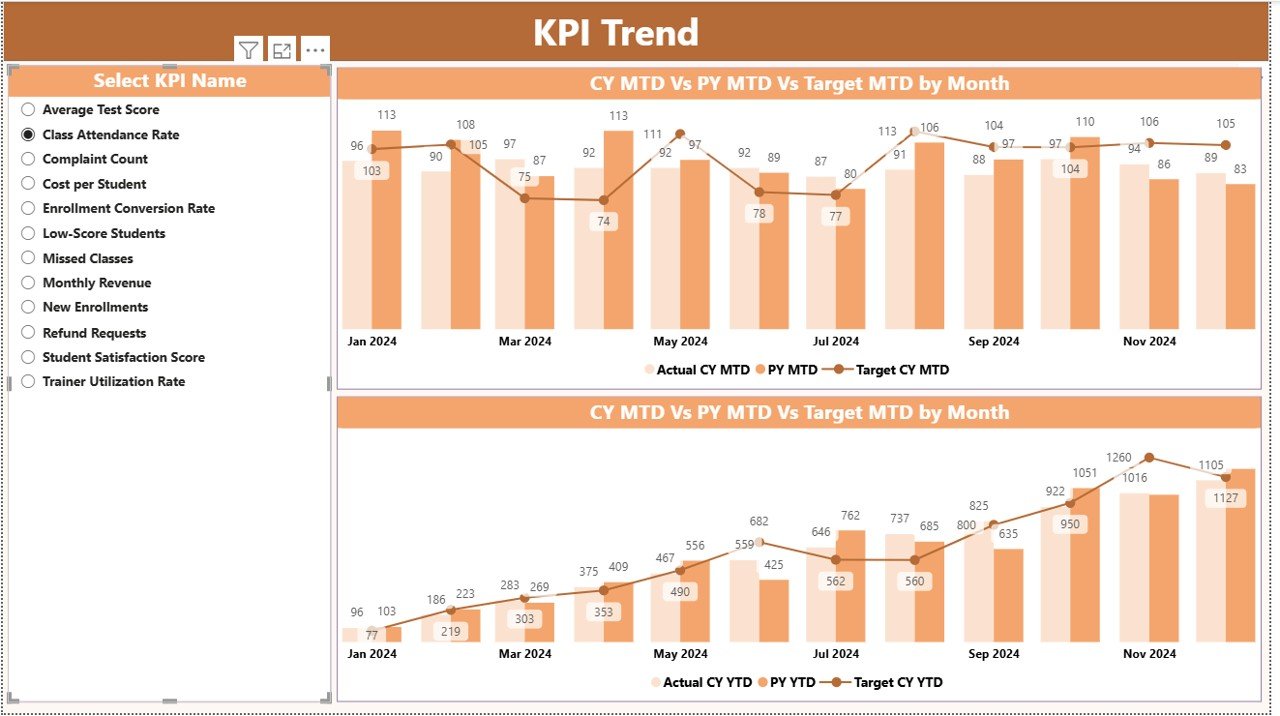
🔹 KPI Trend Page – Understand Progress Over Time
Spot trends, fluctuations, and seasonal patterns with combo charts showing:
-
MTD Actual vs Target vs Previous Year
-
YTD Actual vs Target vs Previous Year
Perfect for academic heads who want long-term clarity.
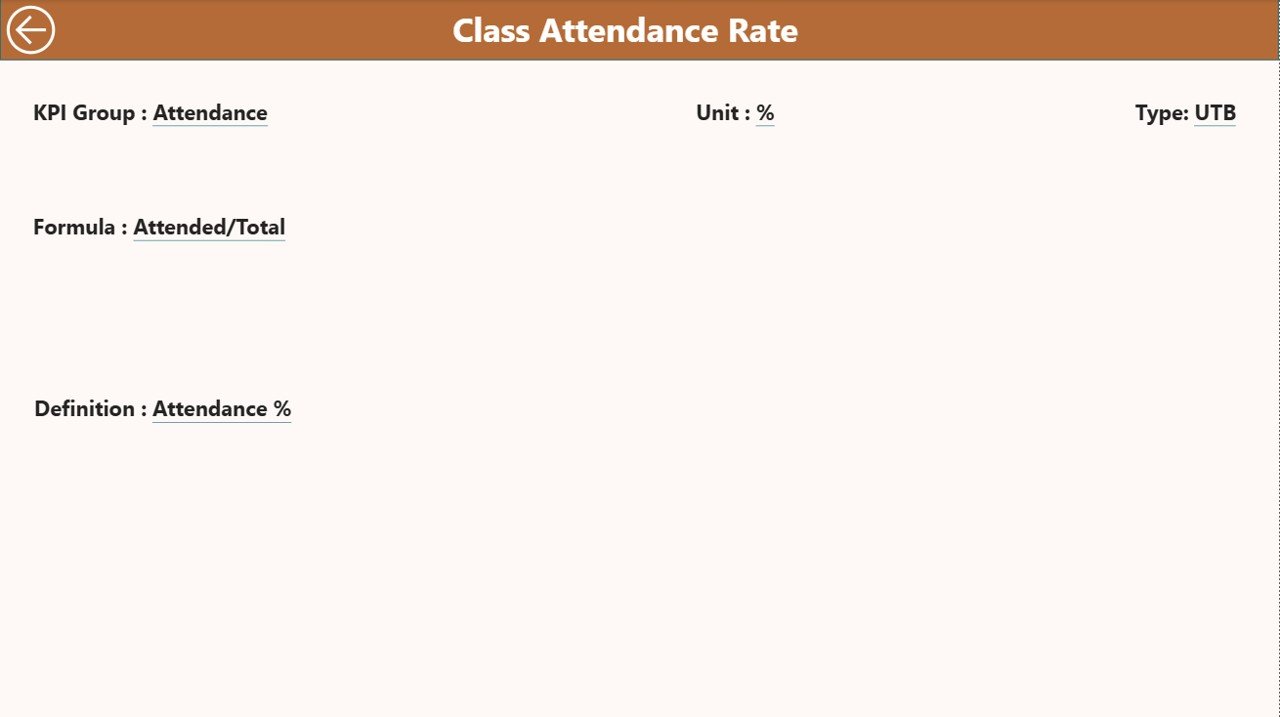
🔹 KPI Definition Page – One Click Understanding
A drill-through page that reveals:
-
KPI Name
-
Unit
-
Type (UTB/LTB)
-
Formula
-
Definition
This ensures every team member interprets KPIs correctly.
What’s Inside the Coaching & Tutoring KPI Dashboard in Power BI 📂✨
When you download this digital product, you receive:
✅ Power BI Dashboard File (.pbix)
Interactive visuals, slicers, cards, drill-throughs, conditional icons, and multi-page reporting.
✅ Excel Input File
Includes 3 sheets:
-
Input_Actual – Fill MTD/YTD values
-
Input_Target – Add monthly targets
-
KPI Definition – Add KPI descriptions, formulas & types
✅ Complete KPI Framework
Student Performance, Operations, Attendance, Growth, and Finance—all covered.
✅ Trend and Comparison Analytics
Track month-to-month and year-to-year progress with clarity.
How to Use the Coaching & Tutoring KPI Dashboard in Power BI 🎓📈
Using the dashboard is extremely simple:
1️⃣ Update the Excel File
Add actuals, targets, and KPI definitions every month.
2️⃣ Refresh Power BI
Instantly view updated visuals, charts, and performance scores.
3️⃣ Use Slicers to Analyze Deep Insights
Filter by month or KPI group to uncover hidden trends.
4️⃣ Review Trends Like a Pro
Compare current results with previous year values to understand growth momentum.
5️⃣ Use in Monthly Review Meetings
Present clean visual insights to management, faculty, or strategy teams.
6️⃣ Train Your Team
Help instructors interpret KPIs for continuous improvement.
Who Can Benefit from This Coaching & Tutoring KPI Dashboard? 👇
🎯 Coaching Owners
Monitor enrollment, revenue, student success, and operational efficiency.
🎯 Academic Heads & Principals
Track subject-wise performance and identify areas needing improvement.
🎯 Teachers & Instructors
Understand student progress and upcoming challenges.
🎯 Coordinators & Admin Teams
Improve daily operations, attendance tracking, and documentation.
🎯 Education Startups & EdTech Teams
Use insight-driven visuals to improve service quality and decision-making.
This dashboard turns your entire coaching center into a data-driven institution, ensuring better results and stronger growth.
### Click here to read the Detailed blog post
Watch the step-by-step video tutorial:


Reviews
There are no reviews yet.