Cloud hosting is competitive. Customers expect 99.9% uptime, lightning-fast response times, airtight security, and transparent pricing. But if your performance data sits in scattered spreadsheets, how can you scale confidently?
Instead of wasting hours compiling reports, imagine reviewing uptime, cost efficiency, SLA compliance, and revenue growth in one centralized dashboard.
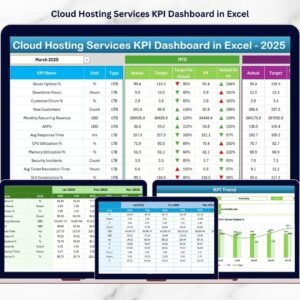
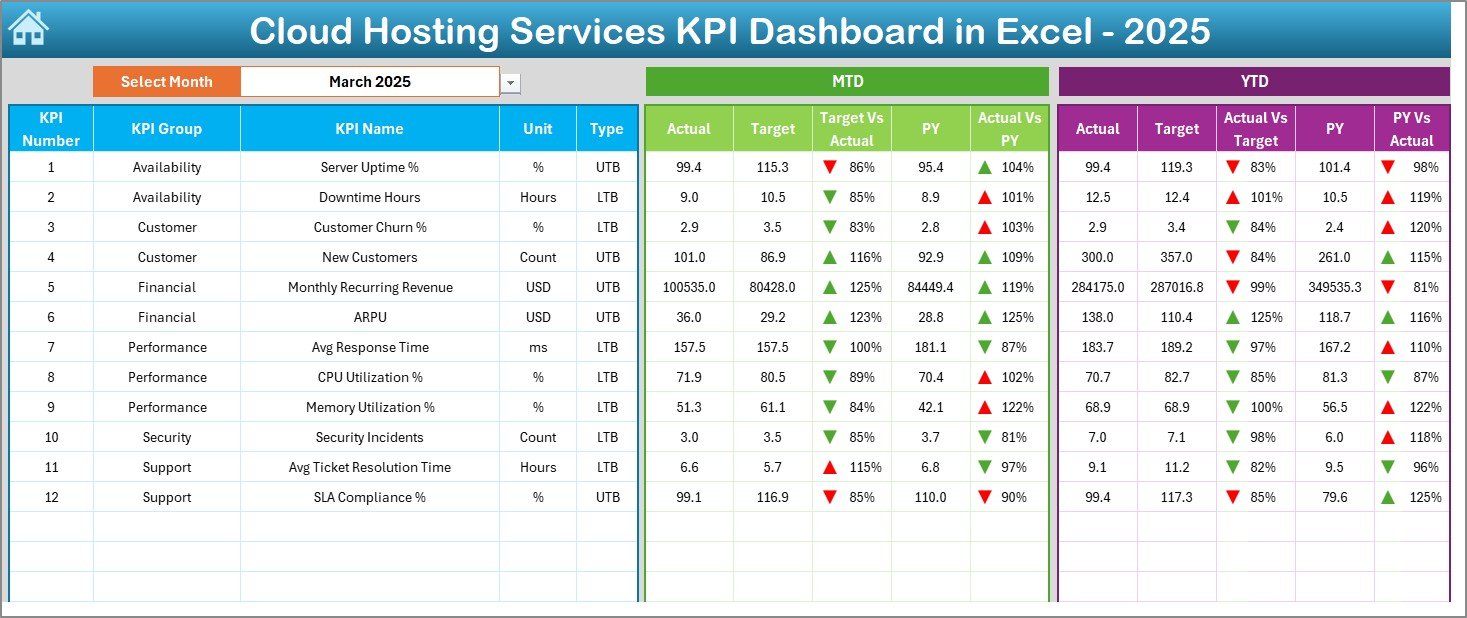
Cloud Hosting Services KPI Dashboard in Excel That’s exactly what the Cloud Hosting Services KPI Dashboard in Excel delivers.
Cloud Hosting Services KPI Dashboard in Excel This ready-to-use Excel template transforms raw operational data into structured visuals, automated comparisons, and powerful performance insights. Track MTD (Month-To-Date) and YTD (Year-To-Date) results, compare Actual vs Target, and analyze previous year trends — all in one professional workbook.
📊 Key Feature of Cloud Hosting Services KPI Dashboard in Excel
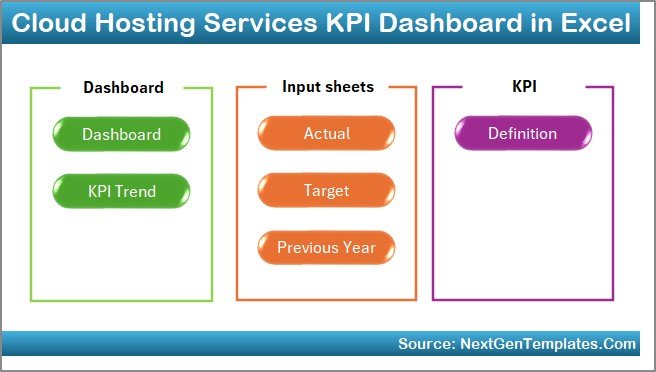
This dashboard includes 7 structured worksheets designed for complete performance tracking.
🏠 Home Sheet – Easy Navigation Hub
✔ 6 quick-access buttons
✔ Smooth navigation across sheets
✔ Professional layout
Move instantly between Dashboard, KPI Trend, Input, Target, PY, and Definition sheets.
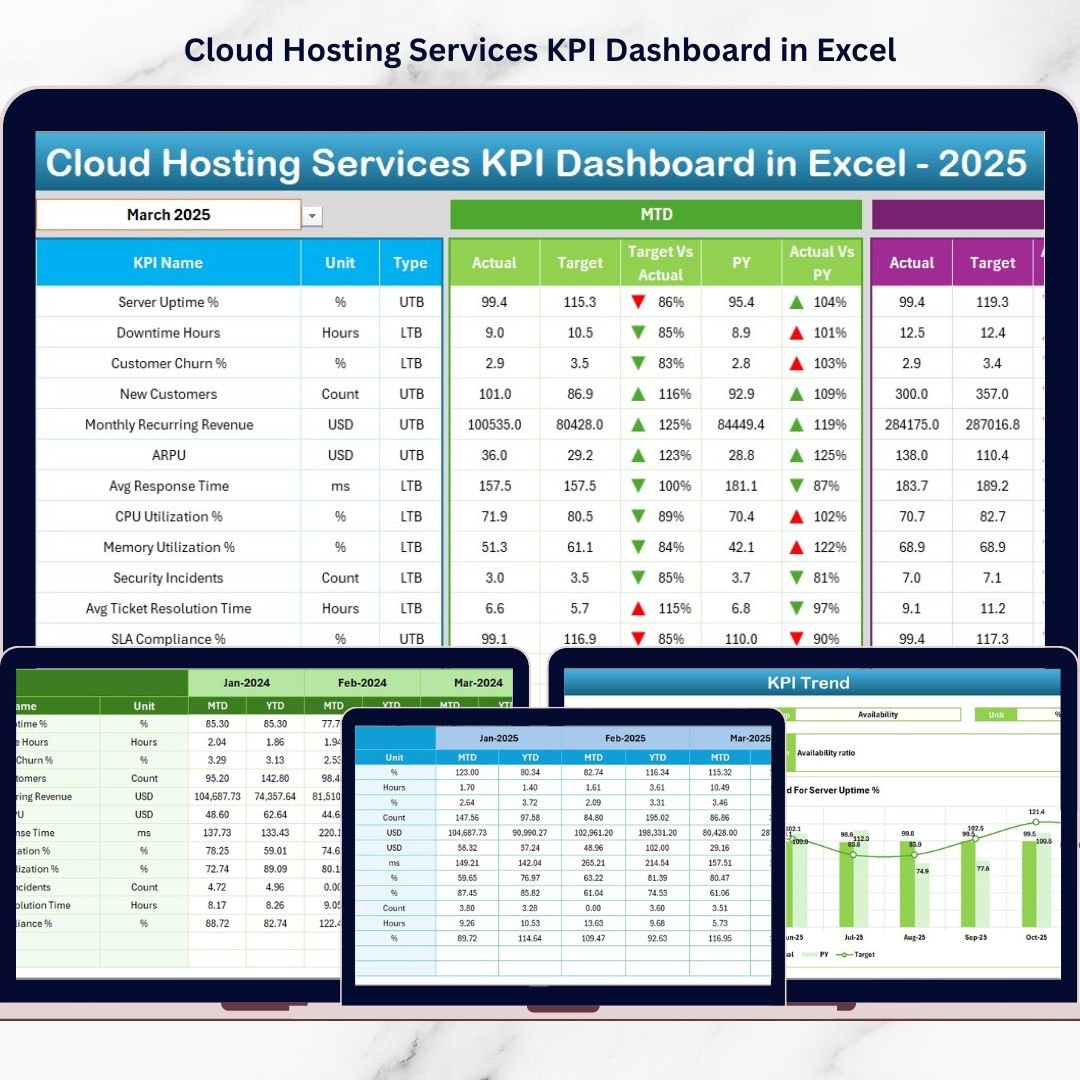
📈 Dashboard Sheet – Main Performance View
✔ Select month in cell D3
✔ MTD & YTD Actual vs Target comparison
✔ Previous Year comparison
✔ Green ▲ and Red ▼ indicators
✔ Instant performance visibility
You immediately see which KPIs exceed expectations and which require attention.
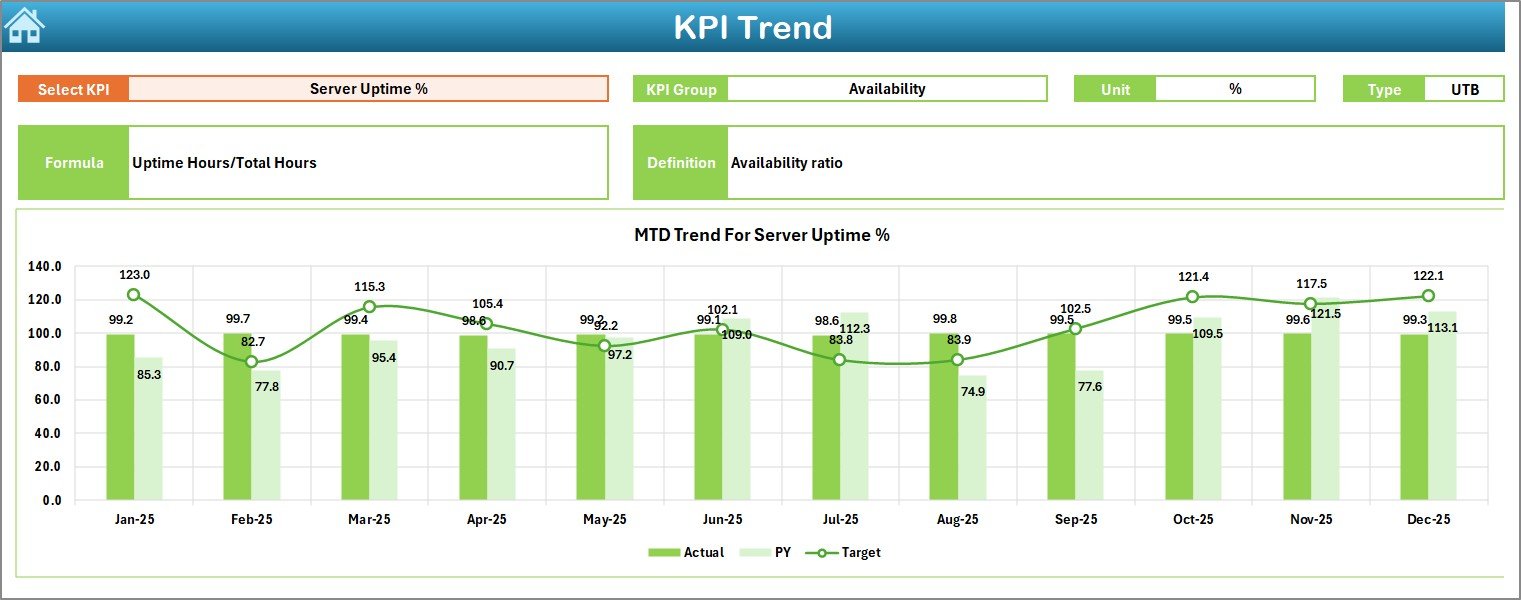
📉 KPI Trend Sheet – Deep Performance Analysis
✔ Select KPI from dropdown (Cell C3)
✔ View KPI Group, Unit, Type (LTB / UTB)
✔ See Formula & Definition
✔ MTD Trend Chart (Actual vs Target vs PY)
✔ YTD Trend Chart (Actual vs Target vs PY)
Understand trends over time — not just numbers.
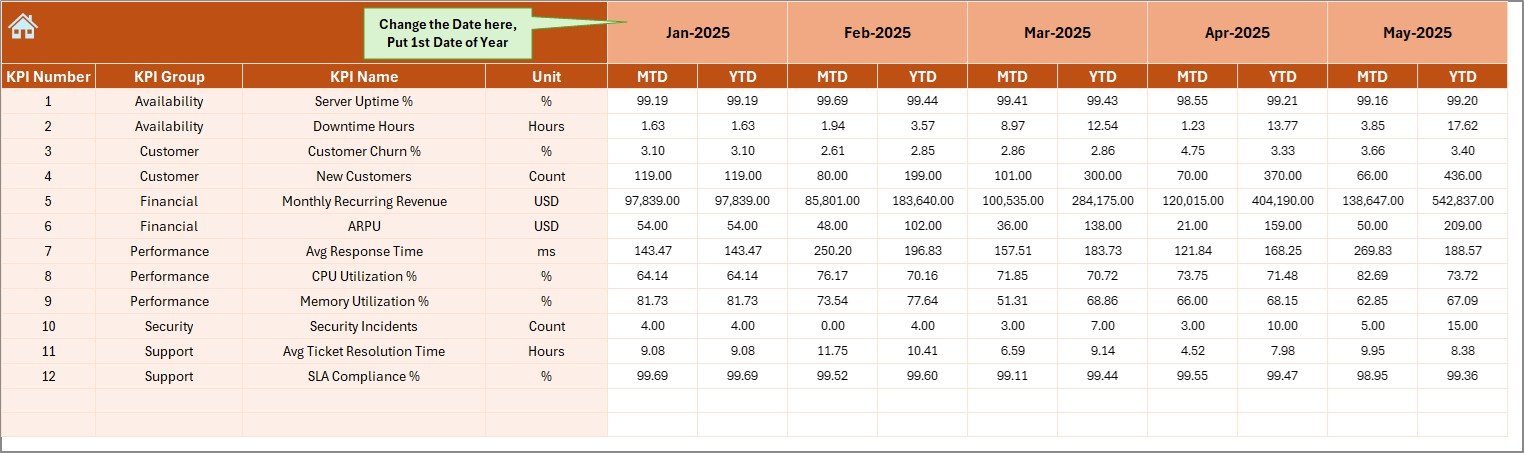
📝 Actual Numbers Input Sheet
✔ Enter MTD Actual values
✔ Enter YTD Actual values
✔ Change first month in cell E1
✔ Automatic dashboard updates
No manual calculations required.
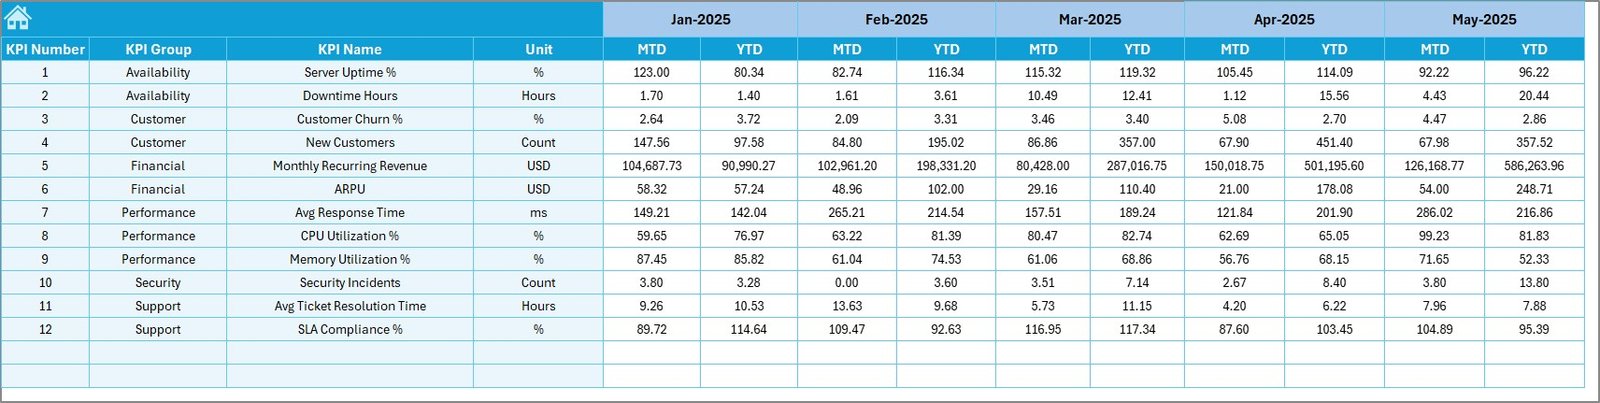
🎯 Target Sheet
✔ Define monthly MTD targets
✔ Define YTD targets
✔ Create measurable benchmarks
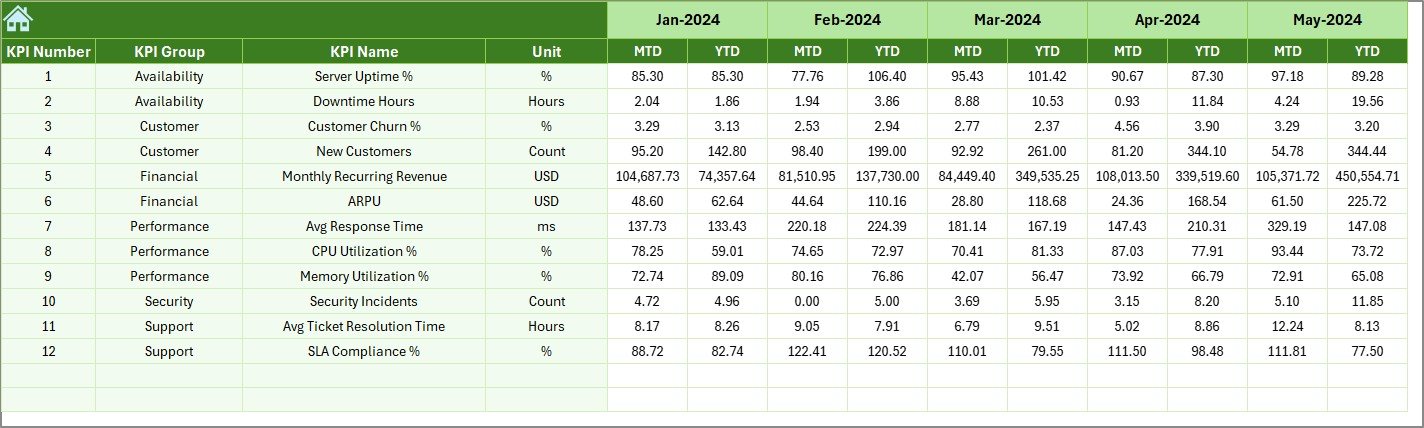
📅 Previous Year Number Sheet
✔ Enter PY MTD & YTD data
✔ Analyze growth & year-over-year performance
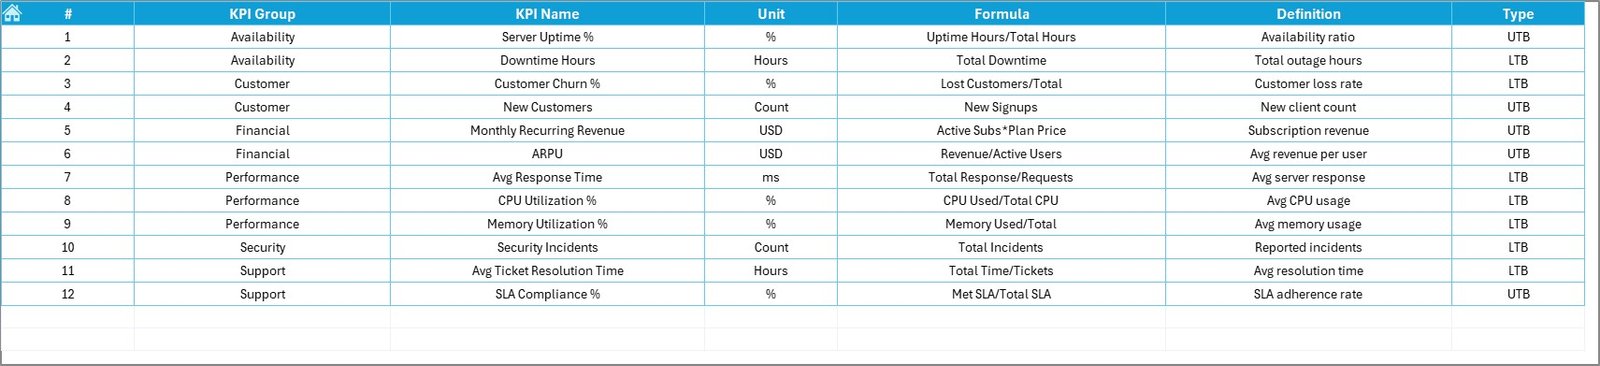
📘 KPI Definition Sheet
✔ KPI Name
✔ KPI Group
✔ Unit
✔ Formula
✔ Clear Definition
Maintain transparency and consistent measurement logic.
📦 What’s Inside the Cloud Hosting Services KPI Dashboard in Excel
When you download this template, you receive:
✔ Fully automated Excel dashboard
✔ 7 structured worksheets
✔ Conditional formatting arrows
✔ Built-in trend charts
✔ Customizable KPI framework
✔ Editable targets and formulas
✔ Professional reporting layout
This is not just a spreadsheet — it’s your centralized cloud performance control system.
🛠 How to Use the Cloud Hosting Services KPI Dashboard in Excel
Using this template is simple:
1️⃣ Define your KPIs in the KPI Definition sheet
2️⃣ Enter monthly Actual values in the Input sheet
3️⃣ Set Targets in the Target sheet
4️⃣ Add Previous Year data
5️⃣ Select Month in Dashboard sheet
The dashboard updates automatically and displays performance instantly.
👥 Who Can Benefit from This Cloud Hosting Services KPI Dashboard?
This template is ideal for:
☁ Cloud Hosting Providers
💻 SaaS Companies
🖥 IT Infrastructure Teams
📡 Data Center Operators
📊 Operations Managers
💰 Finance & Strategy Teams
🚀 Growing Tech Startups
If uptime, scalability, and cost efficiency matter to your business — this dashboard is essential.
🎯 Why Choose Cloud Hosting Services KPI Dashboard in Excel?
✔ Centralized KPI tracking
✔ MTD & YTD structured monitoring
✔ Visual performance alerts
✔ Historical trend comparison
✔ Easy customization
✔ Budget-friendly solution
✔ Professional executive reporting
Stop guessing performance. Start measuring it.
Click here to read the Detailed blog post
Visit our YouTube channel to learn step-by-step video tutorials:
👉 https://youtube.com/@PKAnExcelExpert