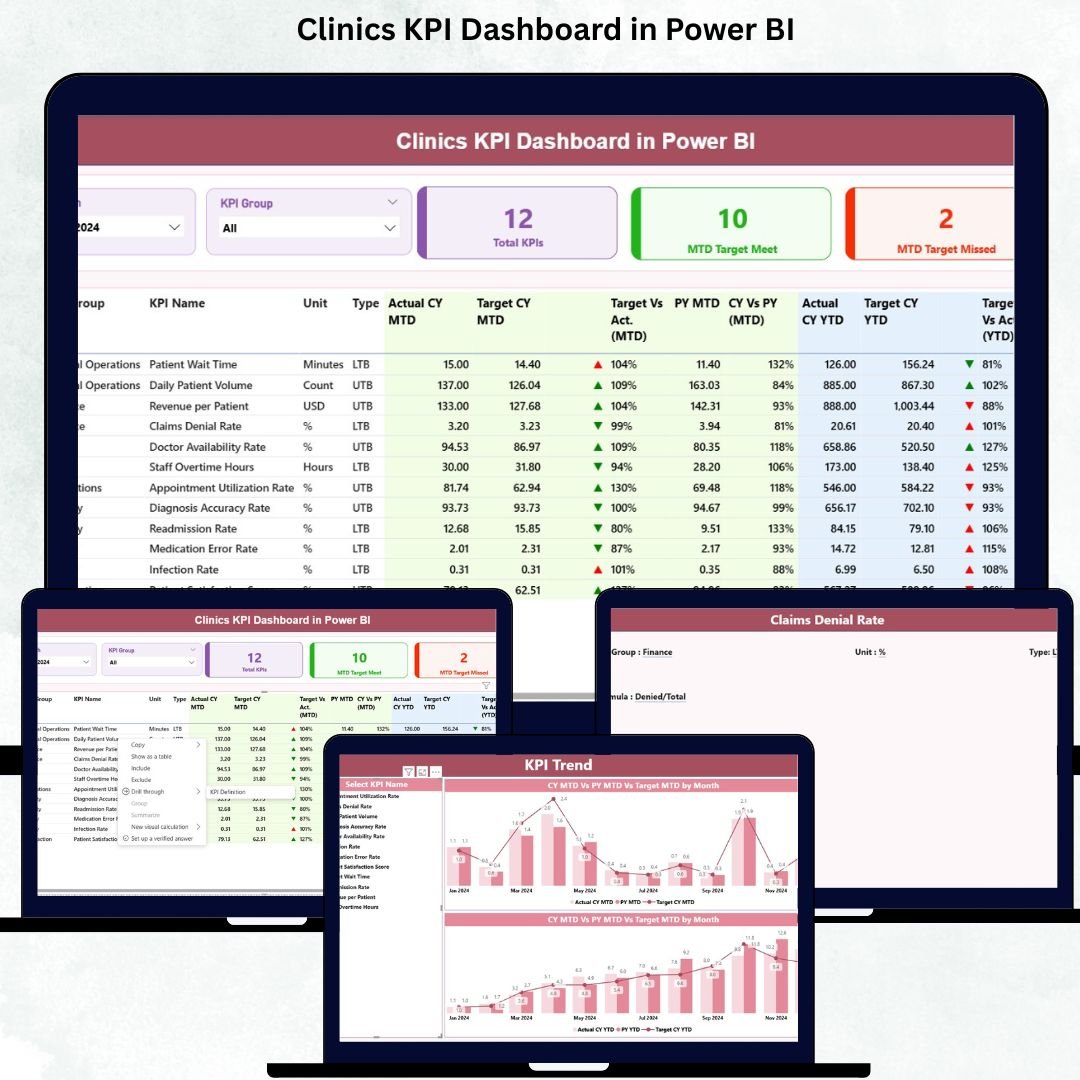
Running a clinic is not just about delivering great medical care — it’s also about managing operations, tracking KPIs, improving patient flow, and maintaining financial stability. But when data sits across different spreadsheets and manual reports, it becomes almost impossible to get clarity. That’s where the Clinics KPI Dashboard in Power BI becomes your most powerful asset.
This ready-to-use digital product helps clinics track every important metric in one intelligent dashboard. With interactive visuals, automated calculations, and real-time updates, you get complete control over your clinic’s daily, monthly, and yearly performance with just one click. Whether you manage a single clinic or a multi-branch network, this dashboard gives you the visibility you need to make confident decisions.
Let’s explore everything included inside this professional Power BI dashboard template.
✨ Key Features of the Clinics KPI Dashboard in Power BI
This dashboard is packed with smart features designed to simplify clinical monitoring, boost productivity, and help you make better decisions.
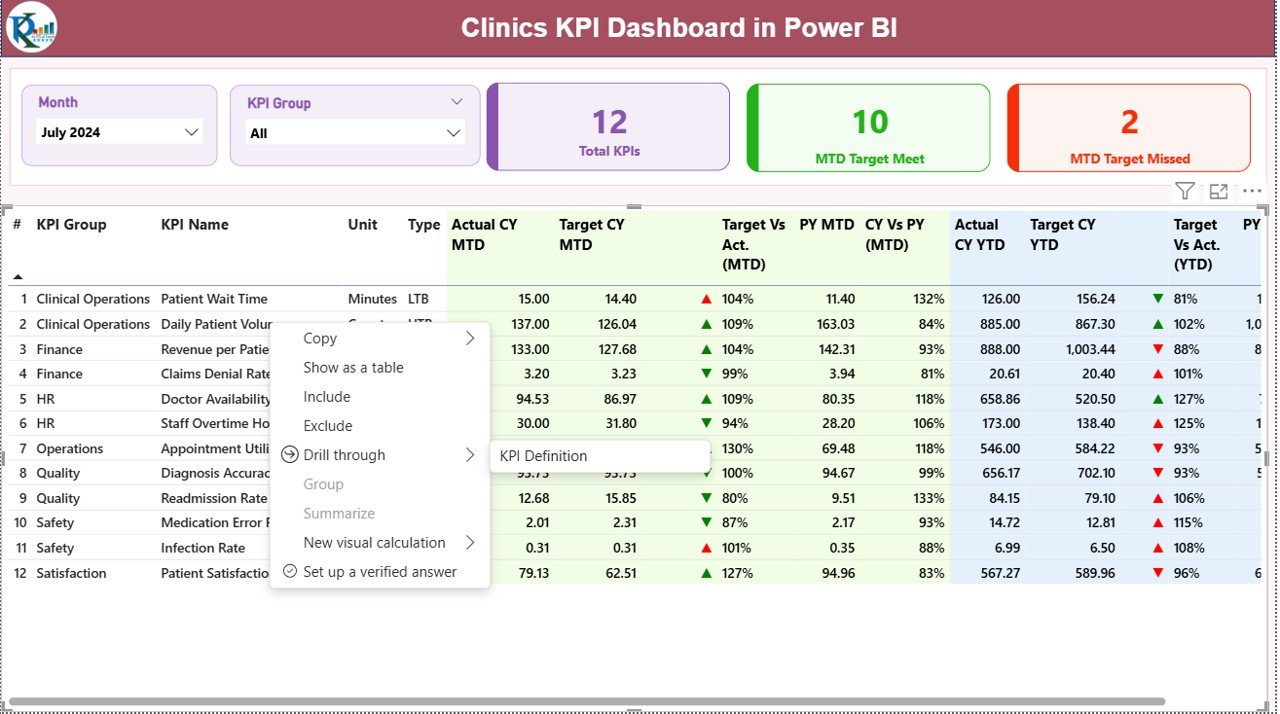
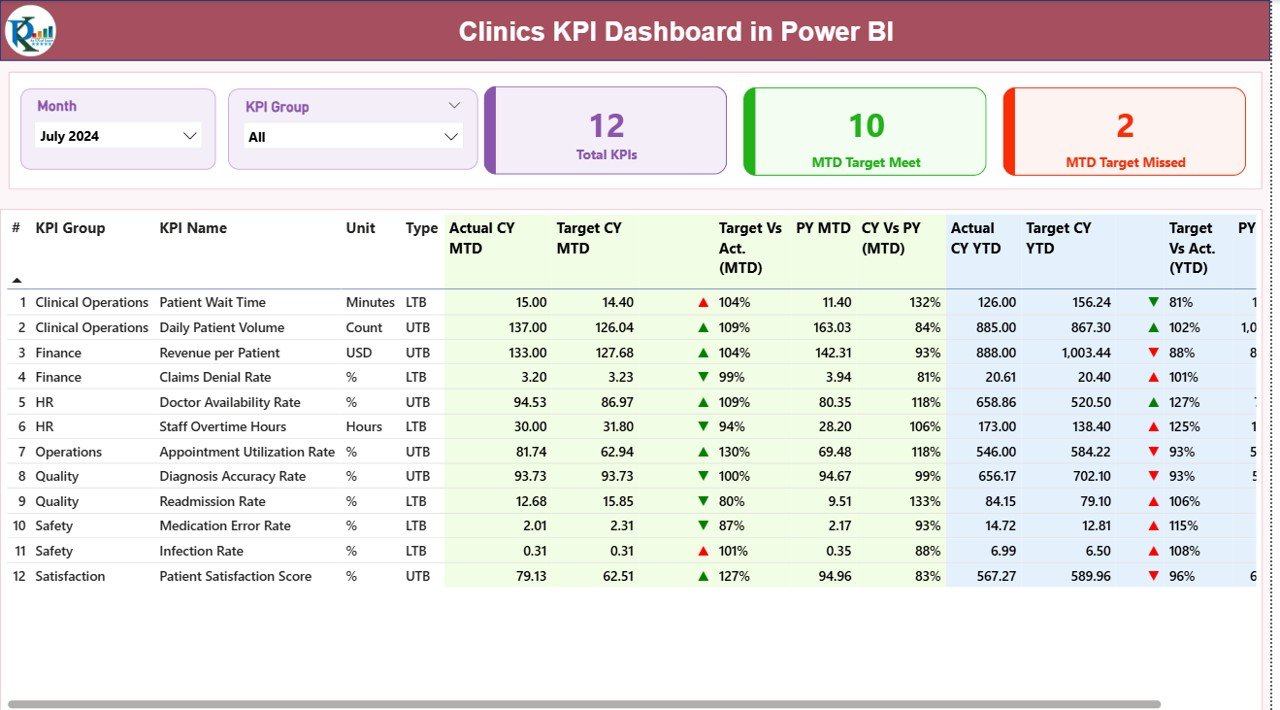
⭐ Summary Page – All KPIs in One Place
This is your main dashboard view where you instantly see:
-
📅 Month Slicer – Switch between months seamlessly
-
🏥 KPI Group Filter – View KPIs category-wise
-
🔢 Total KPIs Count – See how many KPIs you are tracking
-
✅ MTD Target Met Count – Know how many KPIs achieved the monthly target
-
❌ MTD Target Missed Count – Identify areas needing improvement
A detailed KPI table displays:
-
KPI Number
-
KPI Group & Name
-
Unit & Type (UTB or LTB)
-
MTD Actual, Target, Previous Year
-
YTD Actual, Target, Previous Year
-
Trend Icons (▲ ▼)
-
Target vs Actual (MTD & YTD)
You get a complete picture of monthly and yearly performance instantly.
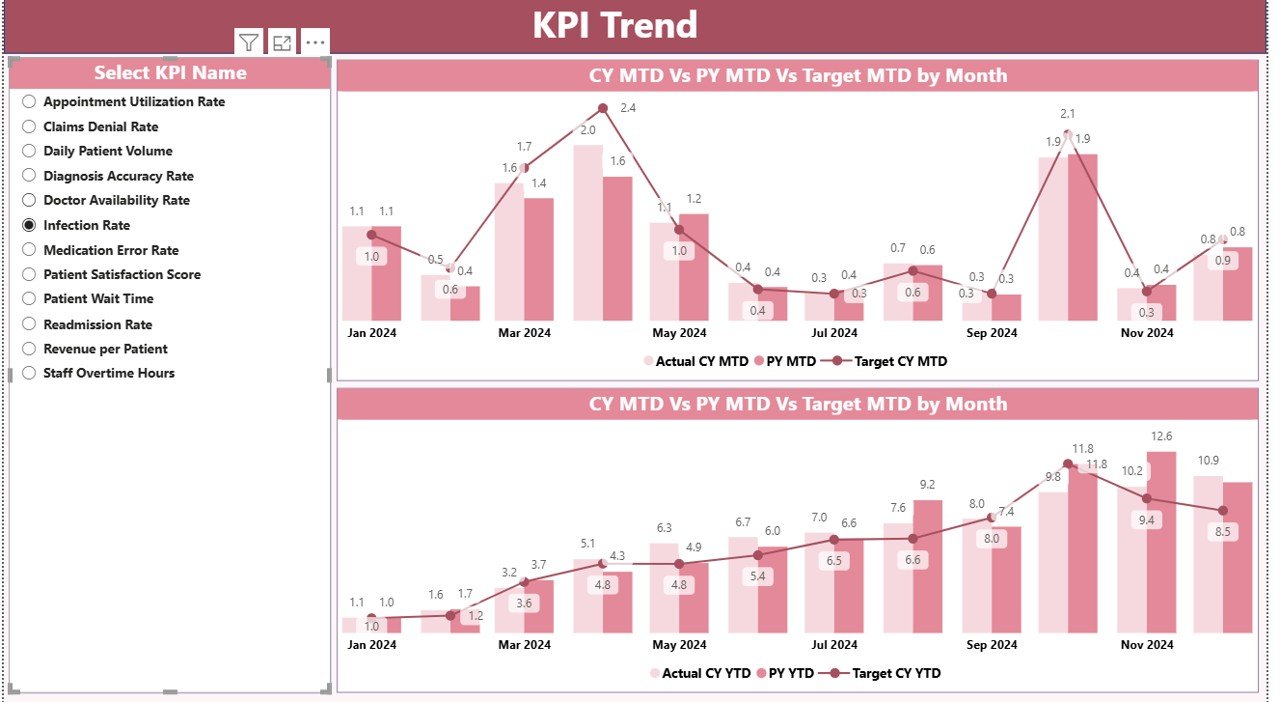
⭐ KPI Trend Page – Visual Performance Analysis
This page helps you compare:
-
📊 MTD Actual vs Target vs Previous Year
-
📈 YTD Actual vs Target vs Previous Year
A KPI slicer lets you pick any KPI and view its progress through dynamic charts.
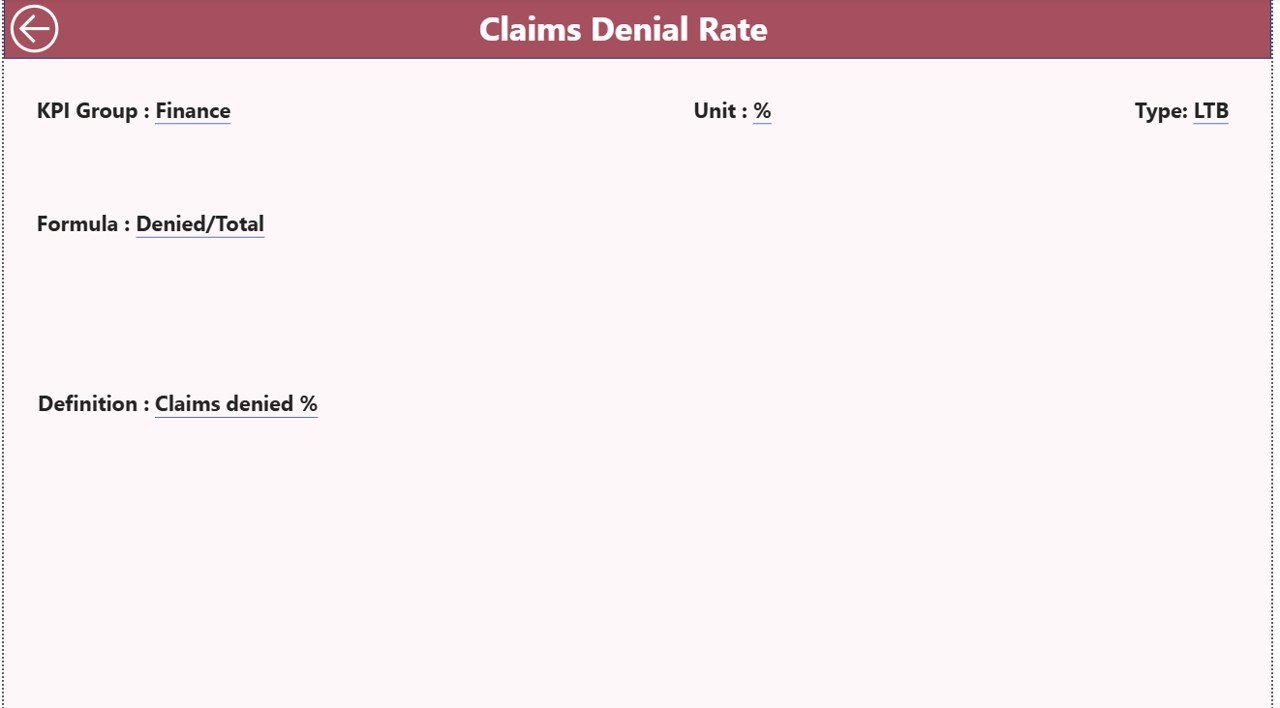
⭐ KPI Definition Page – Drill-Through Insights
This hidden drill-through page shows:
-
KPI Number
-
KPI Name
-
Unit
-
Formula
-
Definition
-
KPI Type (UTB/LTB)
Just right-click any KPI in the summary table to view detailed definitions.
📂 What’s Inside the Clinics KPI Dashboard in Power BI
Your download includes a fully automated Power BI file connected to an Excel data source. Inside the Excel file, you’ll find three key sheets:
📘 1. Input_Actual Sheet
Enter:
-
KPI Name
-
Month
-
MTD Actual
-
YTD Actual
📙 2. Input_Target Sheet
Enter:
-
KPI Name
-
Month
-
MTD Target
-
YTD Target
📗 3. KPI Definition Sheet
Enter:
-
KPI Number
-
Group
-
KPI Name
-
Formula
-
Unit
-
Type (UTB/LTB)
Update these sheets monthly, refresh the dashboard, and you’re done!
🛠️ How to Use the Clinics KPI Dashboard in Power BI
Using this dashboard is incredibly easy—even for beginners.
Step 1: Update Excel File
Add your clinic’s monthly data to the Actual, Target, and Definition sheets.
Step 2: Refresh the Power BI File
Just click Refresh—the entire dashboard updates automatically.
Step 3: Analyze KPI Performance
Use slicers to compare:
-
MTD vs Target
-
YTD vs Target
-
Current Year vs Previous Year
Step 4: Drill Into KPI Details
Right-click any KPI to view its definition and clarity.
Step 5: Make Data-Driven Decisions
Fix bottlenecks, improve workflows, and enhance patient service effortlessly.
👥 Who Can Benefit from This Power BI Dashboard?
This dashboard is designed for a wide range of healthcare teams:
🏥 Clinic Owners
Track revenue, operations, and patient experience easily.
👨⚕️ Doctors & Specialists
Monitor consultation time, patient volume, and service performance.
📊 Clinic Administrators
Improve scheduling, workflow, and monthly reporting.
💼 Management Teams
Analyze trends, compare performance, and plan improvements.
🏢 Multi-Branch Clinics
Track each branch individually or combine results.
📈 Healthcare Analysts
Use structured data and automated visuals for reporting.
If you want a professional, ready-to-use solution for tracking clinical KPIs—this template is perfect for you.
### Click here to read the detailed blog post
Watch the step-by-step video tutorial:


Reviews
There are no reviews yet.