Managing clinic purchasing without real-time visibility often leads to budget overruns, vendor delays, stock shortages, and operational risks. Clinics handle medical supplies, pharmaceuticals, equipment, and multiple vendors every day. Therefore, relying on manual Excel reports or scattered data files is no longer effective.
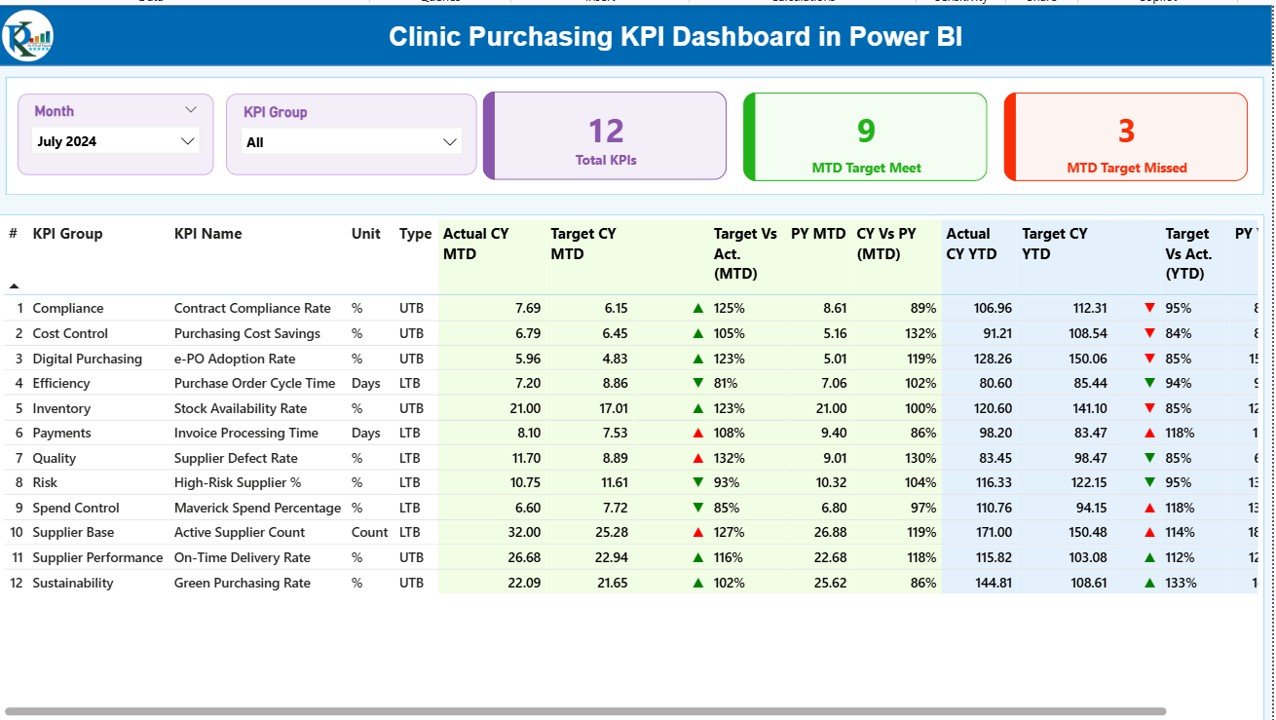
That is exactly where the Clinic Purchasing KPI Dashboard in Power BI becomes a powerful and practical solution. This ready-to-use dashboard transforms raw purchasing data into meaningful KPIs, visual indicators, and performance trends. As a result, clinic administrators and procurement teams gain complete control over purchasing operations and can make confident, data-driven decisions faster.
Built using Power BI with Excel as the data source, this dashboard is simple to deploy, easy to maintain, and powerful enough to handle complex purchasing analytics—without requiring advanced technical skills.
🚀 Key Features of Clinic Purchasing KPI Dashboard in Power BI
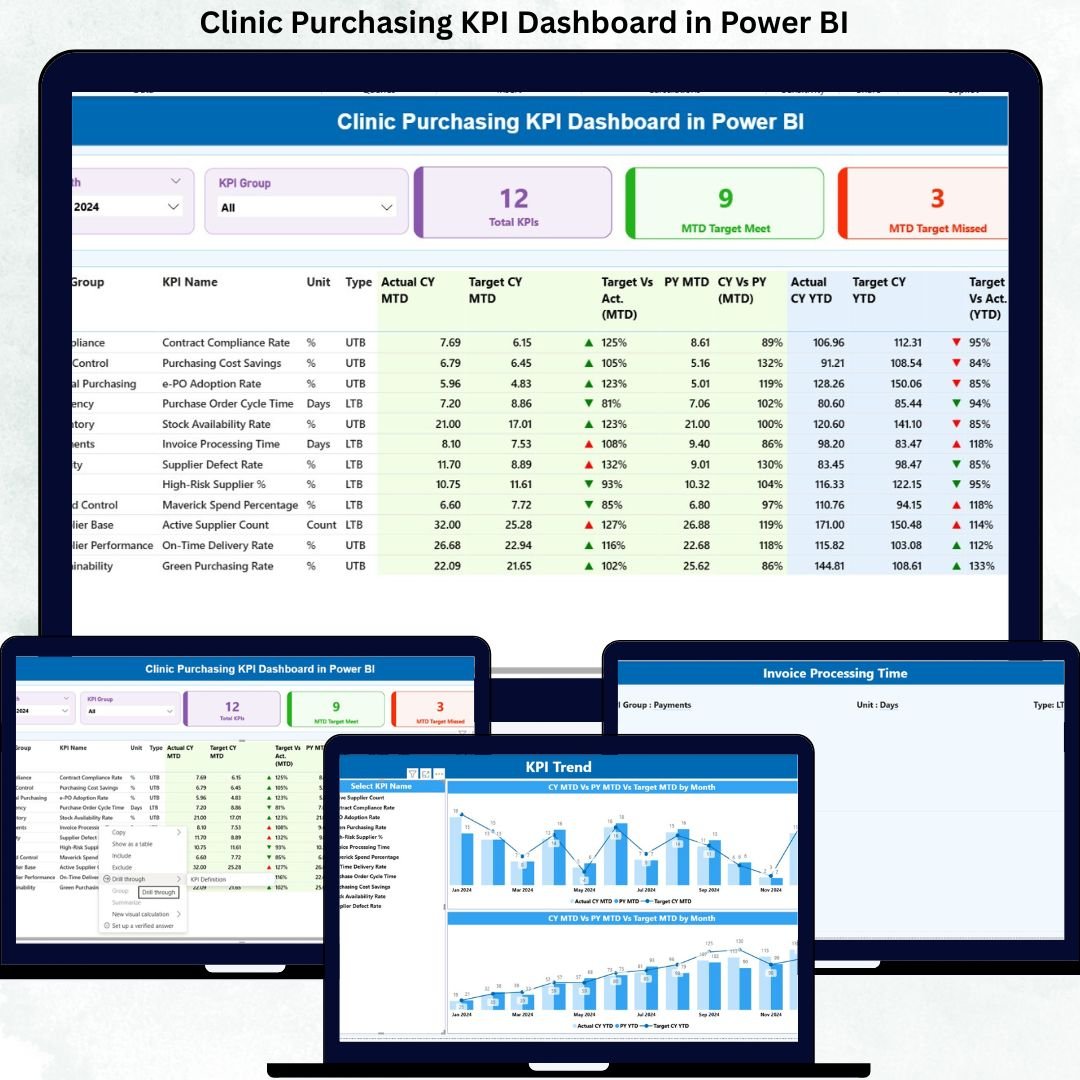
📊 Centralized Purchasing Performance Monitoring
Track all clinic purchasing KPIs from a single interactive Power BI dashboard instead of managing multiple files.
📅 Dynamic Month & KPI Group Slicers
Instantly filter KPIs by reporting month or purchasing category for focused analysis.
🎯 MTD & YTD Target vs Actual Tracking
Monitor Month-to-Date and Year-to-Date performance with automated calculations.
🚦 Visual KPI Status Indicators (LTB & UTB Logic)
Green and red icons instantly highlight target meets and misses.
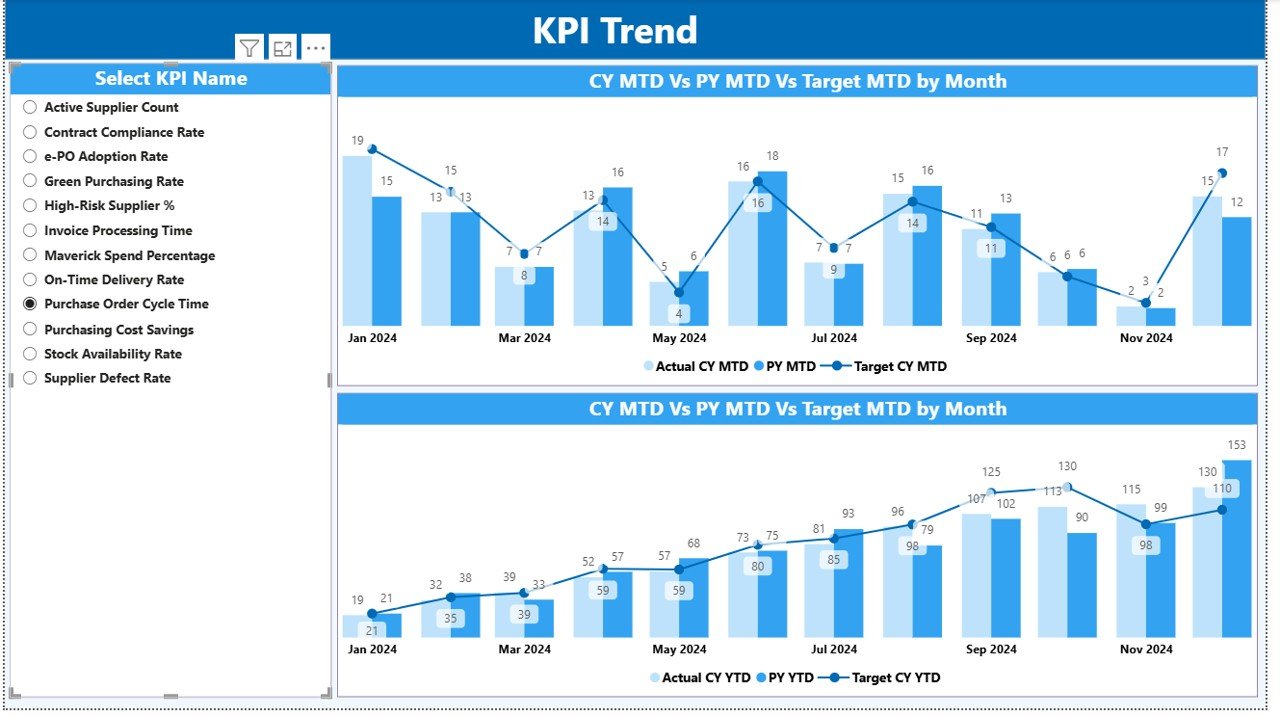
📈 Trend Analysis with Combo Charts
Analyze Current Year vs Previous Year vs Target trends for both MTD and YTD.
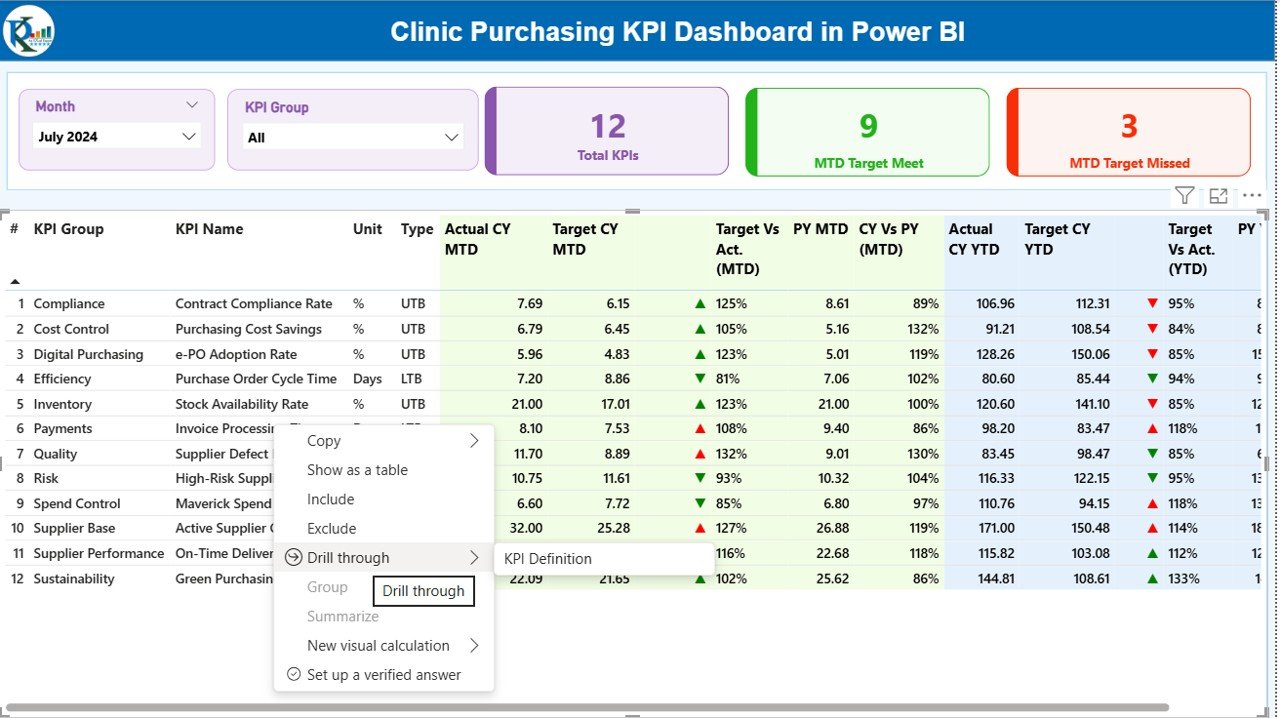
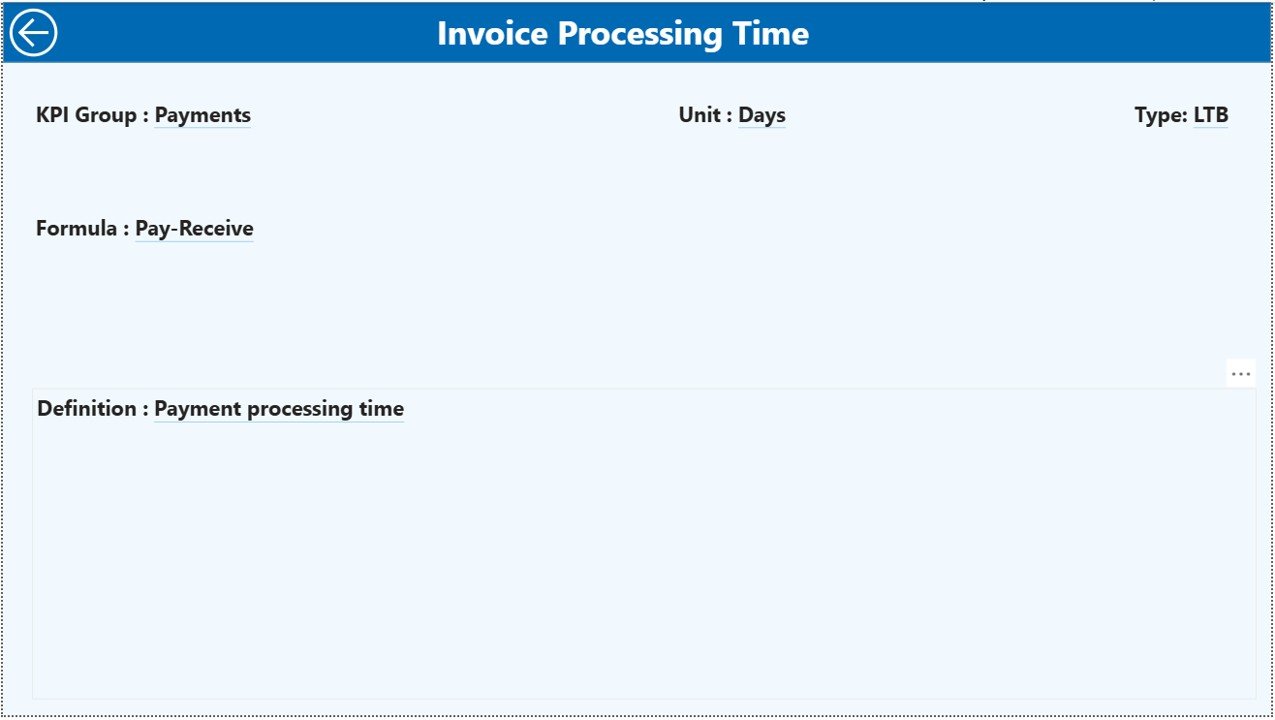
📘 Drill-Through KPI Definition Page
Right-click any KPI to view its definition, formula, unit, and KPI type.
📂 Excel-Based Data Source
Update data easily using structured Excel sheets—no system integration required.
📦 What’s Inside the Clinic Purchasing KPI Dashboard
This Power BI file includes three professionally designed pages, each serving a clear analytical purpose:
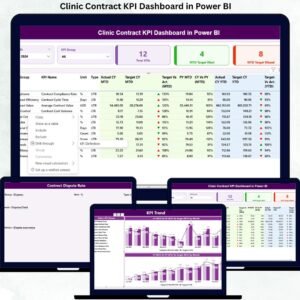
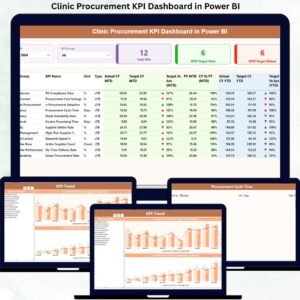
📌 Summary Page
A complete purchasing performance overview with KPI cards, slicers, and a detailed KPI table covering:
-
Actual vs Target (MTD & YTD)
-
CY vs PY comparisons
-
Visual performance indicators
📌 KPI Trend Page
Interactive combo charts showing:
-
Current Year actuals
-
Previous Year actuals
-
Target values
Users can select any KPI to analyze performance trends instantly.
📌 KPI Definition Page (Drill-Through)
A hidden reference page displaying:
-
KPI definition
-
Formula
-
Measurement unit
-
KPI type (LTB or UTB)
🛠️ How to Use the Clinic Purchasing KPI Dashboard
1️⃣ Enter purchasing Actual data in the Input_Actual Excel sheet
2️⃣ Enter Target values in the Input_Target sheet
3️⃣ Define KPIs clearly in the KPI Definition sheet
4️⃣ Refresh the Power BI file
5️⃣ Use slicers, visuals, and drill-through features to analyze performance
No complex setup. No advanced Power BI skills required.
👥 Who Can Benefit from This Clinic Purchasing KPI Dashboard?
🏥 Clinic Administrators – Gain complete purchasing visibility
📦 Procurement & Purchasing Teams – Track performance efficiently
💼 Finance Teams – Control budgets and spending
📊 Operations Managers – Improve supply availability
🧑⚕️ Healthcare Leadership – Make data-backed decisions
Whether you manage a small clinic or a large healthcare facility, this dashboard helps you stay in control.
Click here to read the Detailed blog post
Watch the step-by-step video tutorial:
Visit our YouTube channel to learn step-by-step video tutorials


Reviews
There are no reviews yet.