


Managing a cleaning business becomes easier when you can see all your important numbers—profit, cost, client satisfaction, team performance, and service trends—in one place. The Cleaning Services Dashboard in Power BI is a ready-to-use, interactive, and visually rich dashboard that transforms your cleaning operations into clear insights. Whether you run commercial cleaning, residential services, housekeeping, janitorial teams, deep cleaning operations, or on-demand cleaning services, this dashboard gives you full control, complete visibility, and fast decision-making power. ⭐
With dynamic slicers, modern visuals, drill-down analysis, and real-time data integration, this dashboard helps business leaders, supervisors, and team managers track cleaning performance with accuracy. No more manual reports, confusing spreadsheets, or inconsistent numbers—just clean, automated, and intelligent reporting. 🚀
✨ Key Features of the Cleaning Services Dashboard in Power BI
This dashboard includes five analytical pages, each designed to highlight different areas of your cleaning operations.
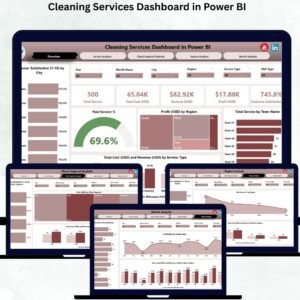
1️⃣ Overview Page – Your Entire Business at a Glance
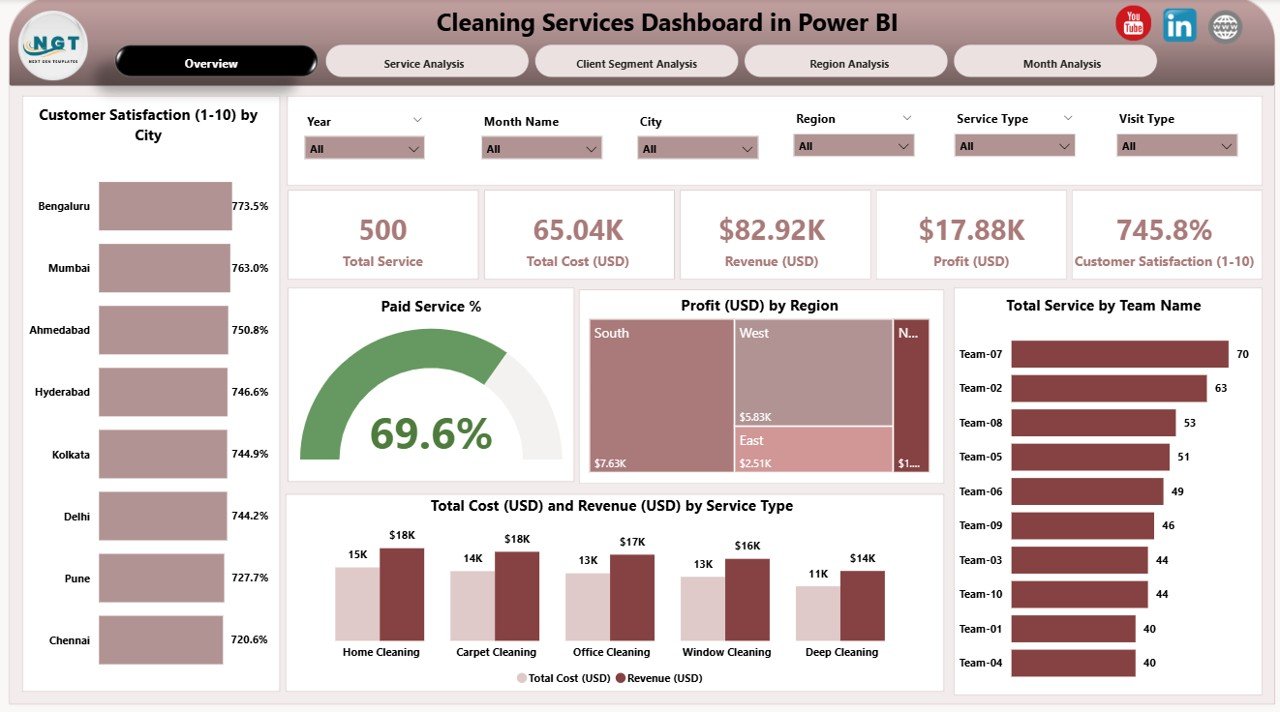
This is the main page where you get the complete business summary.
You will find:
-
⭐ Four KPI Cards – Total Customer Satisfaction Score, Paid Service %, Profit (USD), and Total Service Volume
-
⭐ Powerful charts including Customer Satisfaction by City, Paid Service %, Profit by Region, Service Count by Team, Cost vs Revenue by Service Type
-
⭐ Slicers to filter by Month, Region, City, Service Type, or Team Name
This page helps you instantly understand which locations perform well, which teams deliver more services, and where profits are growing.
📦 What’s Inside the Cleaning Services Dashboard in Power BI
2️⃣ Service Analysis Page – Compare Cleaning Services
Understand performance by each service type such as deep cleaning, disinfection, carpet cleaning, housekeeping, etc.
Charts included:
-
😊 Customer Satisfaction by Service Type
-
💰 Profit (USD) by Service Type
-
🔁 Paid Service % by Service Type
This helps you identify profitable services and improve low-performing ones.
3️⃣ Client Segment Analysis – Understand Your Customer Base
Cleaning companies serve different customer segments like:
-
Residential
-
Corporate offices
-
Retail stores
-
Hotels
-
Hospitals
-
Industrial clients
This page includes charts for:
-
Customer Satisfaction
-
Profit by Client Segment
-
Paid Service %
Use this page to plan marketing, improve service levels, and boost retention.
4️⃣ Region Analysis – Track Region-wise Performance
View trends across multiple regions and locations.
Charts include:
-
Profit by Region
-
Cost vs Revenue by Region
-
Paid Service % by Region
This page helps you spot high-performing and high-cost regions instantly.
5️⃣ Monthly Trends Page – Track Growth Month by Month
Analyze seasonal patterns, monthly cost behavior, service demand, and revenue trends.
Charts include:
-
Total Services by Month
-
Revenue by Month
-
Cost by Month
-
Paid Service (USD) by Month
This page is ideal for forecasting and strategic planning.
🛠 How to Use the Cleaning Services Dashboard in Power BI
-
📥 Update your source data (Excel, database, or CSV).
-
🔄 Refresh the Power BI file.
-
🎯 Use slicers to filter by team, city, month, service type, or region.
-
📊 Review KPI cards and charts to understand performance instantly.
-
🔍 Use trend pages to identify improvement opportunities.
-
📈 Share the dashboard with your team through Power BI Service.
This dashboard is beginner-friendly and easy to update—making reporting simple and fast.
👥 Who Can Benefit from This Cleaning Dashboard?
This dashboard is perfect for:
-
🧹 Cleaning service providers
-
🏢 Facility management companies
-
🏨 Hotels & housekeeping departments
-
🏥 Hospital cleaning teams
-
🧽 Commercial janitorial companies
-
🚀 On-demand cleaning platforms
-
📊 Operations managers & supervisors
-
💼 Business owners and directors
If you want to improve service quality, profit, and customer satisfaction—this dashboard is a must-have.


Reviews
There are no reviews yet.