


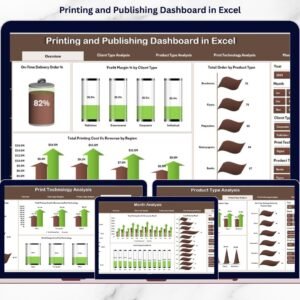
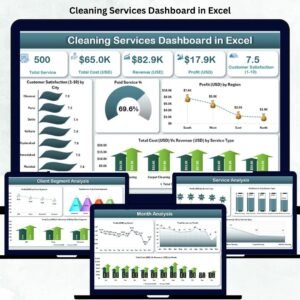
The Cleaning Services Dashboard in Excel is your all-in-one performance-tracking tool for running a successful cleaning business. Whether you manage residential, commercial, or industrial clients, this dashboard transforms your operational data into clear visual insights — empowering you to make smarter, data-driven decisions.
In an industry where time, quality, and satisfaction matter most, managing multiple clients, cities, and service types can be overwhelming. This ready-to-use Excel dashboard centralizes everything — from revenue and cost tracking to satisfaction scoring — so you can focus on delivering excellence, not juggling spreadsheets.
Built with pivot charts, slicers, and automated KPIs, it turns data into easy-to-understand visuals that help you monitor performance, profitability, and customer happiness — all in one interactive Excel file.
✨ Key Features of the Cleaning Services Dashboard in Excel
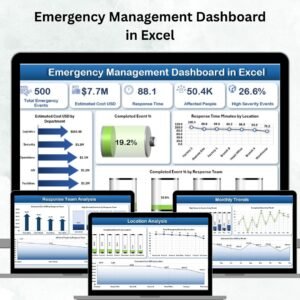
✅ 📊 Overview Page – Instant Business Snapshot

Gain a top-level view of your company’s performance.
Includes:
-
Total Customers Served
-
Total Profit (USD)
-
Paid Service %
-
Customer Satisfaction (1–10)
Visual charts show:
⭐ Satisfaction by City
💰 Profit (USD) by Region
⚖️ Total Cost vs Revenue by Service Type
💳 Paid Service % by City
🎯 Instantly understand which areas perform best and where improvements are needed.
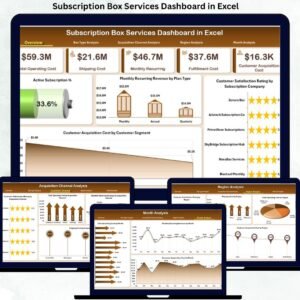
✅ 🧽 Service Analysis Page – Compare Service Profitability
Analyze each cleaning service — deep cleaning, carpet cleaning, window cleaning, sanitation, and more.
Charts include:
💰 Profit (USD) by Service Type
⭐ Satisfaction (1–10) by Service Type
💳 Paid Service % by Service Type
💡 Identify top-performing services and those needing attention to boost both profit and satisfaction.
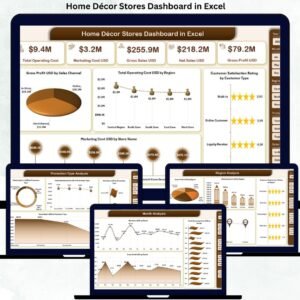
✅ 👥 Client Segment Analysis Page – Know Your Audience
Break down profitability and revenue by client category — Residential, Commercial, Industrial, or Institutional.
-
Profit (USD) by Client Segment
-
Total Cost vs Revenue by Segment
-
Paid Service % by Segment
📈 Target high-value clients and optimize underperforming segments easily.
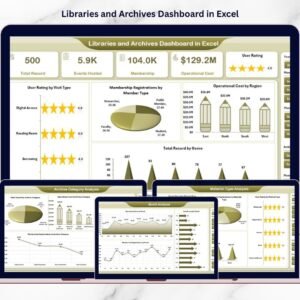
✅ 🌍 Region Analysis Page – Evaluate Geographical Performance
See how each city or region contributes to business success.
Charts include:
⭐ Satisfaction (1–10) by Region
🧾 Total Services by Region
⚖️ Cost vs Revenue by Region
📊 Find where your business is most profitable and where to allocate more resources.
✅ 📅 Month Analysis Page – Monitor Trends Over Time
Analyze performance month-to-month.
Charts include:
💰 Profit (USD) by Month
🧾 Total Services by Month
⚖️ Cost vs Revenue by Month
🕒 Discover seasonal trends, predict workloads, and plan budgets accurately.
📦 What’s Inside the Dashboard
📁 Five Analytical Pages: Overview | Service | Client | Region | Month
📂 Support Sheet: Centralized Data Sheet with columns for:
-
Service ID, Date, City/Region
-
Service Type & Client Segment
-
Revenue, Cost, and Profit
-
Satisfaction Score (1–10)
-
Payment Status (Paid/Unpaid)
💡 All visuals update dynamically when data changes — no coding or macros required.
⚙️ How to Use the Dashboard
1️⃣ Enter or import data into the Data Sheet.
2️⃣ Click Refresh All to update charts and KPIs automatically.
3️⃣ Use slicers to filter by City, Month, or Client Segment.
4️⃣ Review Overview and Analysis pages for detailed insights.
5️⃣ Export visuals to PDF or PowerPoint for reports and meetings.
🧠 Anyone familiar with basic Excel can use this dashboard — no advanced skills needed!
👥 Who Can Benefit from This Dashboard
🧹 Cleaning Companies – Monitor profit, cost, and satisfaction easily.
🏢 Facility Management Firms – Track service performance across multiple sites.
💼 Business Owners – Get a clear overview of growth and efficiency.
📊 Operations Managers – Identify trends and optimize service delivery.
👨💻 Account Managers – Improve client experience with transparent data.
This Excel template is your ultimate companion for data-driven cleaning business management.
💡 Advantages of Using the Cleaning Services Dashboard
✅ Centralized Performance View – Manage all KPIs in one file.
✅ Real-Time Updates – All charts refresh instantly with new data.
✅ Improved Profitability – Identify high-margin services quickly.
✅ Customer Focused – Measure and improve satisfaction consistently.
✅ Fully Customizable – Add new KPIs, charts, or slicers easily.
✅ No Extra Software Needed – Works 100 % in Microsoft Excel.
🔗 Click here to read the Detailed Blog Post
🎥 Visit our YouTube channel to learn step-by-step video tutorials


Reviews
There are no reviews yet.