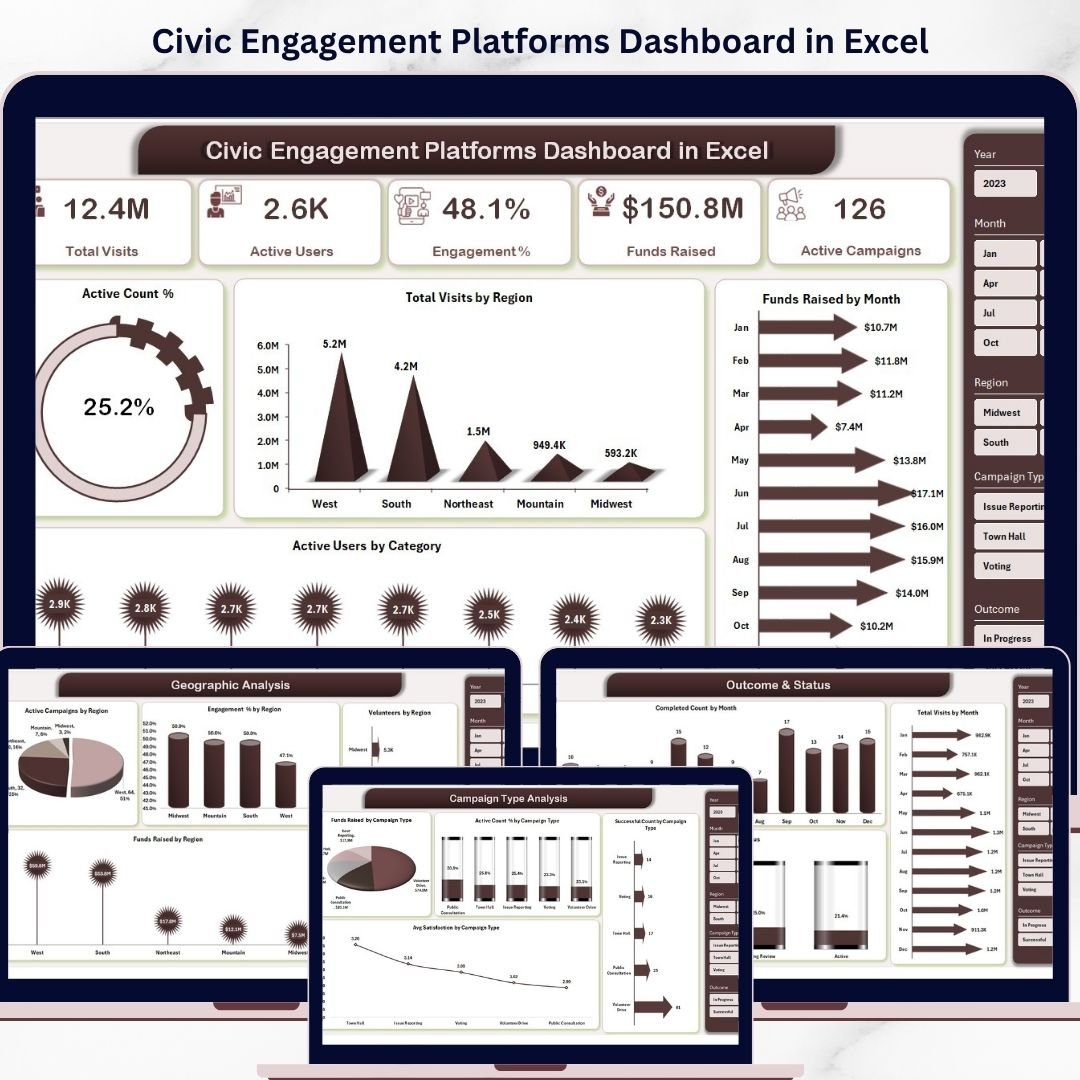
Key Features of Civic Engagement Platforms Dashboard in Excel
Discover the power of data-driven insights with the Civic Engagement Platforms Dashboard in Excel. Designed for ease of use and comprehensive analysis, this ready-to-use dashboard allows you to effortlessly update your data in the Data sheet and refresh all visuals with just a click from the Excel Ribbon’s Data tab. The dashboard dynamically updates to provide you with the latest, most accurate metrics.
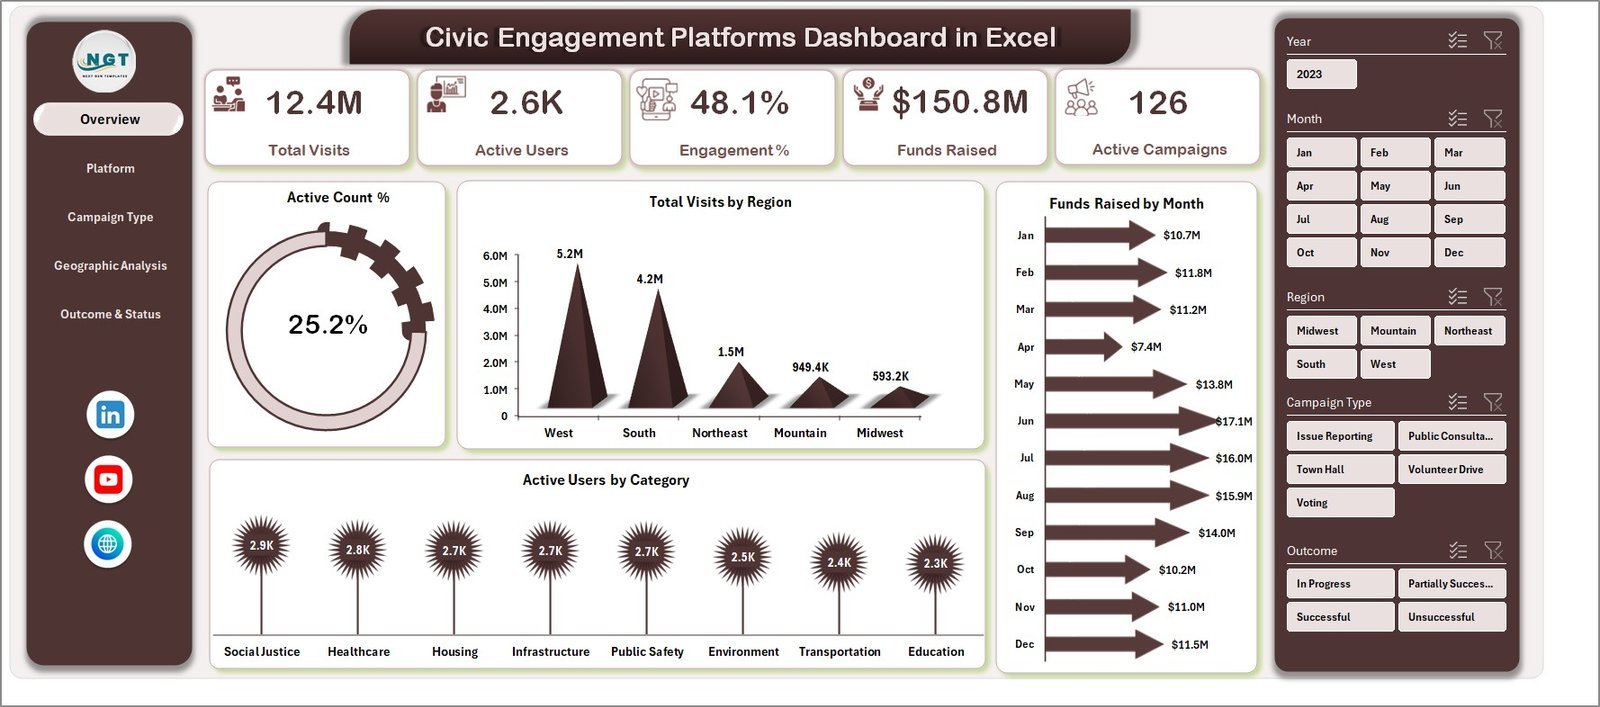
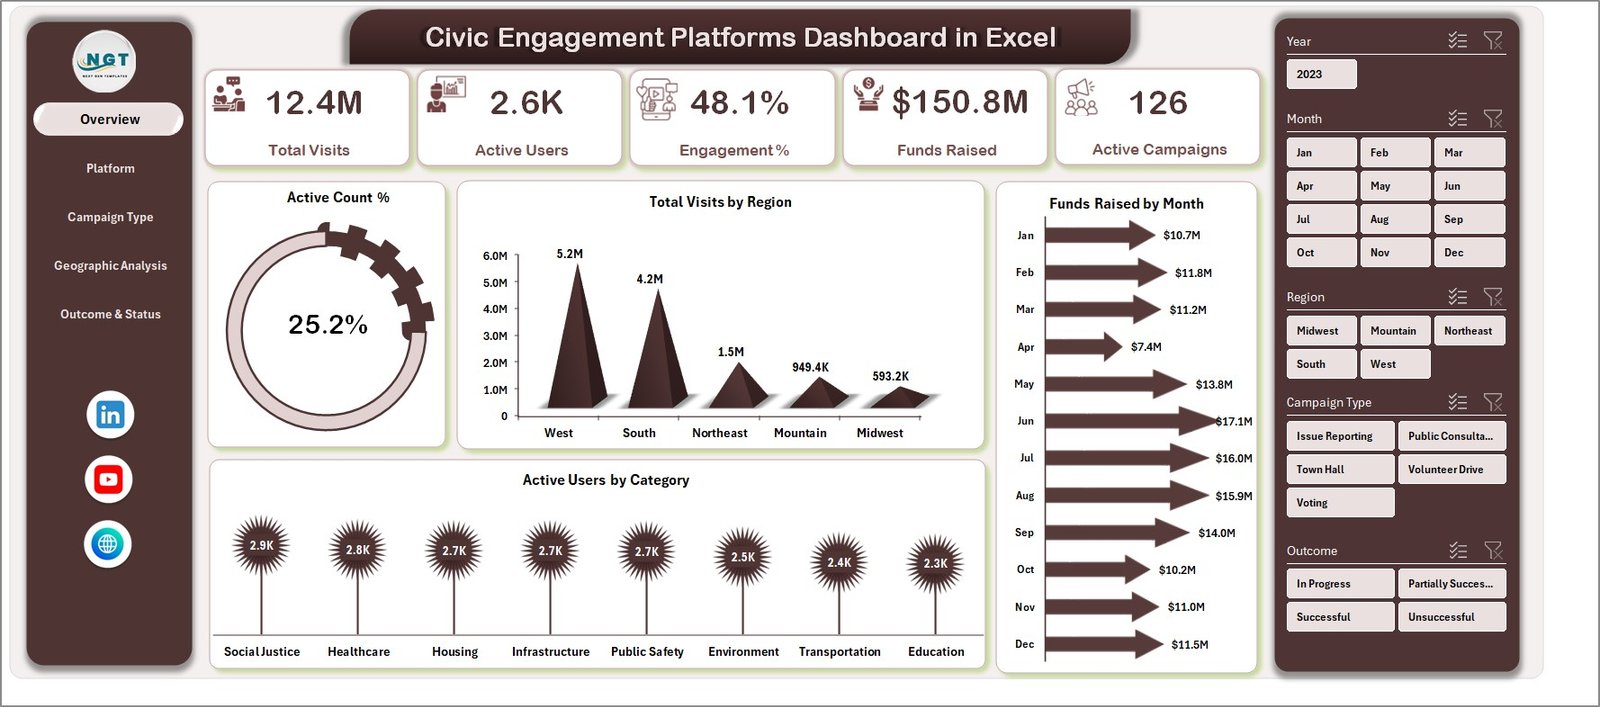
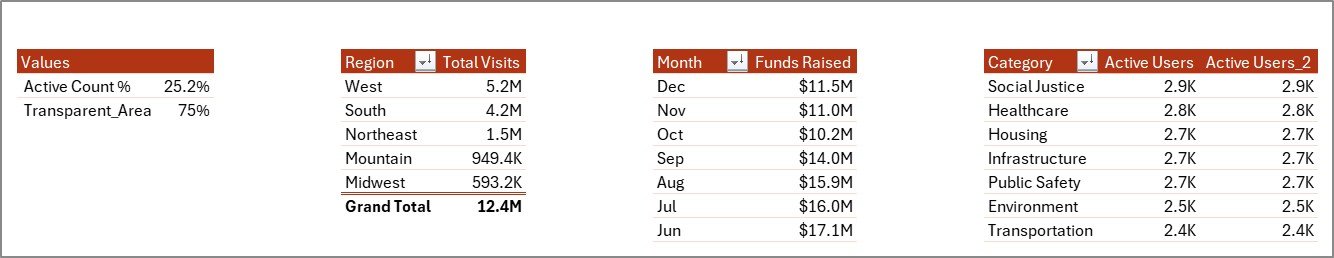
This dashboard features multiple interactive pages, each tailored to provide deep insights into different aspects of your civic engagement platforms. The Overview page highlights the most critical high-level metrics with easy-to-read cards such as Total Visits, Active Users, Engagement Percent, Funds Raised, and Active Campaigns. Accompanying these cards are intuitive charts and multiple slicers that let you filter and drill down into the data quickly.
Charts on the Overview page include:
- Active Count Percent: Visualizes the proportion of active participants within your platform, helping you gauge user engagement effectively.
- Total Visits by Region: Breaks down visits geographically to spot trends and areas of high civic interest.
- Funds Raised by Month: Tracks monthly fundraising progress, enabling timely performance reviews.
- Active Users by Category: Categorizes users to help you identify which segments are most engaged.
Civic Engagement Platforms Dashboard in Excel
What’s Inside the Civic Engagement Platforms Dashboard in Excel
The dashboard is divided into several key sheets, each focusing on critical areas of analysis:
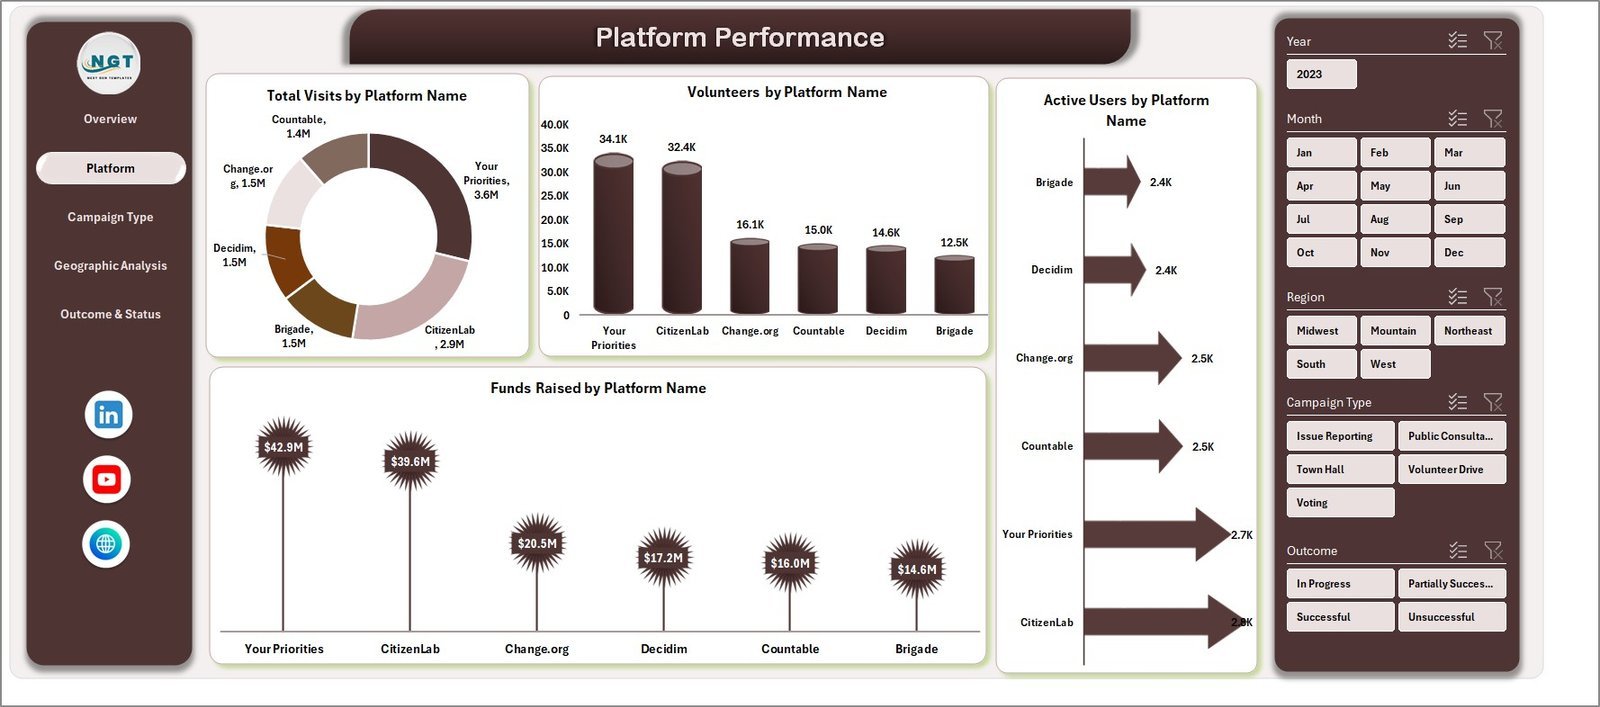
- 📊 Platform Performance: Analyze Total Visits by Platform Name, Volunteers, Active Users, and Funds Raised per platform to understand which platforms are excelling.

Platform Performance
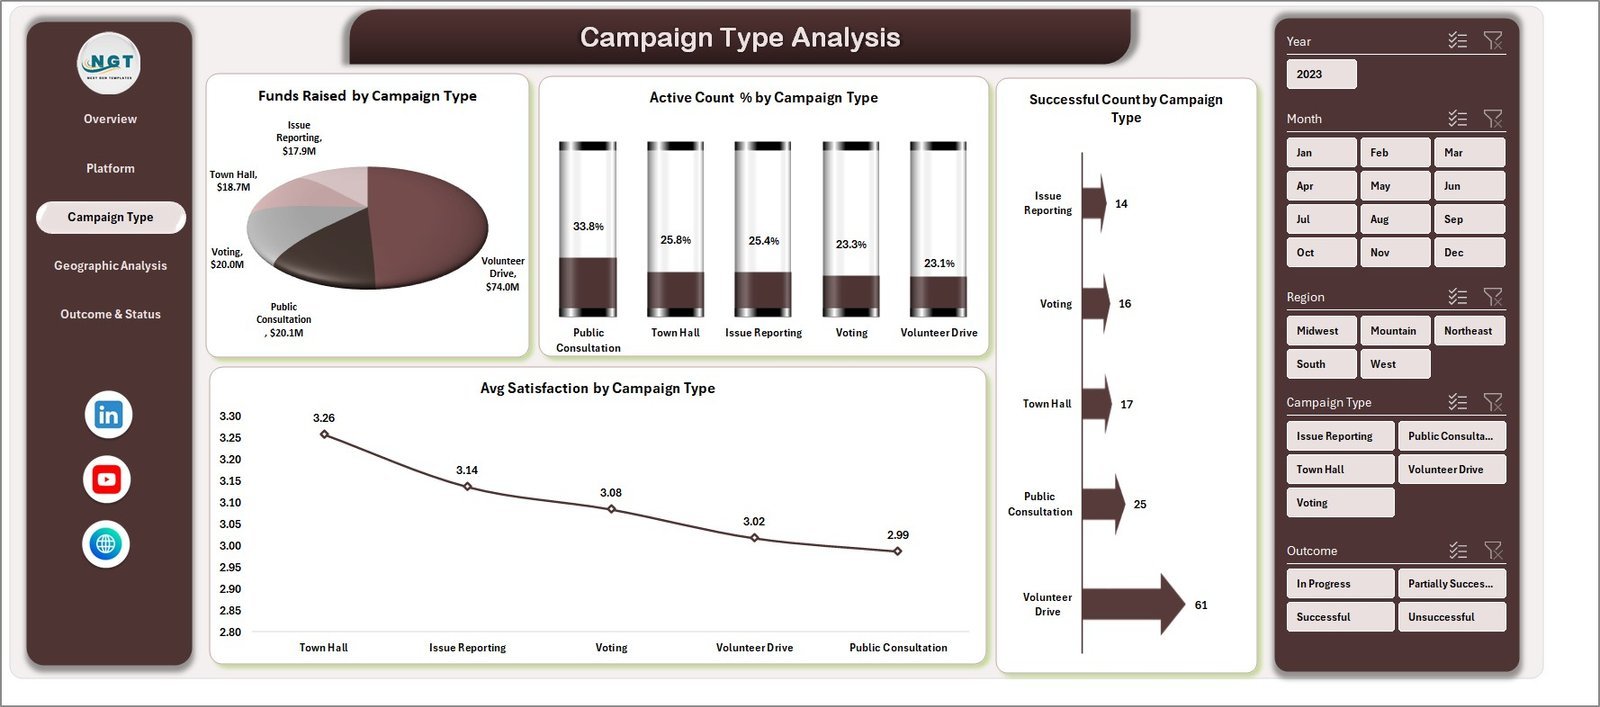
- 📈 Campaign Type Analysis: Gain insights into Funds Raised, Active Count Percent, Successful Count, and Average Satisfaction by campaign type to optimize your outreach strategies.

Campaign Type Analysis
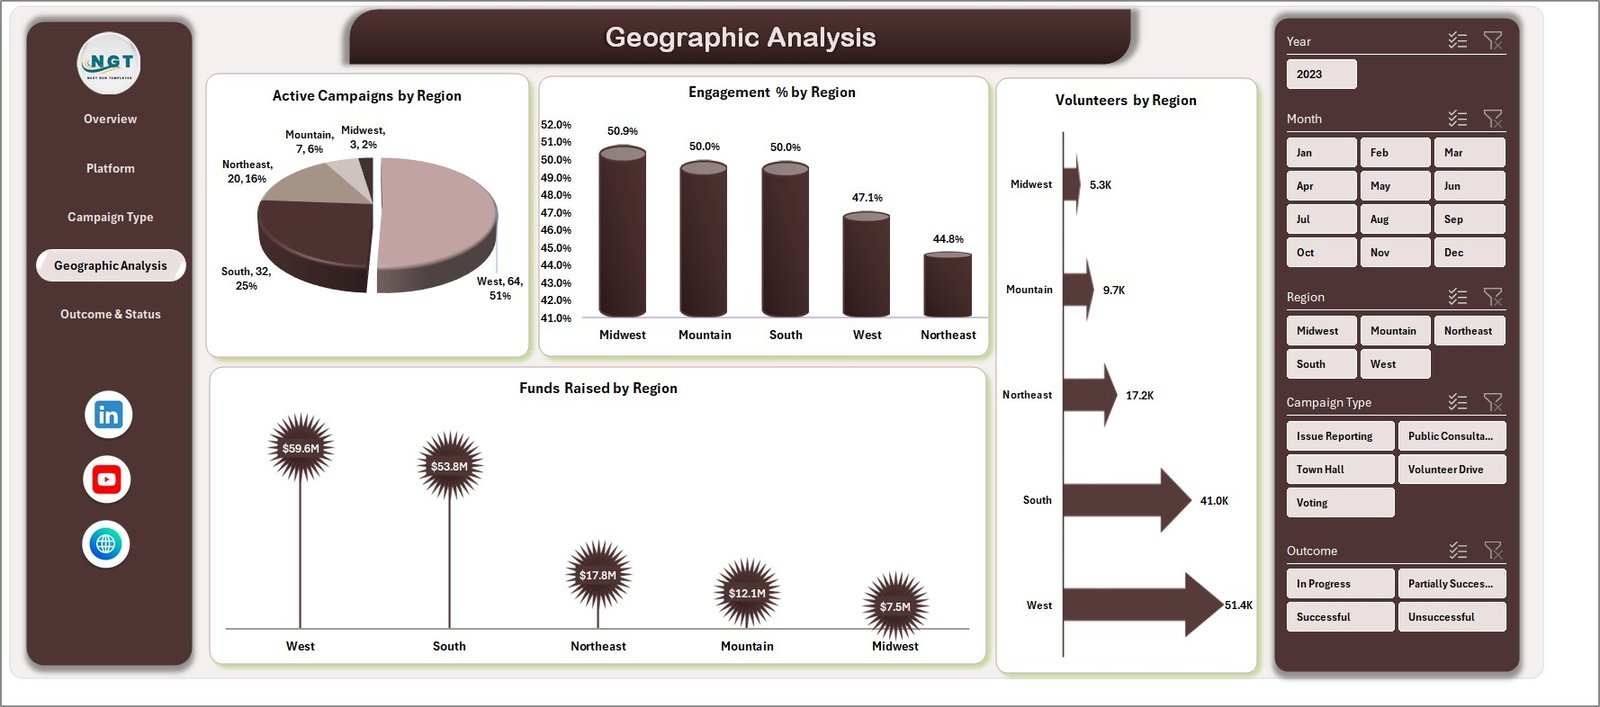
- 🌍 Geographic Analysis: Explore Active Campaigns, Engagement Percent, Volunteers, and Funds Raised by region to target your efforts effectively.

Geographic Analysis
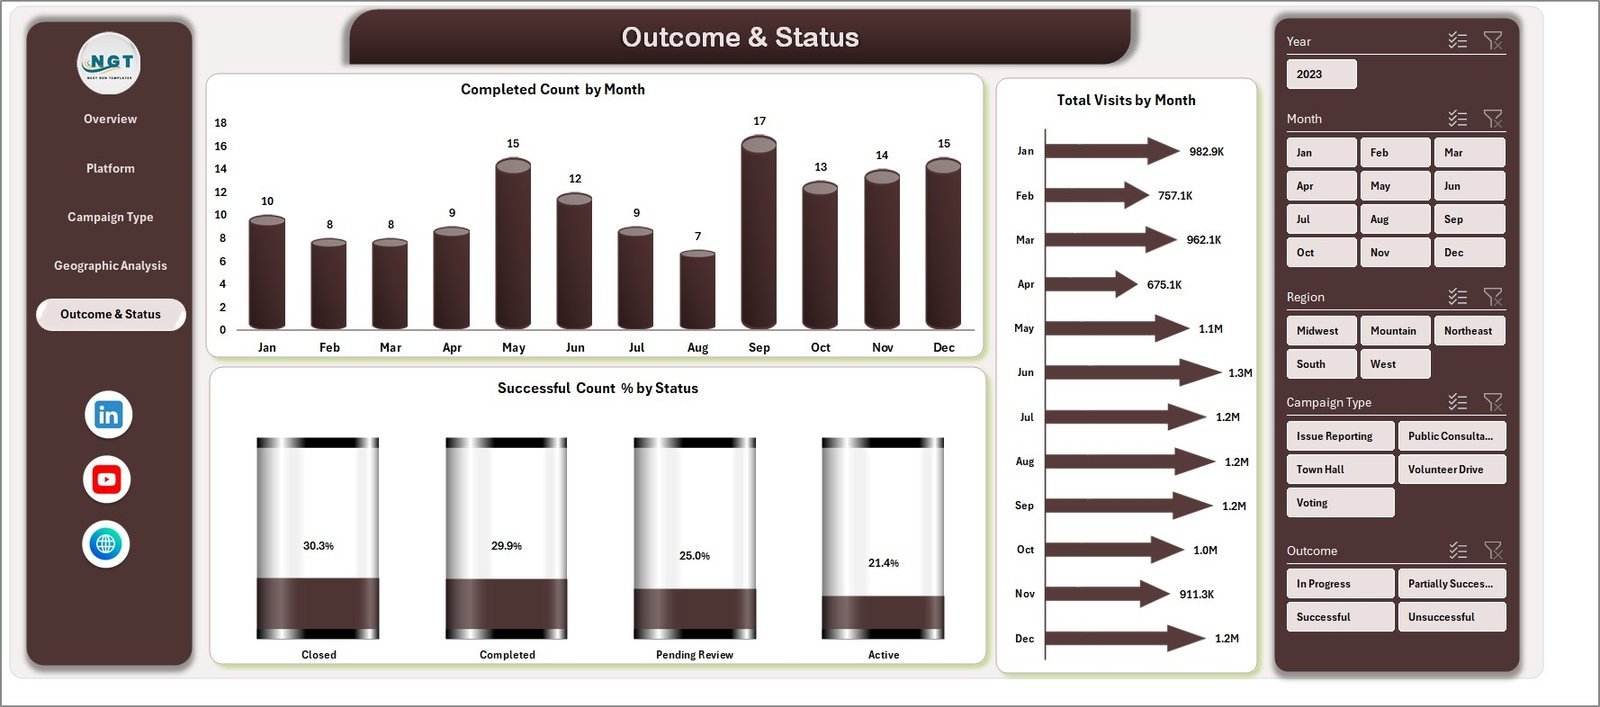
- 📅 Outcome & Status: Track Completed Counts, Total Visits, and Successful Count Percentages by month to monitor progress and success rates.
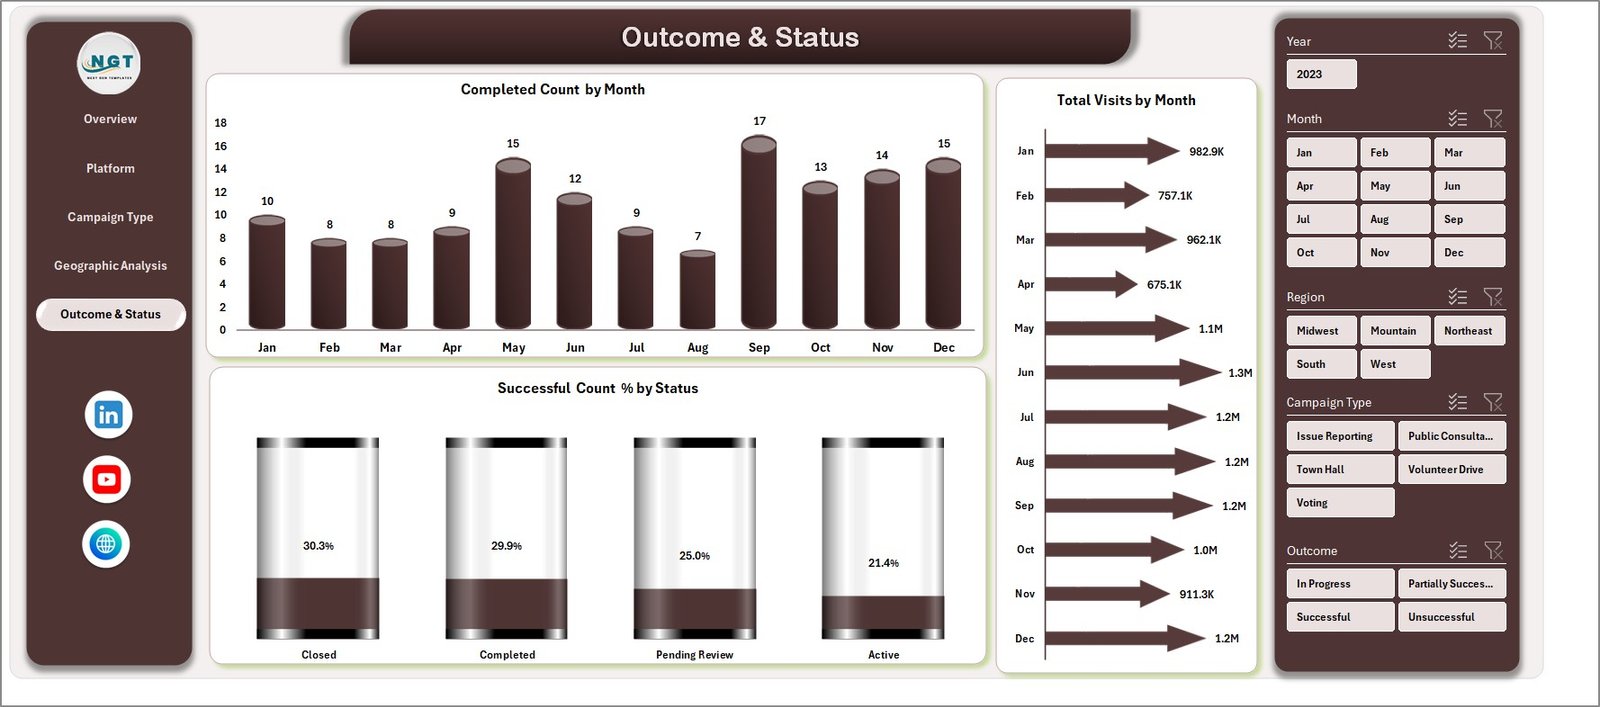
Outcome & Status
- 🗂️ Data Sheet Tab: The backbone of your dashboard where you input and update your raw data following the predefined format for seamless refresh.

Data Sheet tab
- 🛠️ Support Sheet: Houses multiple pivot tables that power your dashboard’s dynamic updates. This sheet can be hidden for tidiness.
Support sheet tab
How to Use the Civic Engagement Platforms Dashboard in Excel
Using this dashboard is incredibly straightforward, designed for users of all Excel skill levels. Simply enter or update your data in the Data Sheet tab following the provided format. Once your data input is complete, navigate to the Data tab on the Excel Ribbon and click Refresh All. This action will update all pivot tables and charts across every dashboard page instantly, reflecting your newest data.
You can then interact with various slicers on each dashboard page to filter data by region, campaign, platform, or other criteria. This flexibility allows you to analyze trends, engagement, and fundraising success with just a few clicks. The dashboard’s built-in dynamic visuals will help you quickly identify opportunities and areas for improvement.
Who Can Benefit from This Civic Engagement Platforms Dashboard in Excel
This dashboard is a gamechanger for a wide range of users, including:
- 🎯 Nonprofit Organizations: Track and visualize engagement, donations, and volunteer activities to maximize impact.
- 📊 Campaign Managers: Monitor performance metrics across platforms and campaigns for better decision-making.
- 👥 Community Leaders: Understand regional engagement and volunteer distribution to plan outreach more effectively.
- 💼 Data Analysts: Utilize a ready-made, dynamic Excel tool to generate insights without building dashboards from scratch.
- 📈 Fundraisers: Measure fundraising progress and identify high-performing campaigns to boost revenue.
- 🏛️ Government Agencies: Evaluate civic participation levels and campaign outcomes for transparency and policy planning.
- 🧑💼 Consultants & Strategists: Provide clients with detailed, interactive reports that drive actionable insights.
Click here to read the Detailed blog post.
Visit our YouTube channel to learn step-by-step video tutorials.


Reviews
There are no reviews yet.