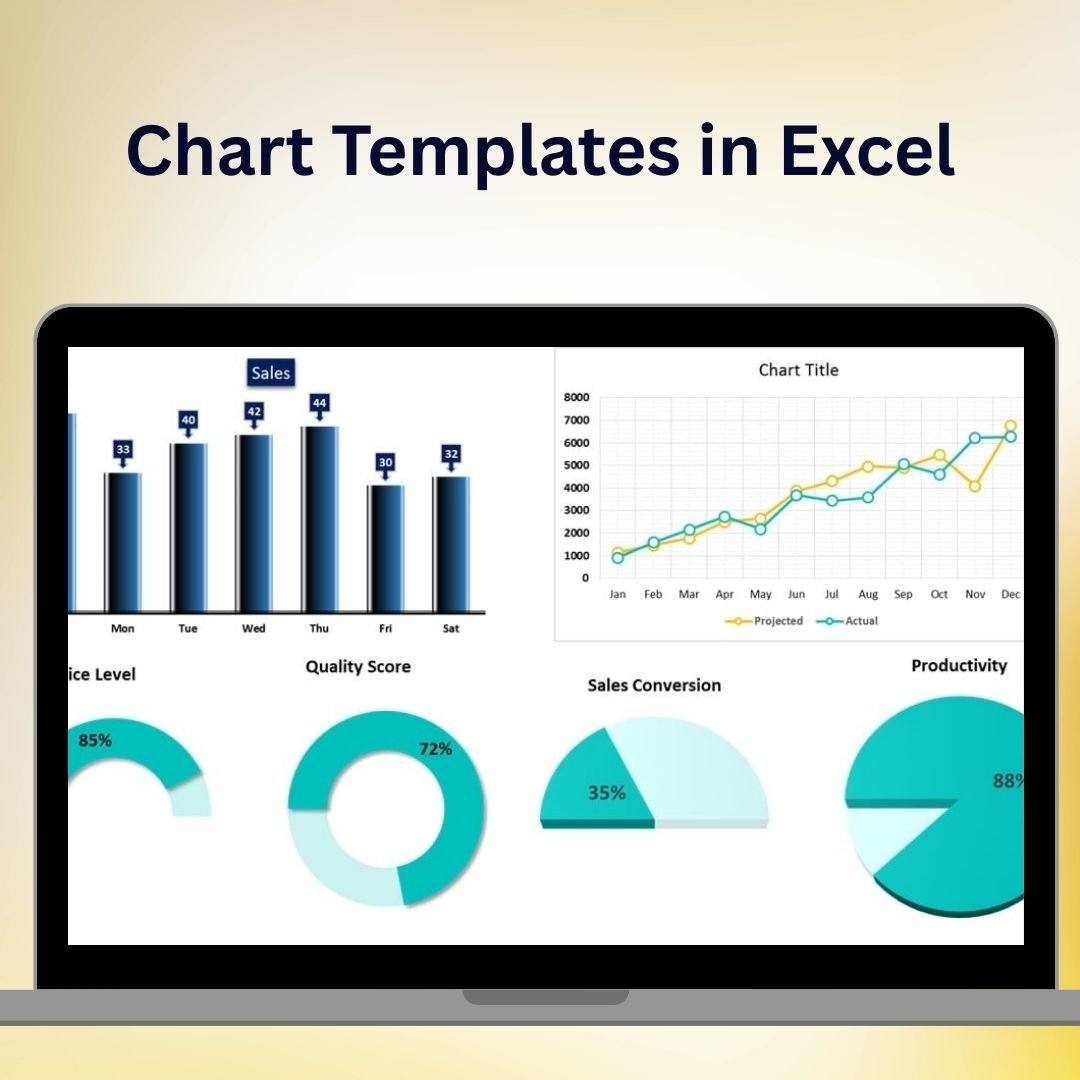
The Chart Templates in Excel is a versatile and comprehensive Excel tool designed to help you easily create stunning charts for any data set. Whether you need to visualize sales data, track project progress, or analyze business performance, this collection of chart templates gives you everything you need to present your data in a professional, visually appealing way.
With these chart templates, you can quickly turn your raw data into informative charts that help communicate key insights, trends, and performance indicators. Each template is customizable, allowing you to tailor the charts to fit your specific data and presentation needs. From bar charts to line graphs, pie charts to scatter plots, this collection provides various chart types that cater to different data visualization requirements.
Key Features of the Chart Templates in Excel
📊 Variety of Chart Types
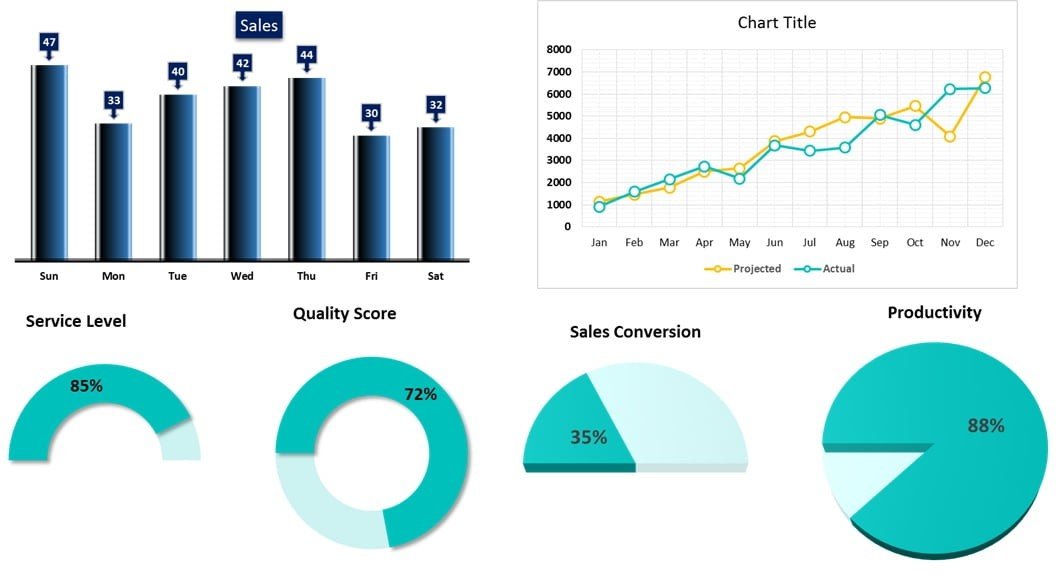
Choose from a wide range of chart templates, including bar charts, line graphs, pie charts, scatter plots, and more. These templates help you select the most suitable chart style for your data, making it easy to visualize trends and comparisons.
🖥️ Easy to Use & Customizable
These chart templates are simple to use. Just input your data into the designated fields, and the charts automatically update to reflect your entries. Customize chart elements such as labels, colors, and titles to match your unique preferences or branding.
📈 Professional & Clean Design
With a sleek, professional design, these templates provide a clean, organized look that’s perfect for business reports, presentations, and dashboards. Impress stakeholders with clear and impactful data visualizations.
🔄 Real-Time Data Updates
As you input or modify your data, the charts update automatically, ensuring that your visualizations are always current and accurate. This dynamic feature helps you stay on top of your data with minimal effort.
🎨 Flexible & Customizable Styles
Adjust the colors, fonts, and styles to match your presentation or report’s theme. You can easily align the charts with your corporate branding or personal preferences for a cohesive look.
Why You’ll Love the Chart Templates in Excel
✅ Save Time on Chart Creation
Eliminate the need to manually create charts from scratch. These ready-made templates help you save time by instantly generating professional charts from your data.
✅ Clear and Engaging Data Visualization
Create clear, easy-to-understand charts that effectively communicate trends, comparisons, and performance data to your audience.
✅ Customizable to Your Needs
Adapt the templates to fit your specific data visualization needs. Whether you need to track financial data, project progress, or sales performance, these templates allow you to personalize your charts to suit your goals.
✅ Boost Your Presentations & Reports
Elevate your reports and presentations with polished, professional charts that are visually appealing and informative. The templates help you present data in a way that grabs attention and drives understanding.
✅ Perfect for Business & Personal Use
These chart templates are designed for a variety of uses, from corporate presentations to personal projects. Whether you’re managing finances, tracking health metrics, or visualizing sales data, these templates help you make sense of your numbers.
What’s Inside the Chart Templates in Excel?
- Bar Charts, Line Graphs, and Pie Charts: A variety of chart styles to suit your data visualization needs.
- Scatter Plots & More: Templates for different types of data comparisons.
- Dynamic, Real-Time Updates: Charts that automatically adjust when new data is entered.
- Fully Customizable Design: Tailor the colors, fonts, and layout to fit your style or brand.
- User-Friendly Interface: Simply input your data, and the chart will update automatically.
- Professional, Clean Designs: Visually appealing charts that enhance presentations and reports.
How to Use the Chart Templates in Excel
1️⃣ Download the Templates: Instantly access a variety of Excel chart templates.
2️⃣ Input Your Data: Enter your data into the template fields, and the charts will automatically update.
3️⃣ Customize the Design: Adjust the colors, labels, and layout to fit your preferences.
4️⃣ Visualize & Present Your Data: Use the charts in your reports, presentations, or dashboards to communicate key insights.
Who Can Benefit from the Chart Templates in Excel?
🔹 Business Owners & Entrepreneurs
🔹 Marketing & Sales Teams
🔹 Financial Analysts & Accountants
🔹 Project Managers & Data Analysts
🔹 Anyone Who Needs to Visualize Data in a Professional Manner
🔹 Students & Researchers Presenting Data Insights
Simplify your data visualization and presentation process with the Chart Templates in Excel. Easily create stunning charts, track key metrics, and make data-driven decisions with these powerful and customizable templates.
Click here to read the Detailed blog post
Visit our YouTube channel to learn step-by-step video tutorials
Youtube.com/@PKAnExcelExpert


Reviews
There are no reviews yet.