In today’s Chamber of Commerce KPI Dashboard environment, Chambers of Commerce must continuously monitor their organizational performance to ensure sustainable growth, strong member engagement, and successful business initiatives. Chambers typically manage several operational areas such as membership programs, business events, sponsorship activities, financial performance, and community engagement. Because of this complexity, tracking key performance indicators (KPIs) manually can quickly become difficult and time-consuming.
When organizations rely on spreadsheets and manual reports, leadership teams often struggle to gain clear insights into their operational performance. Important questions such as membership growth trends, event participation rates, financial performance, and operational efficiency become difficult to answer quickly.
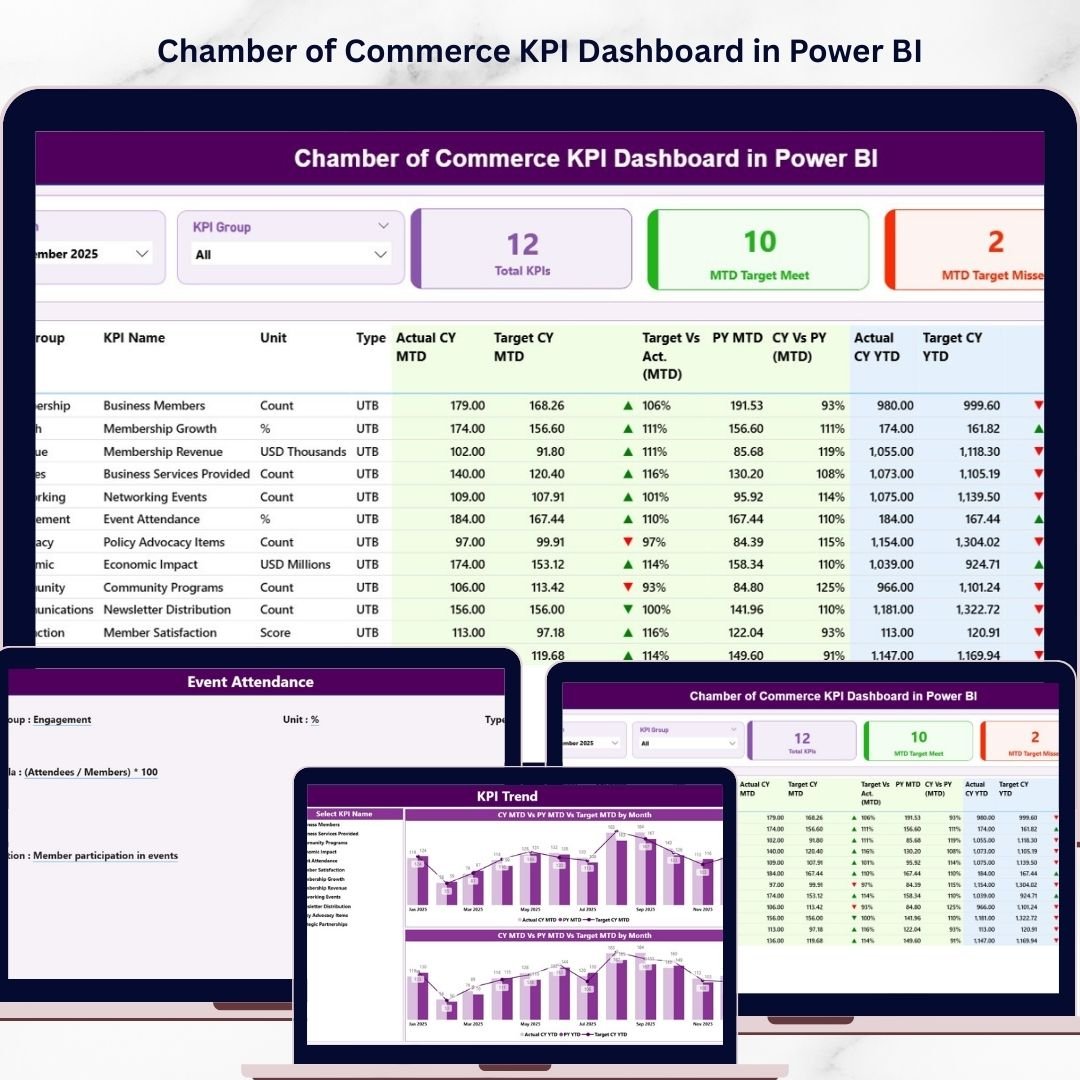
This is where the Chamber of Commerce KPI Dashboard in Power BI provides a powerful solution.
The Chamber of Commerce KPI Dashboard in Power BI is a ready-to-use interactive analytics dashboard designed to help chamber management teams monitor, analyze, and improve key performance indicators. Using Microsoft Power BI’s advanced data visualization capabilities, this dashboard converts raw operational data into meaningful visual insights that support strategic decision-making.
Instead of reviewing multiple reports, chamber leaders can track performance from one centralized dashboard that displays Month-to-Date (MTD), Year-to-Date (YTD), target comparisons, and previous year performance metrics.
Because the dashboard connects with an Excel-based data source, organizations can easily update KPI data while Power BI automatically refreshes charts, KPI indicators, and trend visuals. As a result, leadership teams gain real-time visibility into organizational performance.
The dashboard includes three powerful analytical pages, each designed to analyze a different aspect of chamber operations. With interactive slicers, charts, and drill-through features, users can explore KPI data across departments such as membership, finance, operations, events, and engagement.
Whether your organization focuses on membership development, financial performance, strategic initiatives, or operational efficiency, this Power BI dashboard provides a comprehensive system for monitoring performance.
By transforming complex KPI data into clear visual insights, the dashboard helps chambers improve transparency, enhance accountability, and make faster data-driven decisions.
🚀 Key Feature of Chamber of Commerce KPI Dashboard in Power BI
📊 Interactive KPI Performance Dashboard
Analyze chamber performance using dynamic charts, KPI indicators, and interactive filters.
📅 Dynamic Month Selection
Select any month to instantly analyze KPI performance for that specific period.
📈 MTD & YTD Performance Monitoring
Track both short-term and long-term performance metrics.
🎯 Target vs Actual KPI Tracking
Visual indicators highlight whether KPIs achieve or miss their targets.
📊 Previous Year Comparison
Analyze current performance against historical data to measure organizational growth.
📉 KPI Trend Analysis Charts
Visualize performance trends using interactive charts.
📂 Centralized KPI Monitoring
All performance indicators are consolidated into one dashboard.
📘 Detailed KPI Definition Page
Understand KPI formulas, definitions, and measurement logic.
⚙️ Excel Data Integration
The dashboard connects with an Excel file that stores KPI data.
🚀 Interactive Power BI Visualizations
Charts, slicers, and icons simplify complex KPI analysis.
📊 What’s Inside the Chamber of Commerce KPI Dashboard in Power BI
The dashboard contains three interactive pages designed to provide comprehensive insights into organizational performance.
📌 Summary Page – Main Performance Dashboard
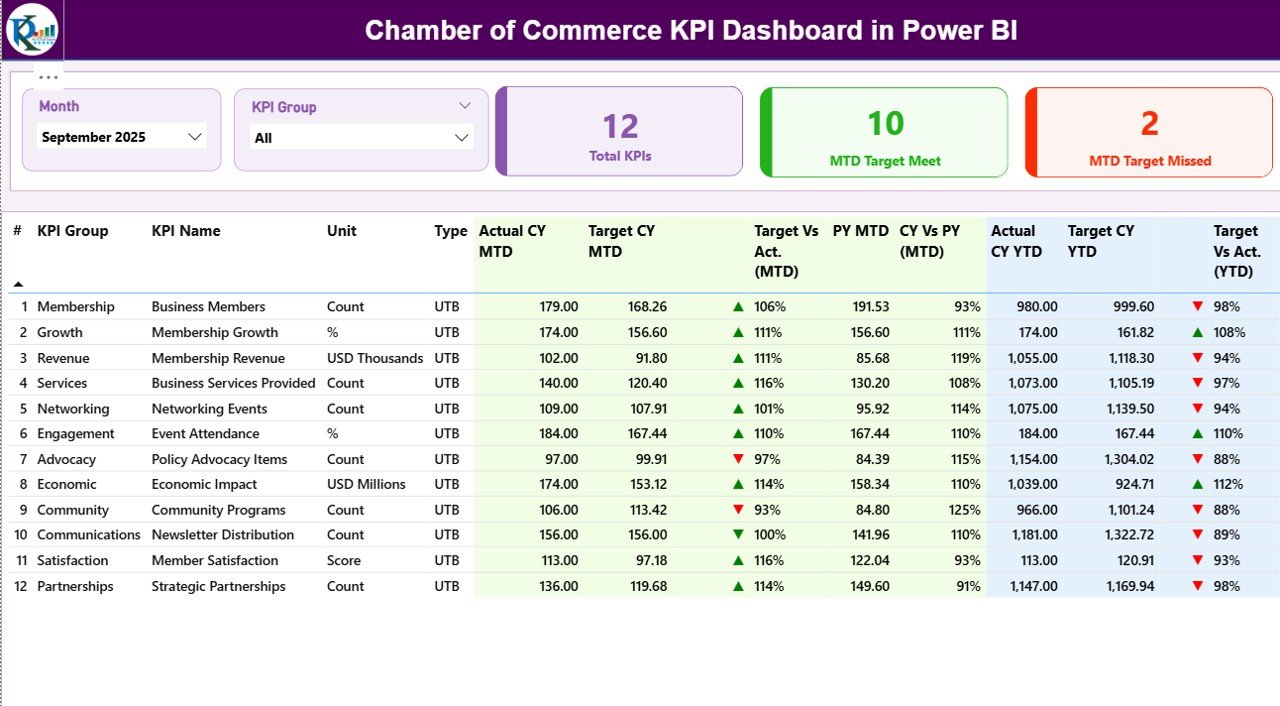
The Summary Page acts as the central control panel of the dashboard.
At the top of the page, users will find two slicers:
• Month Slicer
• KPI Group Slicer
These filters allow users to analyze performance based on specific months or KPI categories.
KPI Performance Cards
The dashboard displays three key KPI indicators:
• Total KPIs Count – Total number of KPIs tracked
• MTD Target Meet Count – KPIs that achieved targets
• MTD Target Missed Count – KPIs that failed to meet targets
These indicators quickly show whether the organization is performing well.
Detailed KPI Performance Table
Below the KPI cards, a detailed table displays important KPI metrics including:
• KPI Number
• KPI Group
• KPI Name
• Unit of Measurement
• KPI Type (LTB or UTB)
The table also includes multiple performance comparisons:
• Actual CY MTD
• Target CY MTD
• Target vs Actual (MTD)
• Previous Year MTD
• Current Year vs Previous Year (MTD)
Similarly, the dashboard also displays YTD metrics to monitor long-term performance.
Visual arrow indicators show whether targets are achieved or missed.
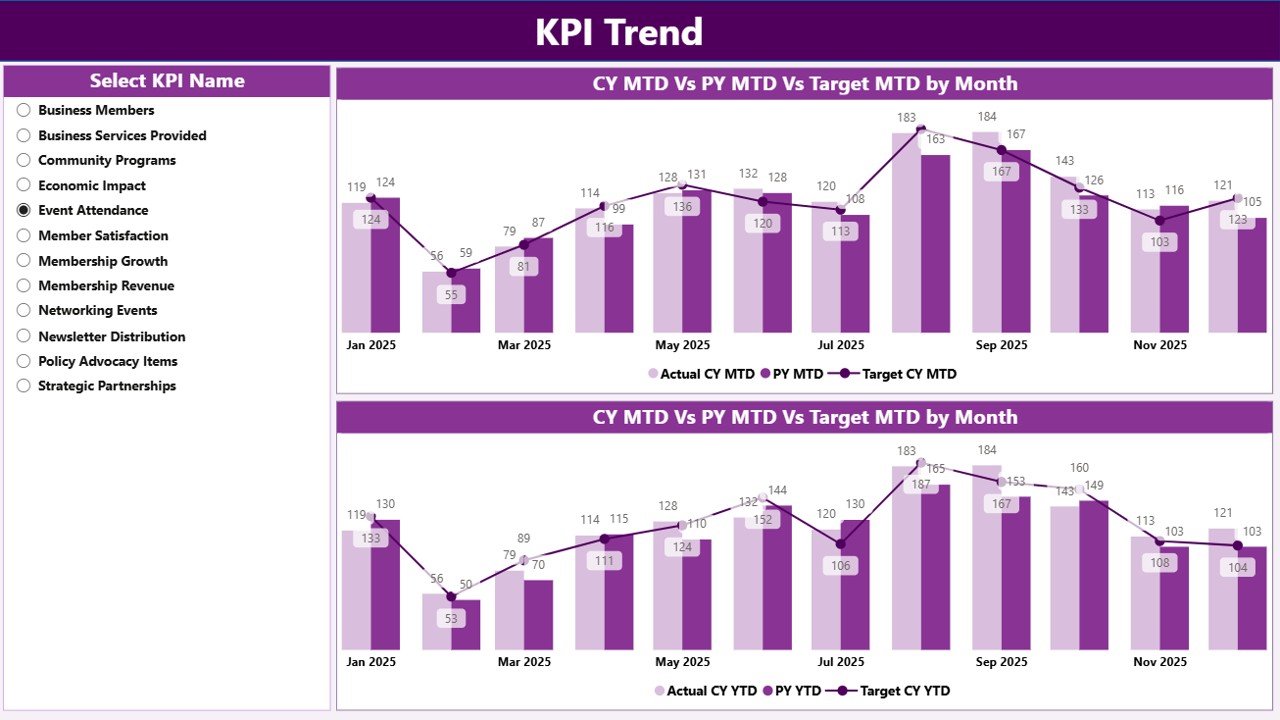
📈 KPI Trend Page – Performance Trend Analysis
While the summary page shows current performance, the KPI Trend Page focuses on historical performance analysis.
This page contains two combo charts that display:
• Current Year Actual values
• Previous Year performance
• Target values
Charts analyze both:
• MTD Trends
• YTD Trends
Users can select a specific KPI using the KPI Name slicer.
This allows leadership teams to analyze performance patterns for individual KPIs such as:
• Membership Growth Rate
• Event Participation Rate
• Sponsorship Revenue
• Member Satisfaction Score
Trend analysis helps organizations identify growth patterns, seasonal trends, and performance gaps.
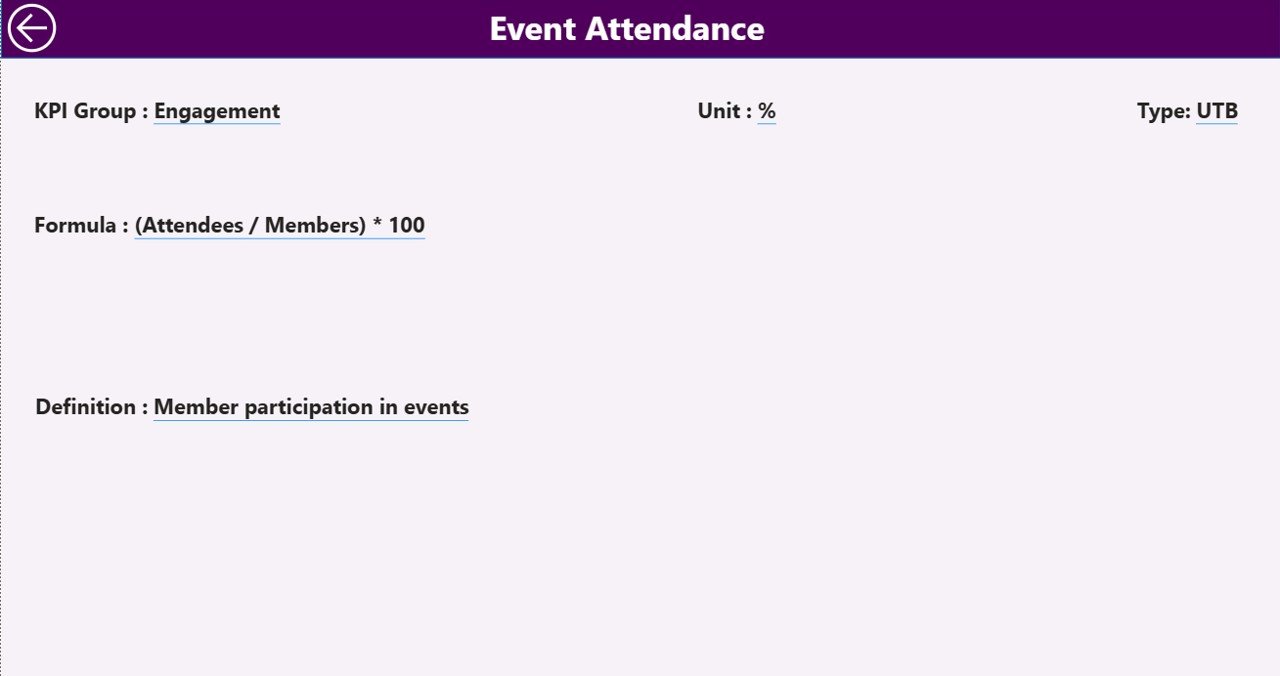
📘 KPI Definition Page – Drill-Through KPI Details
The KPI Definition Page is a drill-through page that provides detailed information about each KPI.
This page contains:
• KPI Formula
• KPI Definition
• KPI Category
• Unit of Measurement
• KPI Type (LTB or UTB)
A Back Button allows users to return to the main dashboard easily.
This page ensures that all stakeholders understand how each KPI is calculated.
⚙️ How to Use the Chamber of Commerce KPI Dashboard in Power BI
Using the dashboard is simple and efficient.
1️⃣ Enter KPI data in the Excel source file.
2️⃣ Ensure that Actual, Target, and KPI Definition sheets are updated.
3️⃣ Refresh Power BI to update visuals.
4️⃣ Use slicers to filter KPI data by month or KPI category.
5️⃣ Analyze performance using charts and trend insights.
Within seconds, organizations can convert raw KPI data into powerful analytics.
👥 Who Can Benefit from This Dashboard
This dashboard is ideal for professionals responsible for managing chamber performance.
🏢 Chamber of Commerce Leadership
📊 Business Development Teams
📈 Membership Managers
💼 Finance & Accounting Teams
👥 Event Management Teams
🎓 Business Analysts & Consultants
Organizations that implement this dashboard gain clear performance visibility, improved accountability, and faster strategic decision-making.
### Click hare to read the Detailed blog post
Visit our YouTube channel to learn step-by-step video tutorials
https://youtube.com/@PKAnExcelExpert


