🏭 Take Full Control of Your Ceramic Manufacturing Operations!
Managing ceramic production is complex. You need to track production quantity, defective units, quality scores, raw material cost, labor cost, and plant performance—all at the same time. When this data is scattered across files, decision-making becomes slow and inefficient.
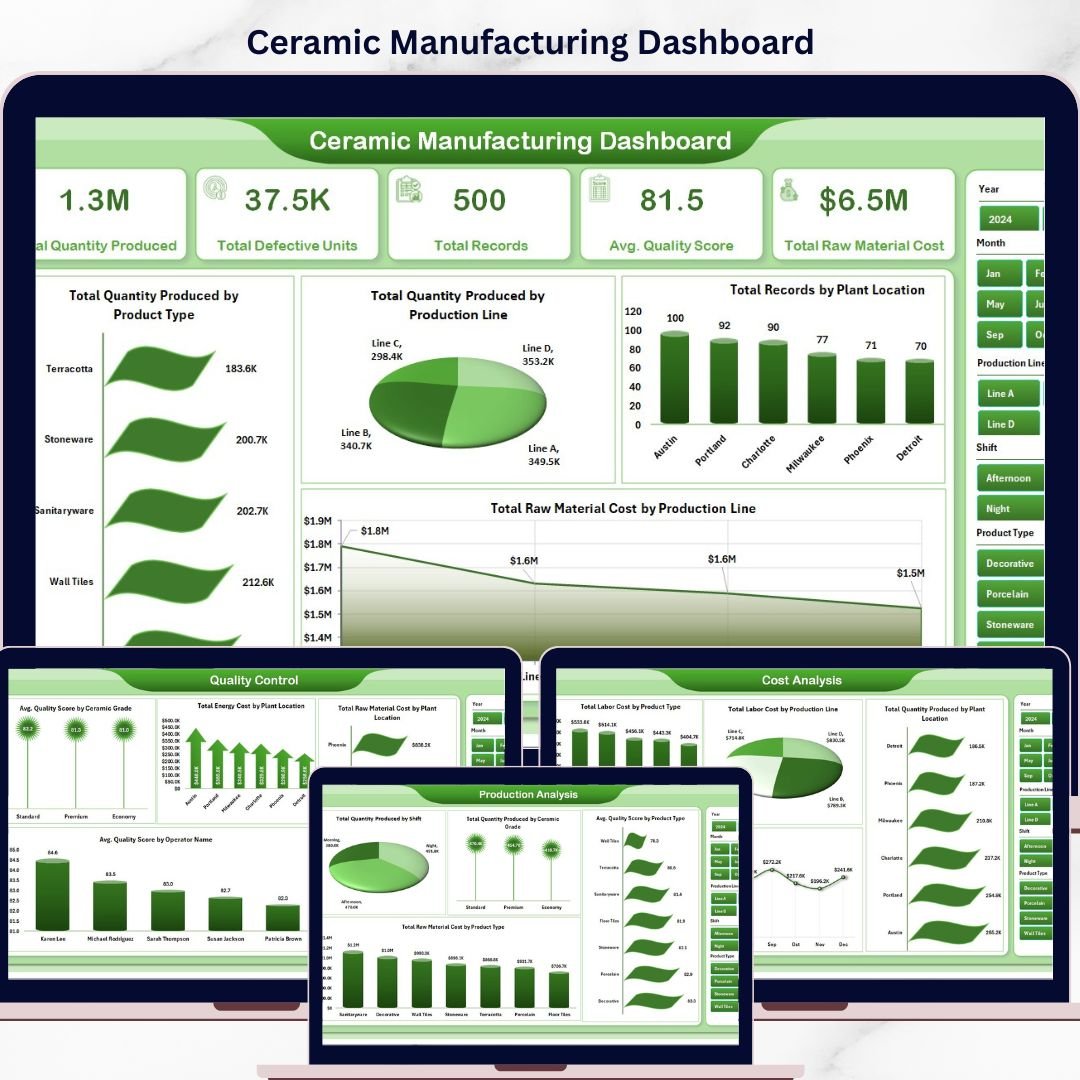
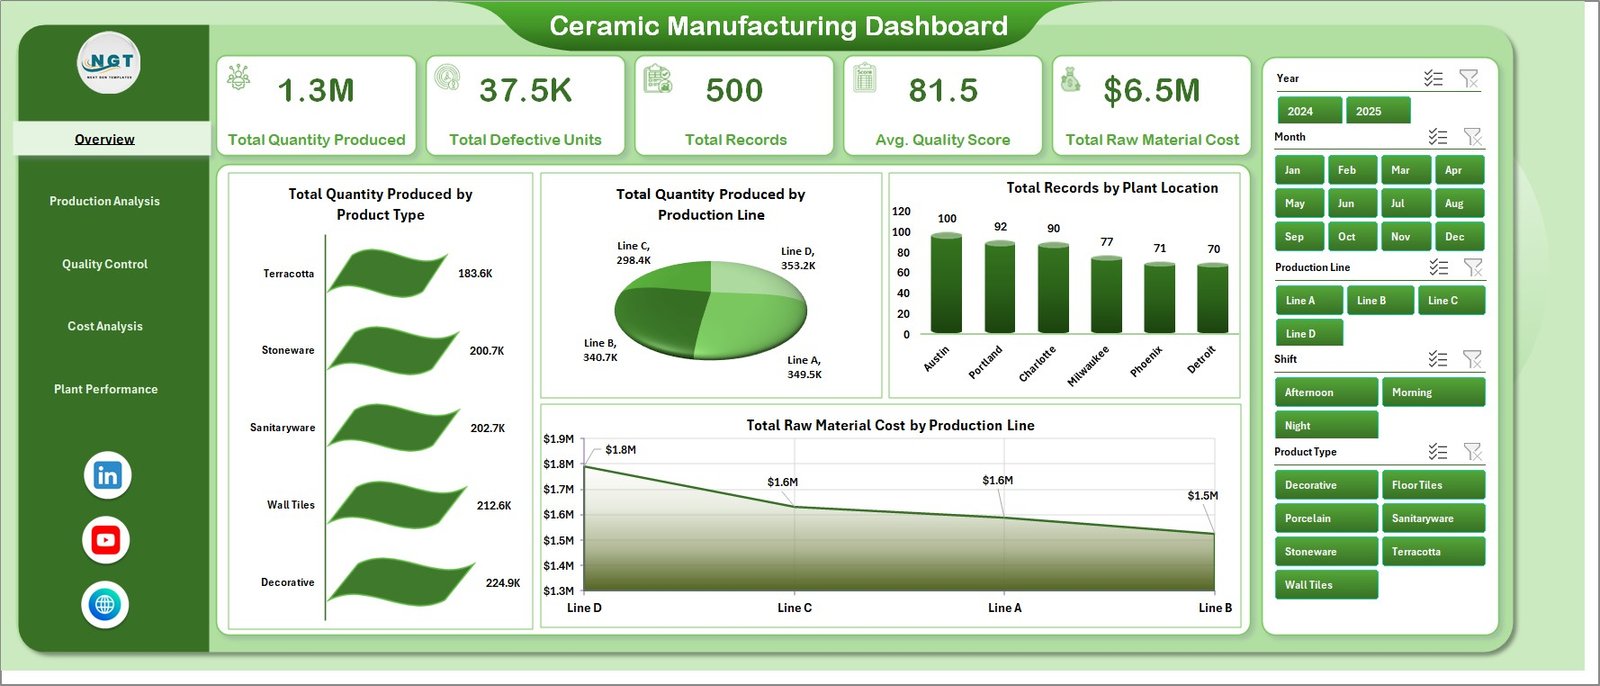
👉 The Ceramic Manufacturing Dashboard in Excel is a powerful, ready-to-use solution that brings all your manufacturing data into one interactive and easy-to-use dashboard.
Designed for plant managers, production teams, and business owners, this dashboard transforms raw data into meaningful insights. With just a simple data update and refresh, you can instantly monitor production performance, quality levels, and cost efficiency.
No more manual reporting. No more confusion. Just clear, actionable insights to improve your manufacturing process.
🔑 Key Features of Ceramic Manufacturing Dashboard in Excel
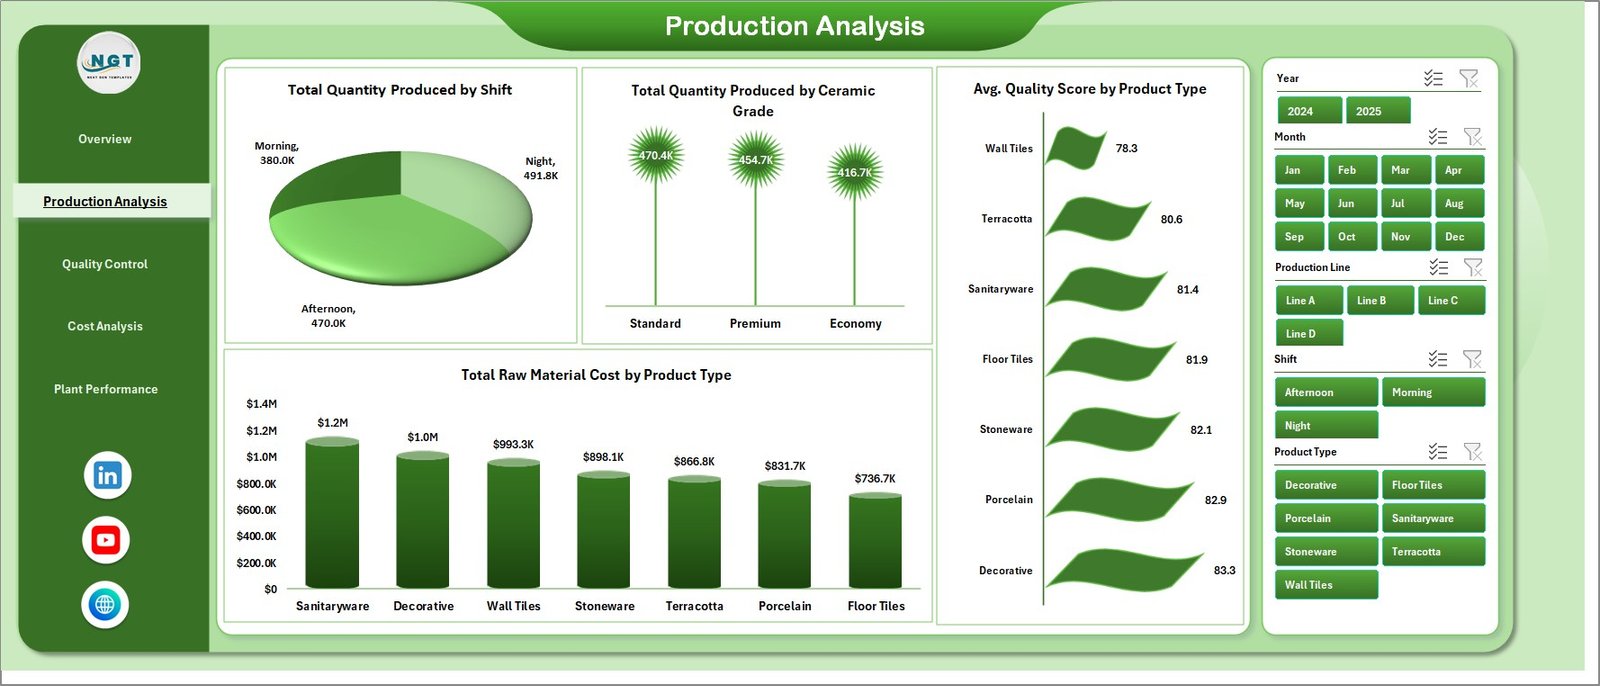
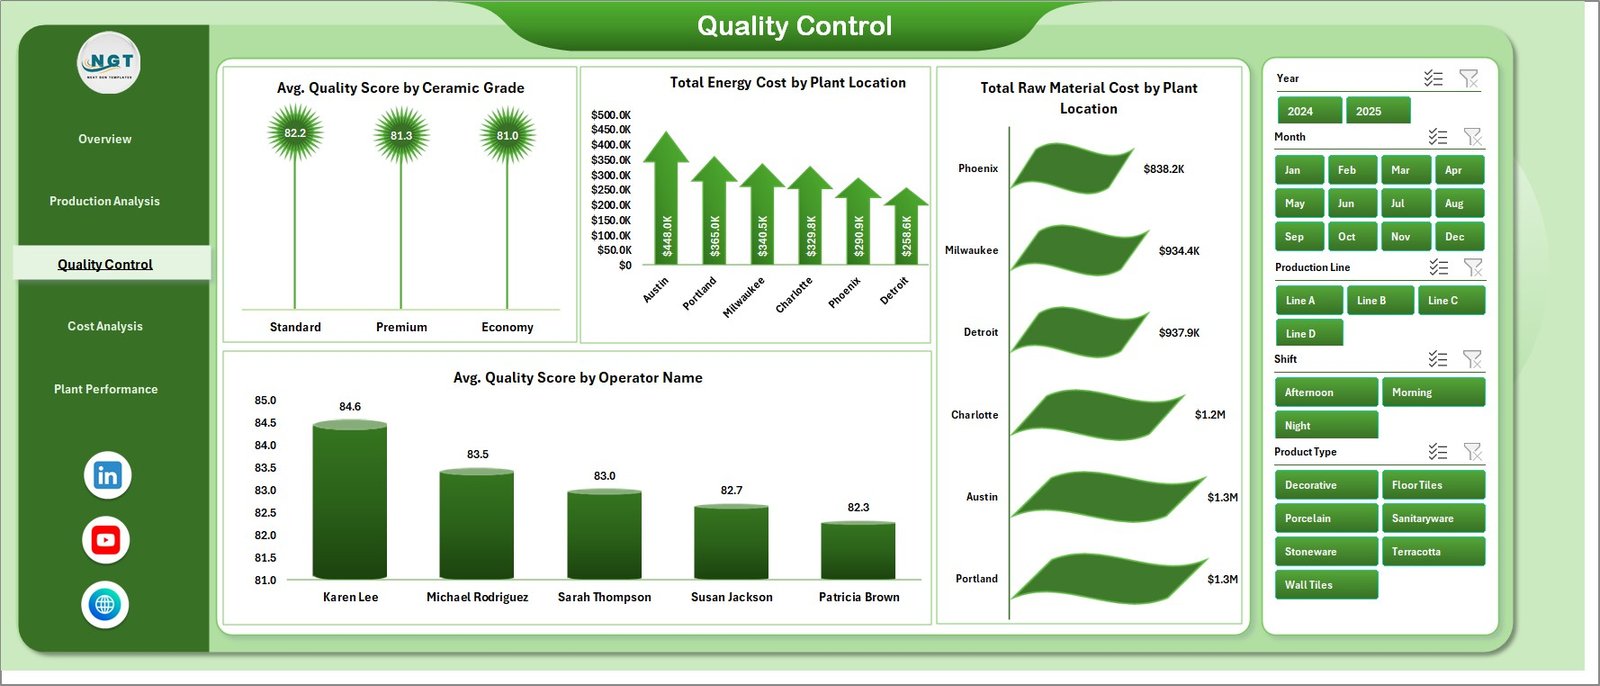
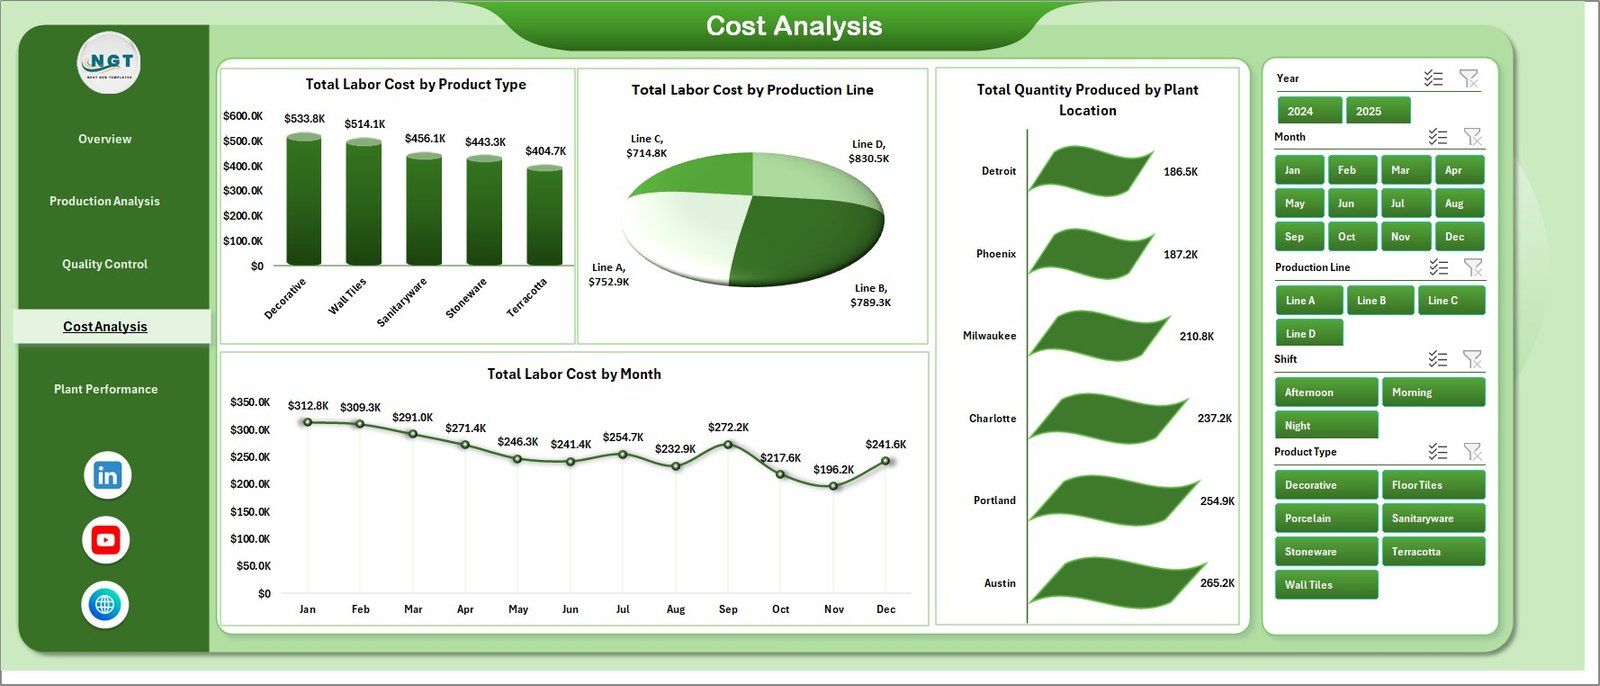
✨ Multi-Page Interactive Dashboard – Analyze data across Overview, Production Analysis, Quality Control, Cost Analysis, and Plant Performance.
📊 Powerful KPI Cards – Track Total Quantity Produced, Defective Units, Quality Score, and Raw Material Cost instantly.
🎯 Smart Slicers & Filters – Filter data by plant, production line, product type, and operator.
📈 Dynamic Charts & Visuals – Understand trends, performance, and cost distribution through interactive charts.
⚡ One-Click Data Refresh – Update your data and refresh the dashboard instantly.
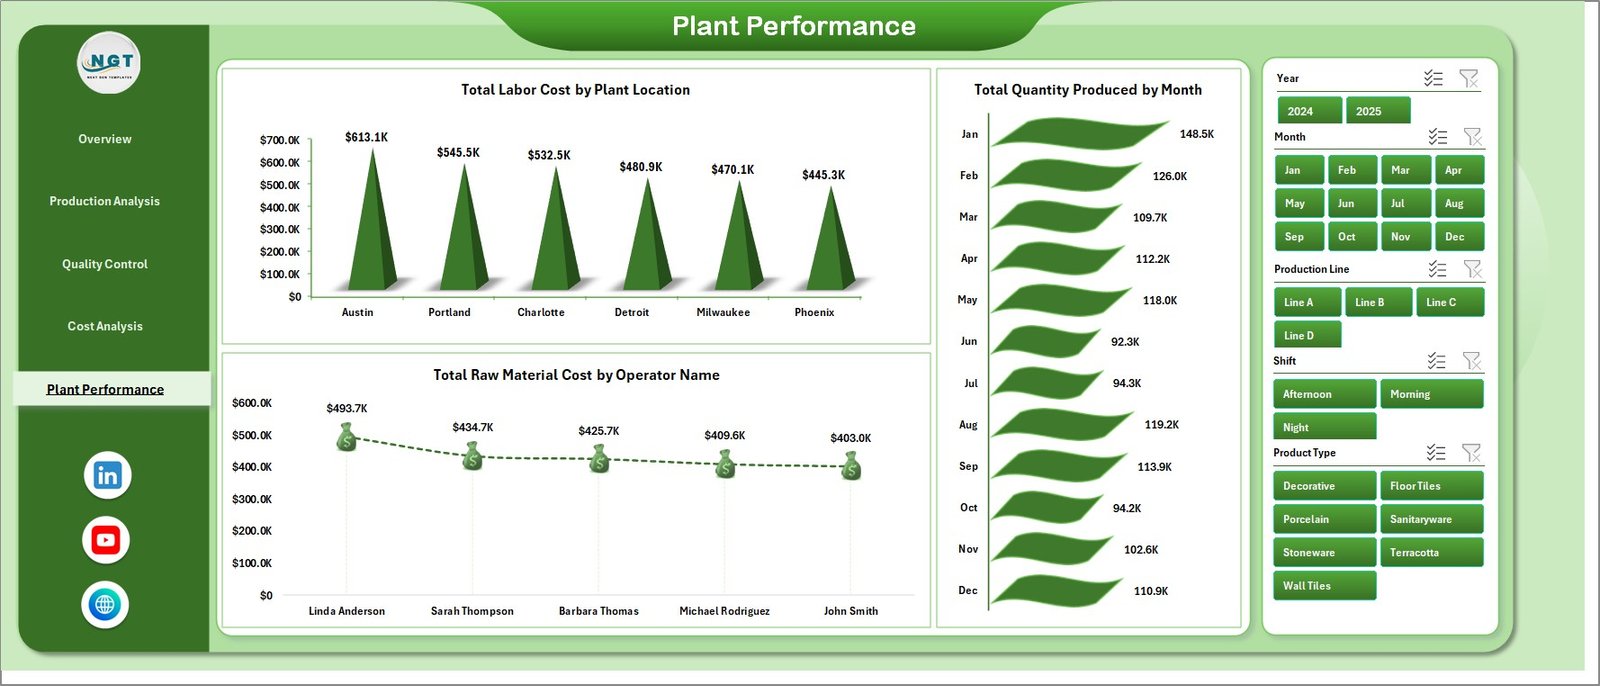
🏭 Plant-Level Performance Tracking – Compare production and cost across multiple plant locations.
👨🏭 Operator Performance Insights – Identify top-performing operators and areas needing improvement.
📅 Monthly Trend Analysis – Monitor production and cost trends over time for better planning.
📦 What’s Inside the Ceramic Manufacturing Dashboard in Excel
📁 7 Structured Dashboard Components
- Overview Dashboard
- Production Analysis
- Quality Control
- Cost Analysis
- Plant Performance
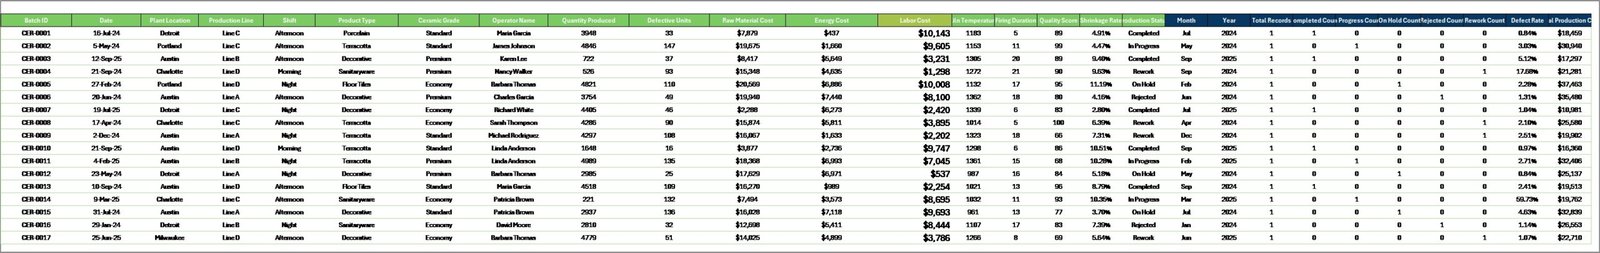
- Data Sheet Tab
- Support Sheet
📊 Pre-Built KPI Metrics & Charts
- Total Production Quantity
- Defective Units & Quality Score
- Raw Material, Labor, and Energy Costs
- Production by Shift, Grade, and Product Type
- Monthly Cost & Output Trends
🎛️ Interactive Slicers & Filters
- Filter by Plant Location
- Filter by Production Line
- Filter by Product Type
- Filter by Operator Name
📂 Data & Support Sheets Included
- Easy data input structure
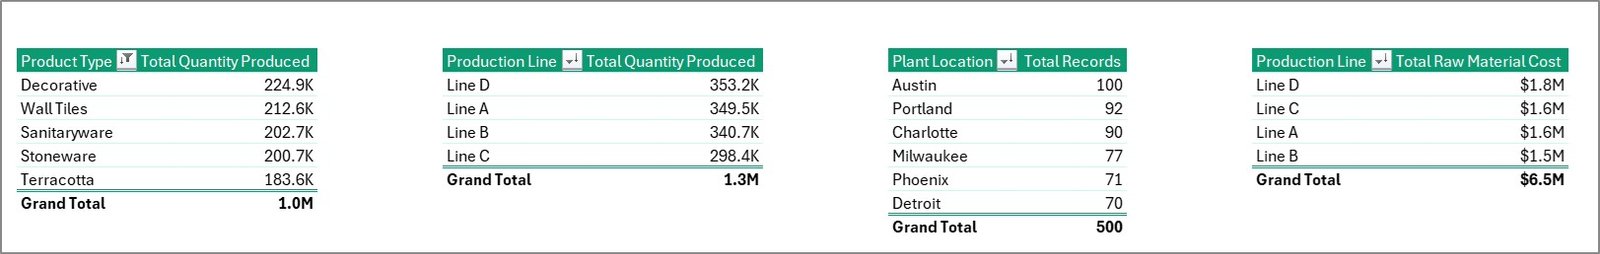
- Pivot-based automation
- Fast and dynamic updates
⚙️ How to Use the Ceramic Manufacturing Dashboard in Excel
1️⃣ Open the Excel dashboard file
2️⃣ Enter or update your data in the Data Sheet tab
3️⃣ Click Refresh All from the Data tab
4️⃣ Use slicers to filter and explore insights
5️⃣ Analyze KPIs and charts to make better decisions
💡 No advanced Excel skills required—this dashboard is built for simplicity and efficiency.
👥 Who Can Benefit from This Ceramic Manufacturing Dashboard in Excel
🏭 Plant Managers – Monitor production, cost, and plant performance
👨🏭 Production Supervisors – Analyze shifts, lines, and product output
🔍 Quality Control Teams – Track defects and quality scores
📊 Cost Analysts – Study raw material, labor, and energy costs
💼 Business Owners – Get a complete overview of manufacturing operations
This dashboard helps you move from manual reporting to smart, data-driven decision-making. As a result, you can improve production efficiency, reduce costs, and maintain high-quality standards.
Instead of spending hours analyzing spreadsheets, you can now get instant insights and take faster action—making your manufacturing process more efficient and profitable.
📖 Click here to read the Detailed blog post
🎥 Visit our YouTube channel to learn step-by-step video tutorials
👉 https://youtube.com/@PKAnExcelExpert


