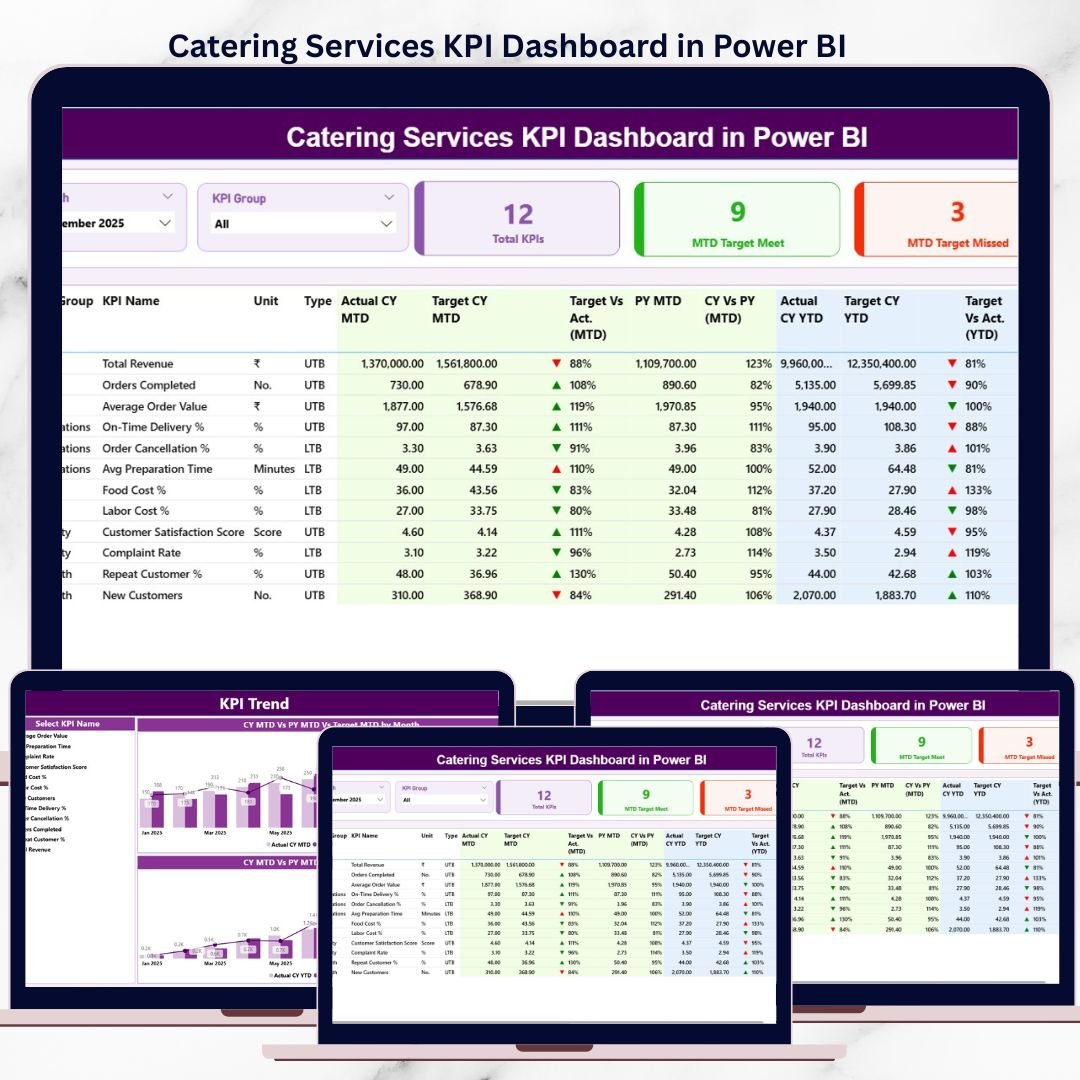
Running a catering services business is not just about delivering great food. It is about controlling costs, meeting tight timelines, maintaining quality, satisfying clients, and tracking performance every single day. When critical data is scattered across Excel files and manual reports, decision-making becomes slow and risky. That is why the Catering Services KPI Dashboard in Power BI is an essential performance management solution.
This ready-to-use Power BI dashboard transforms raw catering data into clear, interactive, and actionable insights. Instead of guessing what is working or failing, catering owners and managers get instant visibility into KPIs, targets, and trends. As a result, you can act faster, reduce inefficiencies, and improve profitability with confidence.
Built for real-world catering operations, this dashboard uses Excel as a data source and Power BI for analytics. You simply update your Excel input sheets, refresh the dashboard, and instantly see updated performance across all KPIs.
🚀 Key Features of Catering Services KPI Dashboard in Power BI
📊 Centralized KPI Monitoring
Track all catering KPIs—cost, efficiency, performance, and growth—on a single interactive dashboard.
🎯 MTD & YTD Target Tracking
Compare actual performance with MTD and YTD targets to stay aligned with business goals.
📈 Previous Year Comparison
Analyze current performance against last year to understand growth and seasonal trends.
⬆️⬇️ Visual Performance Indicators
Red ▼ and green ▲ icons instantly highlight whether KPIs are meeting targets.
🧩 KPI Group & Month Slicers
Filter performance by KPI group and month for focused analysis.
📉 Detailed KPI Trend Analysis
Understand performance patterns using MTD and YTD trend charts.
🧠 Clear KPI Documentation
Built-in KPI Definition page ensures clarity on formulas, logic, and KPI intent.
📂 What’s Inside the Catering Services KPI Dashboard in Power BI
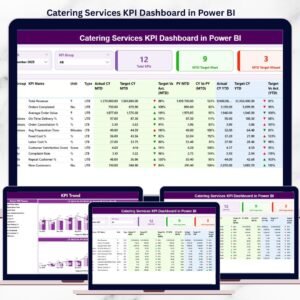
This professionally designed dashboard includes three powerful analytical pages, supported by a structured Excel data source.
📌 Summary Page
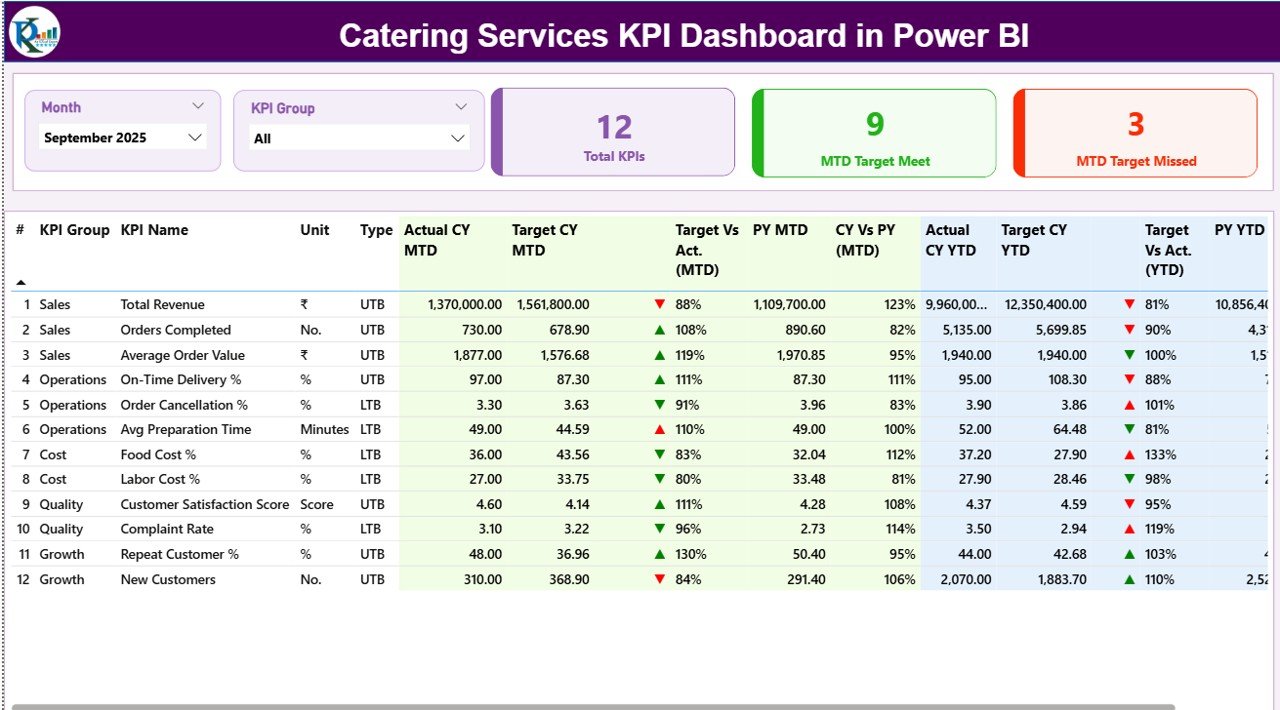
• Month slicer and KPI Group slicer
• KPI Cards showing:
– Total KPIs Count
– MTD Target Met Count
– MTD Target Missed Count
• Detailed KPI table with:
– KPI Number, Group, Name, Unit, Type (UTB / LTB)
– MTD Actual, Target, Target vs Actual %, PY MTD, CY vs PY %
– YTD Actual, Target, Target vs Actual %, PY YTD, CY vs PY %
• Visual arrows for instant performance signals
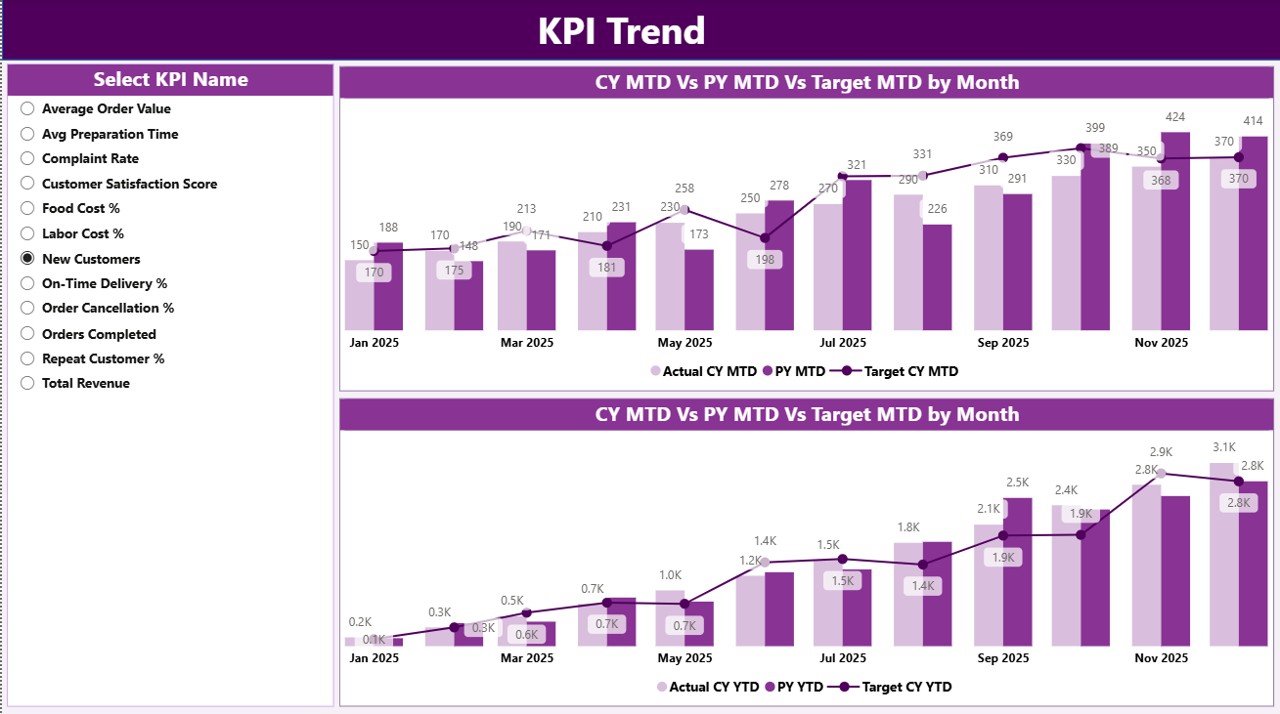
📈 KPI Trend Page
• KPI Name slicer for individual KPI analysis
• Two combo charts showing:
– Actual (Current Year)
– Actual (Previous Year)
– Target values
• Separate MTD and YTD trend views
• Ideal for identifying growth, decline, and seasonality
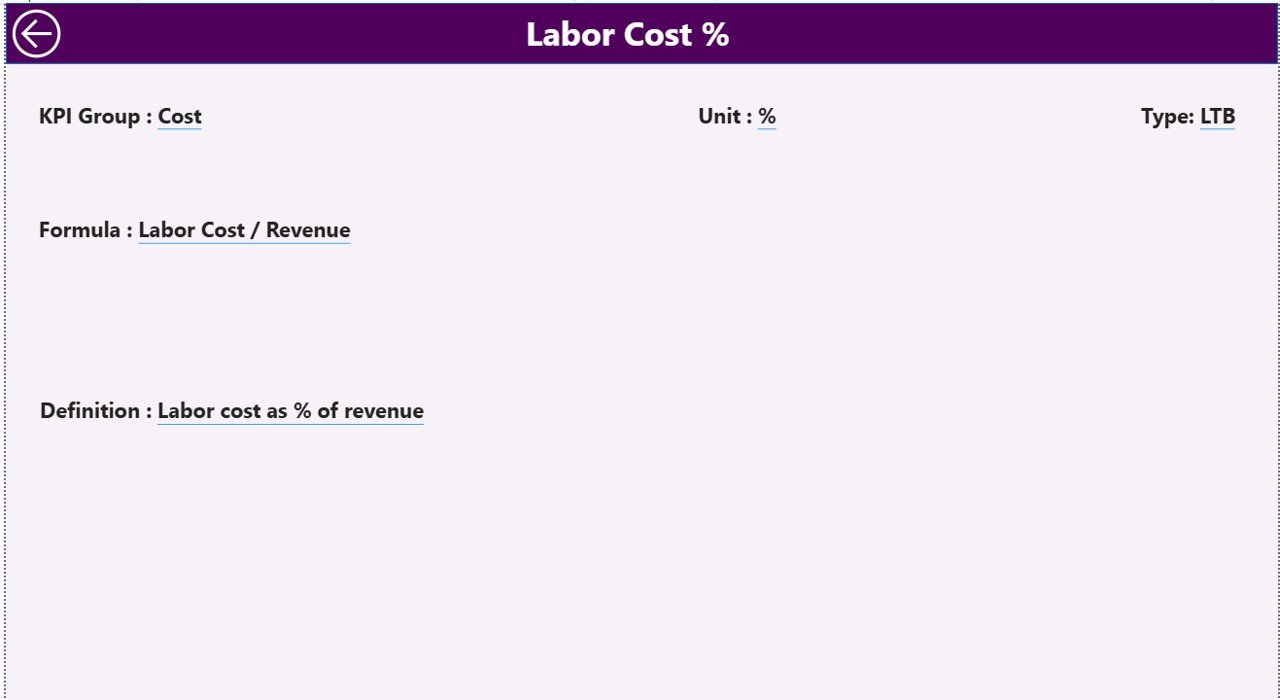
📘 KPI Definition Page
• Drill-through reference page
• Displays KPI Formula, Definition, and Type
• Back button for easy navigation
• Ensures consistent KPI understanding across teams
🛠️ How to Use the Catering Services KPI Dashboard in Power BI
1️⃣ Enter actual performance data in the Input_Actual Excel sheet
2️⃣ Define monthly and YTD targets in the Input_Target sheet
3️⃣ Maintain KPI structure in the KPI Definition sheet
4️⃣ Refresh the Power BI dashboard
5️⃣ Use slicers to analyze KPIs by month or KPI group
6️⃣ Review MTD, YTD, and trend insights to take action
No advanced Power BI skills are required. If you can update Excel, you can use this dashboard easily.
👥 Who Can Benefit from This Catering Services KPI Dashboard
🍽️ Catering Business Owners
📋 Operations & Service Managers
💰 Finance & Cost Control Teams
📊 Business Analysts
🎉 Event Catering Companies
🏢 Corporate Catering Service Providers
This dashboard scales smoothly for small, medium, and large catering operations.
🔗 Click here to read the Detailed blog post
▶️ Visit our YouTube channel to learn step-by-step video tutorials
👉
Visit our YouTube channel to learn step-by-step video tutorials


Reviews
There are no reviews yet.