

Key Features of Carbon Capture Firms Dashboard
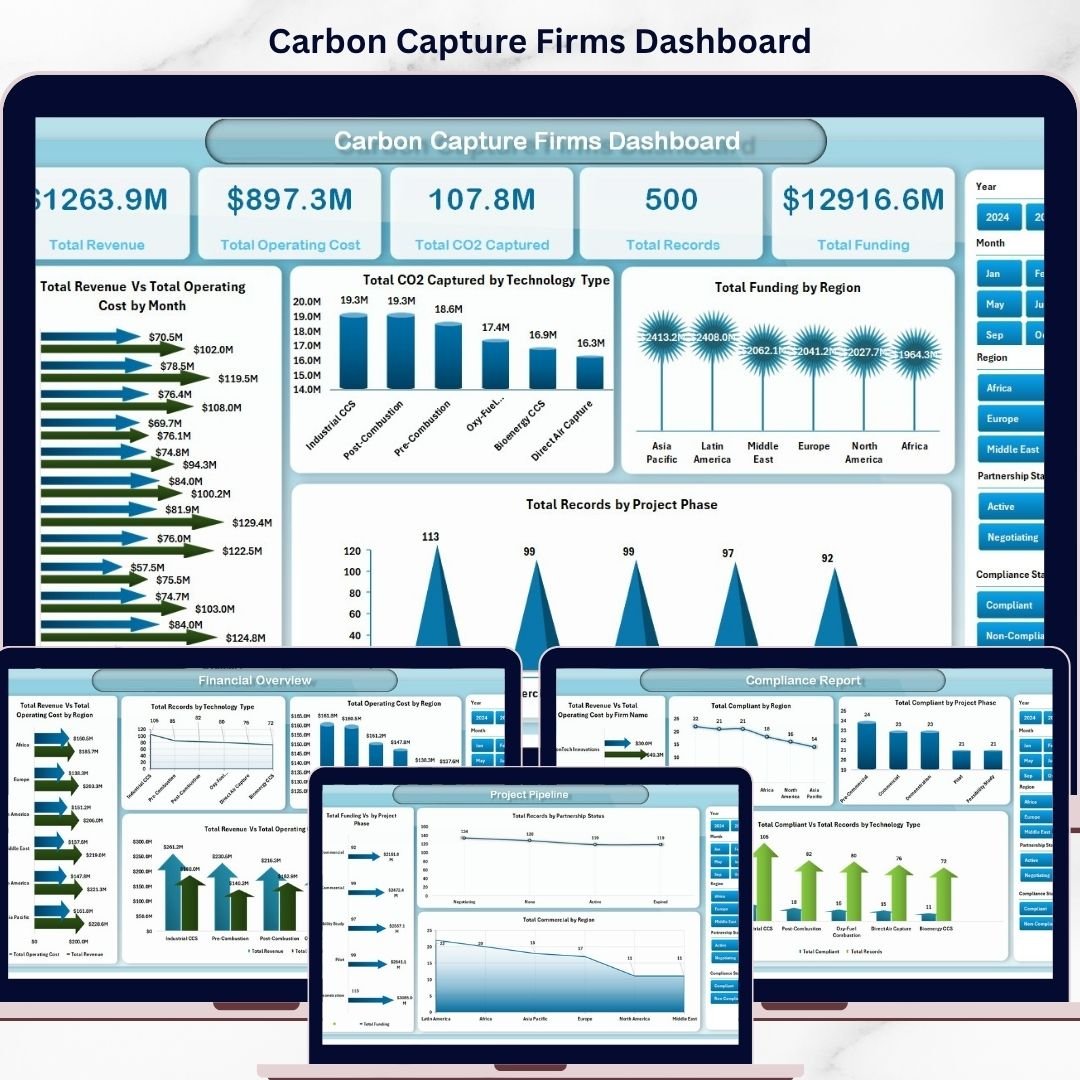
Unlock powerful insights with the Carbon Capture Firms Dashboard, a ready-to-use Excel dashboard designed specifically for carbon capture companies and analysts. Simply update your data in the provided Data Sheet, hit refresh from the Excel Ribbon’s Data tab, and watch your entire dashboard dynamically update with accurate, real-time visuals. This dashboard offers multiple page views, making it easy to analyze key metrics and trends at a glance.
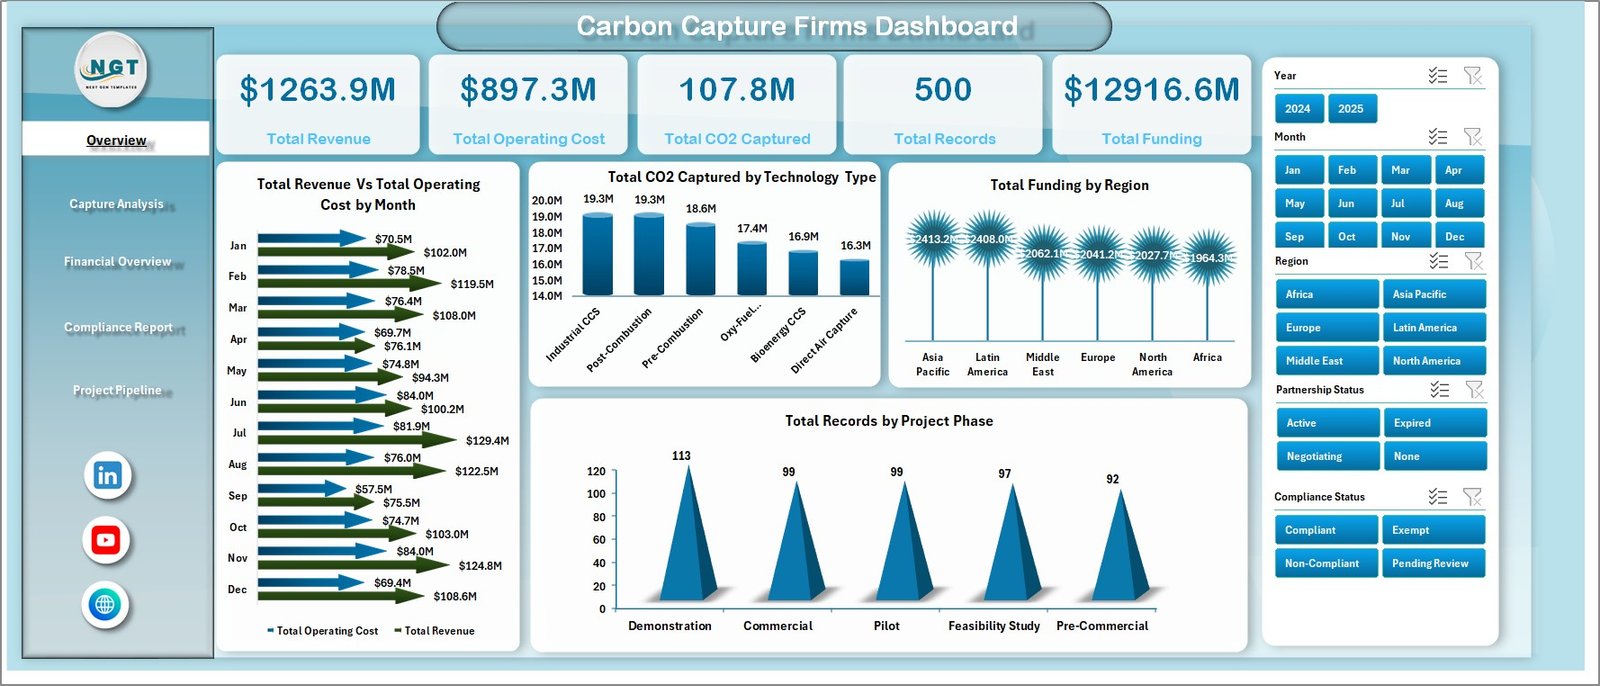
- 📊 Overview Page: High-level cards display Total Revenue, Total Operating Cost, Total CO2 Captured, Total Records, and Total Funding Raised. Interactive charts illustrate Revenue and Operating Cost by Month, CO2 Captured by Technology Type, Total Funding by Region, and Records by Project Phase with multiple slicers for quick filtering.
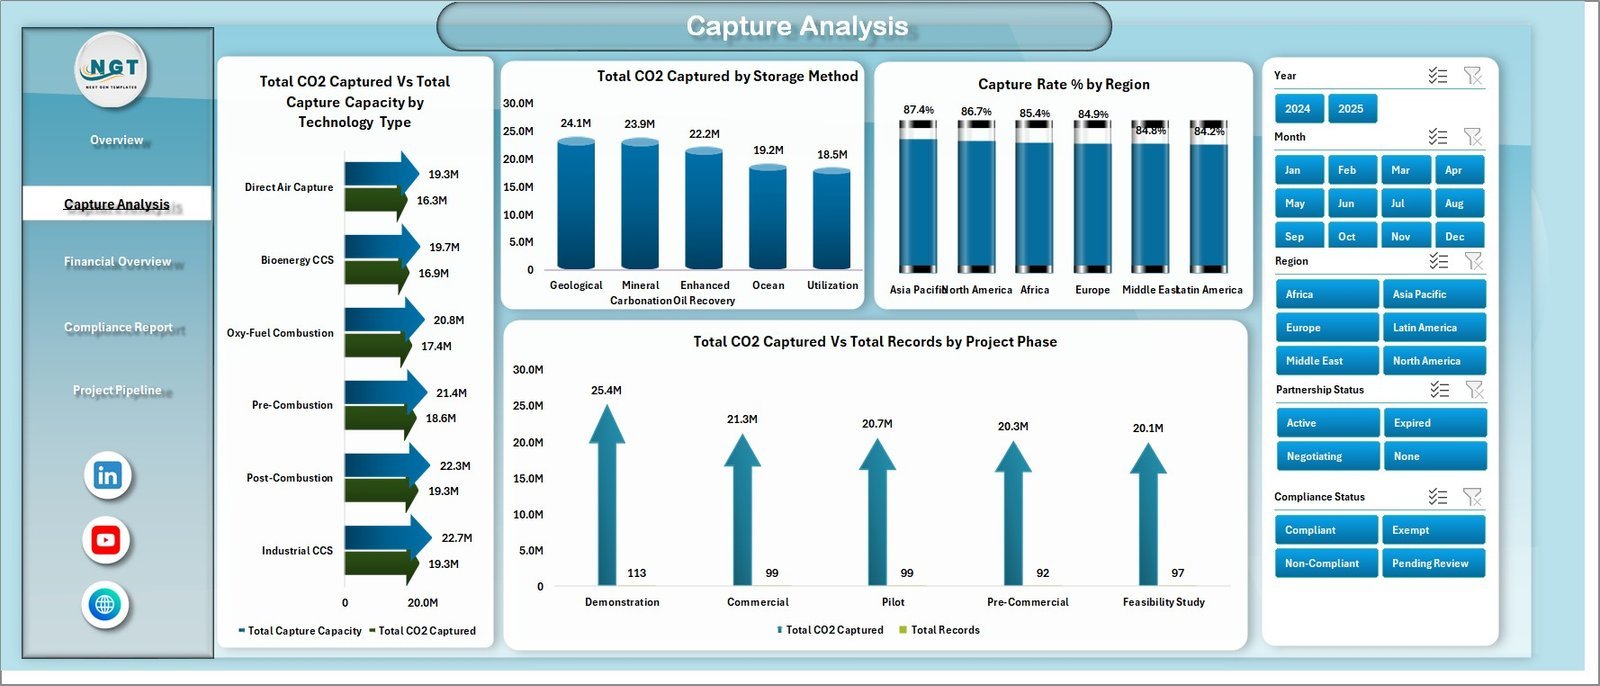
- 🔍 Capture Analysis: Dive deep into CO2 capture data with analysis on CO2 Captured and Capture Capacity by Technology, CO2 Captured by Storage Method, Capture Rate % by Region, and CO2 Captured by Project Phase, enabling strategic decision-making.
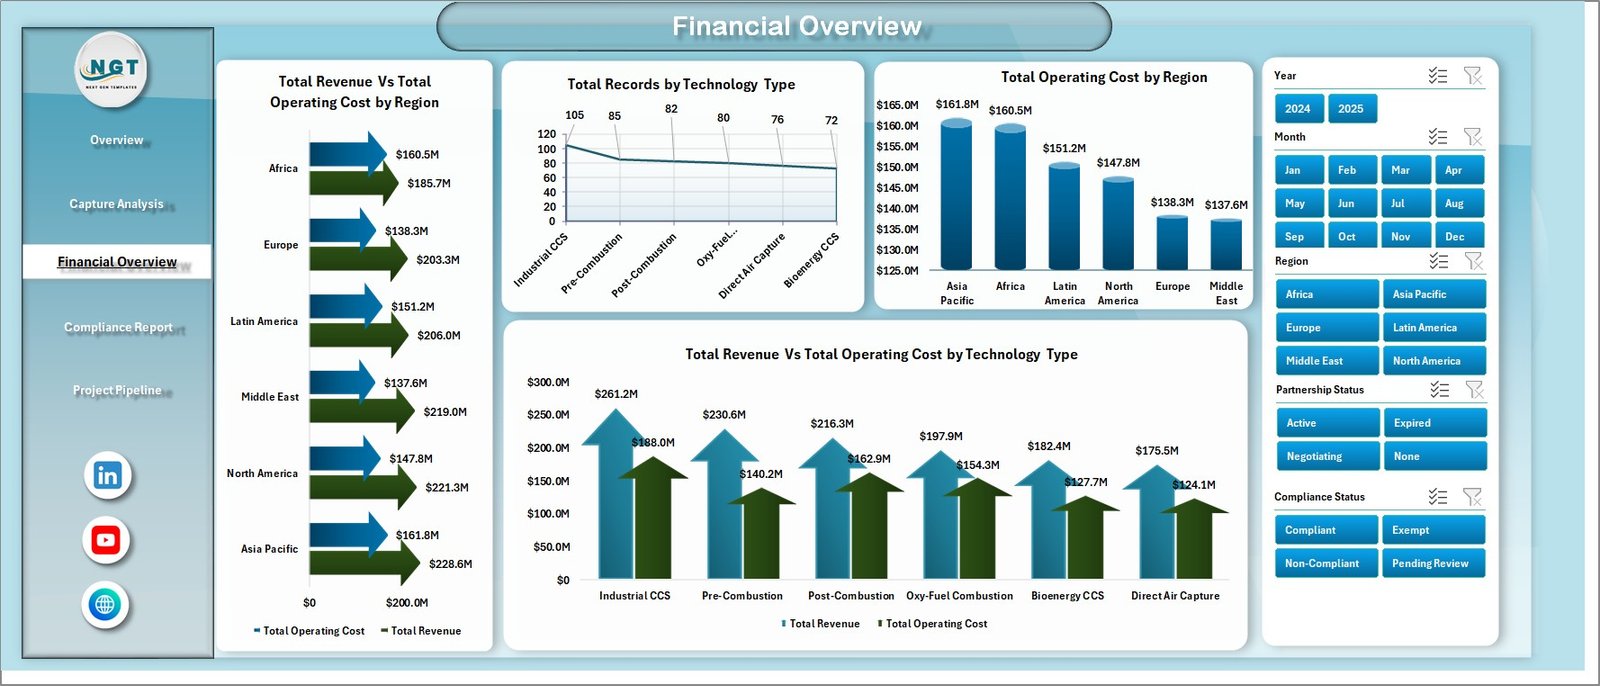
- 💰 Financial Overview: Evaluate finances with charts showing Revenue and Operating Cost by Region and Technology Type, Operating Cost by Region, and Records by Technology Type to identify cost drivers and revenue hotspots.
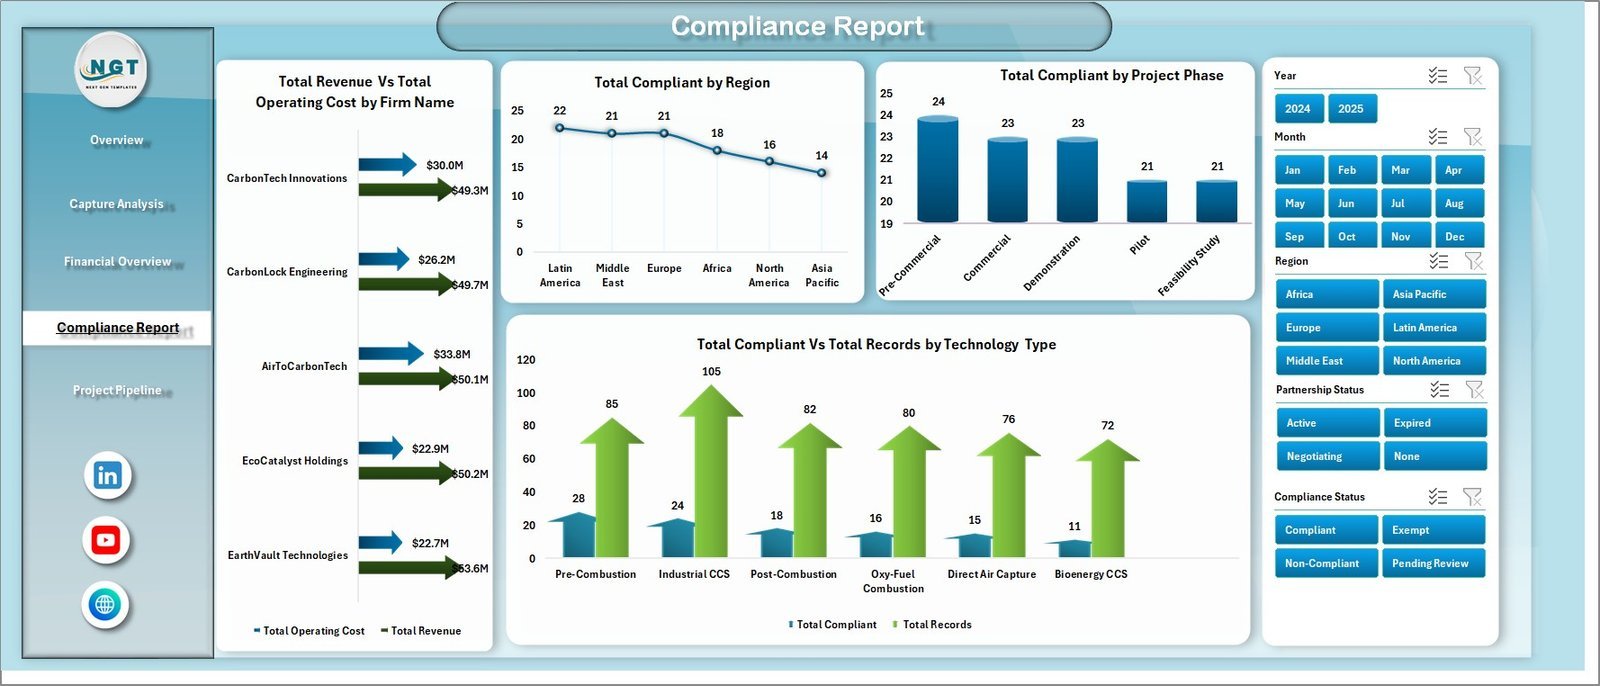
- ✅ Compliance Report: Track compliance effectively with Total Compliant by Region, Technology Type, Project Phase, and Revenue vs Operating Cost by Firm Name, helping ensure regulatory adherence.
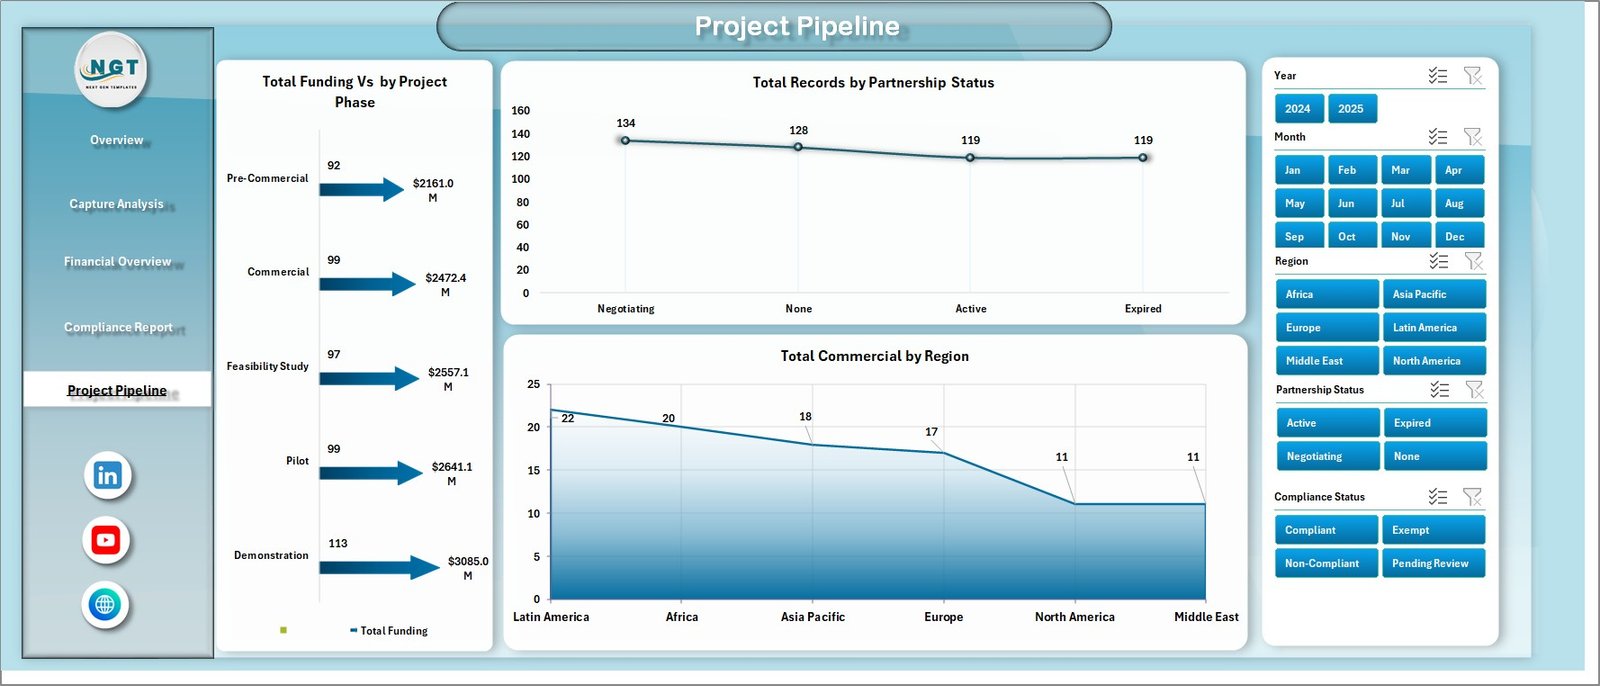
- 🚀 Project Pipeline: Monitor project progress through Total Funding by Project Phase, Records by Partnership Status, and Commercial Status by Region, enabling efficient pipeline management.
- 📈 Data Sheet Tab: Easily update raw data in a structured format for seamless dashboard refresh.
- ⚙️ Support Sheet: Contains pivot tables powering the dashboard’s dynamic features. Simply refresh pivots after data updates to keep visuals current.
What’s Inside the Carbon Capture Firms Dashboard
This comprehensive Excel dashboard includes multiple worksheet tabs strategically designed for detailed insight:
- Overview Page: High-level metrics with interactive charts and slicers for fast filtering.
- Capture Analysis: Detailed capture metrics by technology, storage, region, and project phase.
- Financial Overview: Regional and technology-specific revenue and cost breakdowns.
- Compliance Report: Compliance tracking by region, technology, project phase, and firm.
- Project Pipeline: Visual tracking of funding, partnership, and commercial status.
- Data Sheet: Clean, organized data input area for effortless updates.
- Support Sheet: Behind-the-scenes pivot tables powering your dashboard’s dynamic interactivity.
Each tab is expertly crafted with interactive charts, slicers, and cards, enabling you to explore data from multiple angles and make data-driven decisions quickly.
How to Use the Carbon Capture Firms Dashboard
Using the Carbon Capture Firms Dashboard is intuitive and efficient:
-
- 📂 Step 1: Enter or update your raw data in the Data Sheet Tab ensuring all fields are correctly formatted.
- 🔄 Step 2: Go to the Data tab in the Excel Ribbon and click Refresh All. This refreshes all pivot tables and charts across the workbook.
- 🎯 Step 3: Navigate through the various dashboard pages-Overview, Capture Analysis, Financial Overview, Compliance Report, and Project Pipeline-to analyze your updated data visually.
- ⚙️ Step 4: Use slicers and filters on each page to drill down into specific regions, technologies, project phases, or time periods for customized views.
- 🔒 Step 5: Keep the Support Sheet hidden to protect pivot tables and ensure dashboard integrity.
Repeat these steps anytime you need to update your data and generate new insights effortlessly.
Who Can Benefit from This Carbon Capture Firms Dashboard
This dashboard is a game-changer for various stakeholders in the carbon capture ecosystem:
- 🌍 Carbon Capture Firms: Track operational KPIs, financial performance, and compliance easily to optimize strategies.
- 📊 Data Analysts & Researchers: Analyze technology efficiency, regional performance, and project pipelines with rich visuals.
- 🏢 Investors & Funding Agencies: Assess funding allocations, project phases, and ROI for informed investment decisions.
- 🛠️ Project Managers: Monitor project progress, partnership status, and commercial viability at a glance.
- ⚖️ Compliance Officers: Ensure regulatory adherence by tracking compliance metrics across regions and technologies.
- 🌱 Environmental Consultants: Use data-driven insights to recommend improvements and sustainability measures.
Whether you’re a seasoned professional or new to carbon capture analytics, this dashboard is designed for ease of use, accuracy, and comprehensive insights.
Carbon Capture Firms Dashboard

Capture Analysis
Financial Overview

Compliance Report
Project Pipeline

Data Sheet tab

Support sheet tab
Click here to read the Detailed blog post.
Visit our YouTube channel to learn step-by-step video tutorials.


Reviews
There are no reviews yet.