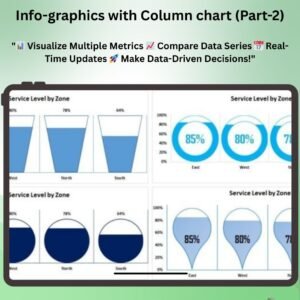
The Candle info-graphics chart in Excel is an innovative and visually striking chart template that allows you to present your data in a unique and engaging way. Inspired by the classic candle chart used in financial markets, this chart can be used to visualize any type of data in a visually appealing manner, making it an excellent choice for reports, presentations, and dashboards. It’s ideal for representing performance, tracking progress, or illustrating changes over time in a dynamic and attractive format.
With its customizable design, real-time updates, and clear visual cues, the Candle Infographics Chart provides a sophisticated way to present your data while making it easy for your audience to understand trends, comparisons, and changes.

Key Features of the Candle Infographics Chart in Excel
📌 Visually Engaging Design
The candle chart is designed to resemble a candle with a wick, making it highly engaging and easy to understand. The body of the candle represents the data value, and the wick shows the range, making it ideal for visualizing data with both highs and lows.
🛠 Customizable Data Points
You can customize the chart to suit your specific data and requirements. Change the candle colors, labels, and data values to match your needs and create the perfect data representation for your presentation or report.
💡 Track Performance Over Time
The candle chart is great for tracking changes over time, whether you’re monitoring sales performance, project milestones, or any other metric. The chart allows you to see not just individual data points but also trends and patterns at a glance.
🔢 Real-Time Updates
As you update your data, the candle chart automatically adjusts to reflect the new values, ensuring that your chart always displays the most accurate and up-to-date information.
🚀 Multiple Use Cases
While originally designed for tracking financial data, this template can be used for a wide range of data visualization needs, including comparing performance, tracking goals, or monitoring progress on any project or objective.
📊 Clear and Simple to Understand
The chart is easy to interpret, with clear markers for each data point, making it perfect for presenting complex data in a simplified and professional manner.
⚙ Easy Setup and Customization
No advanced Excel skills are required to use the candle chart. The template comes with simple, clear instructions for customization, allowing you to modify the chart easily and start using it right away.
🚀 Why You’ll Love the Candle Infographics Chart in Excel
✅ Unique and Visual – Use the engaging candle design to present your data in an eye-catching way. ✅ Customizable – Tailor the chart’s colors, labels, and data to your specific needs. ✅ Track Changes Over Time – Easily see trends, fluctuations, and patterns in your data. ✅ Real-Time Updates – The chart automatically adjusts as new data is entered. ✅ Simple Setup – Easy to use with clear setup instructions.
📂 What’s Inside the Candle Infographics Chart in Excel?
- Candle Chart Design: A visually engaging chart that tracks data trends using candles and wicks.
- Customizable Labels and Data: Modify the data, labels, and colors to suit your specific needs.
- Real-Time Updates: Automatically update the chart as you enter new data.
- Clear Instructions: Simple steps to customize and implement the chart in your Excel sheet.
🔍 How to Use the Candle Infographics Chart in Excel
1️⃣ Download the Template – Get instant access to the Excel file upon purchase. 2️⃣ Enter Your Data – Input the data values for each point you want to track. 3️⃣ Customize the Chart – Adjust the colors, labels, and data to suit your needs. 4️⃣ Visualize Changes – Track performance or changes over time with the candle chart. 5️⃣ Present and Share – Use the chart in reports, presentations, or dashboards to showcase your data effectively.
🎯 Who Can Benefit from the Candle Infographics Chart in Excel? 🔹 Business Analysts 🔹 Project Managers 🔹 Sales Teams 🔹 Marketing Professionals 🔹 Financial Analysts 🔹 Anyone looking for a unique and professional way to display data trends
Make your data more engaging and easier to understand with the Candle Infographics Chart in Excel. Whether you’re tracking sales, project milestones, or financial data, this chart helps you present complex information in a visually appealing and clear format.
Click here to read the Detailed blog post
https://www.pk-anexcelexpert.com/candle-info-graphics-chart-in-excel/









Reviews
There are no reviews yet.