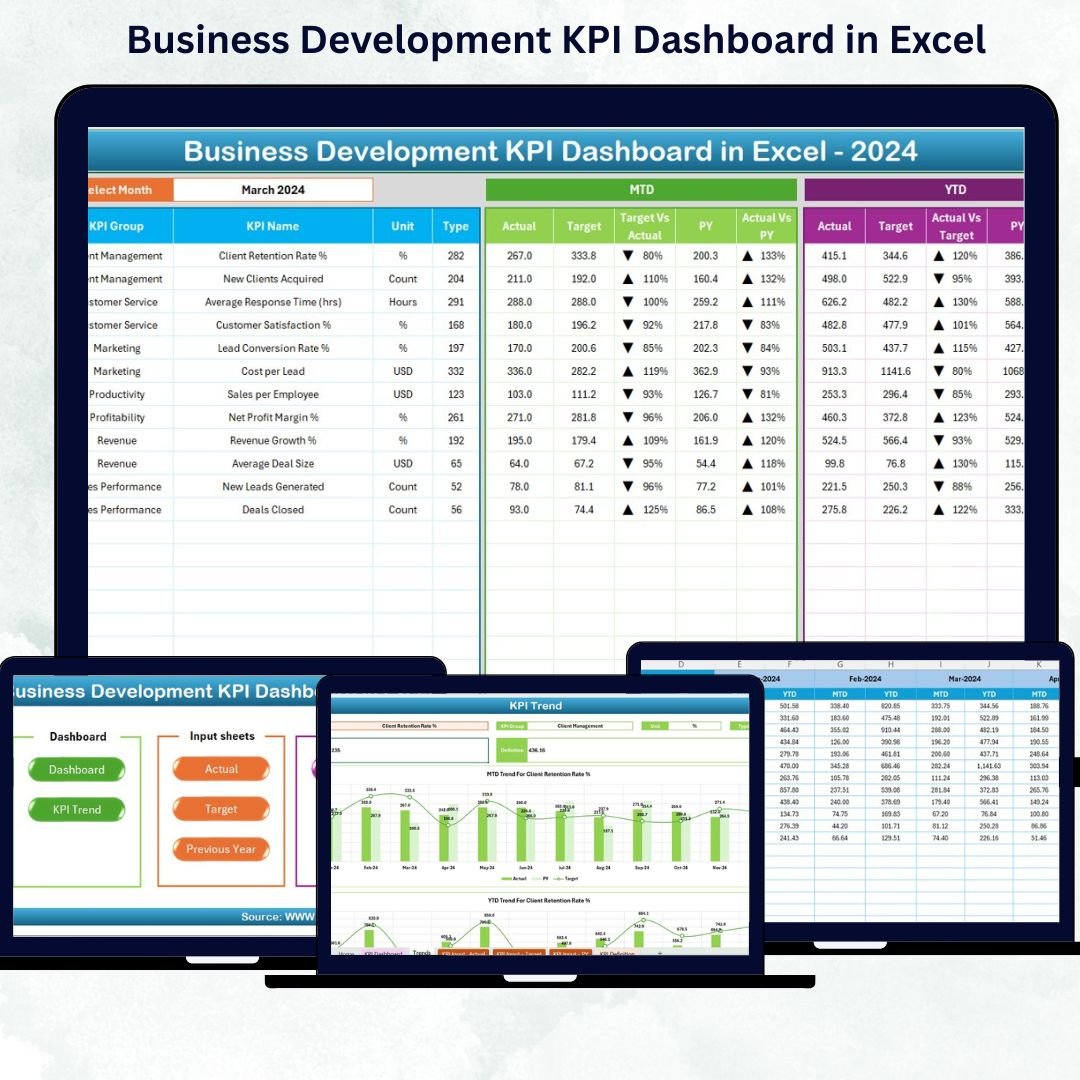
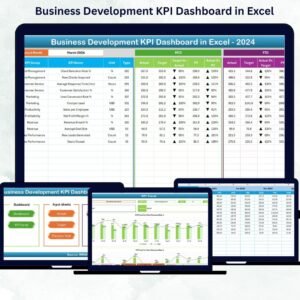
In today’s fast-paced business world, tracking growth performance is no longer optional — it’s essential! 📊 The Business Development KPI Dashboard in Excel is a smart, ready-to-use performance tracking tool designed to help organizations visualize progress, analyze trends, and make confident, data-driven decisions. Whether you’re a startup, SME, or enterprise, this dashboard gives you a complete view of your business development efforts — all within Microsoft Excel.Business Development KPI Dashboard in Excel
This Excel-based solution is built for professionals who want quick insights without the complexity of advanced BI tools. With interactive visuals, drop-down selectors, and automated formulas, it transforms raw data into actionable intelligence — saving hours of manual work while ensuring accuracy and clarity.Business Development KPI Dashboard in Excel
✨ Key Features of Business Development KPI Dashboard in Excel
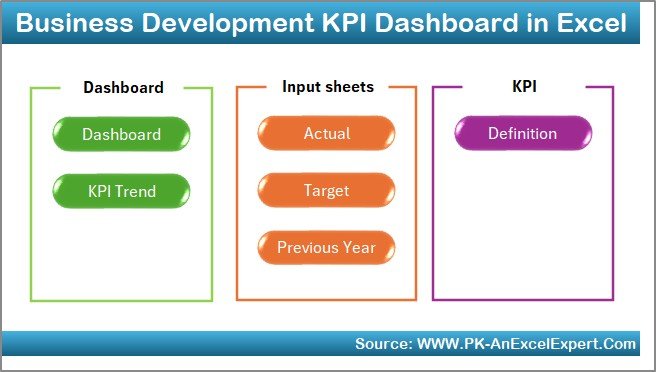
✅ 7 Structured Worksheets – Includes Home, Dashboard, KPI Trend, Actual Numbers, Target, Previous Year, and KPI Definition sheets for a complete workflow.
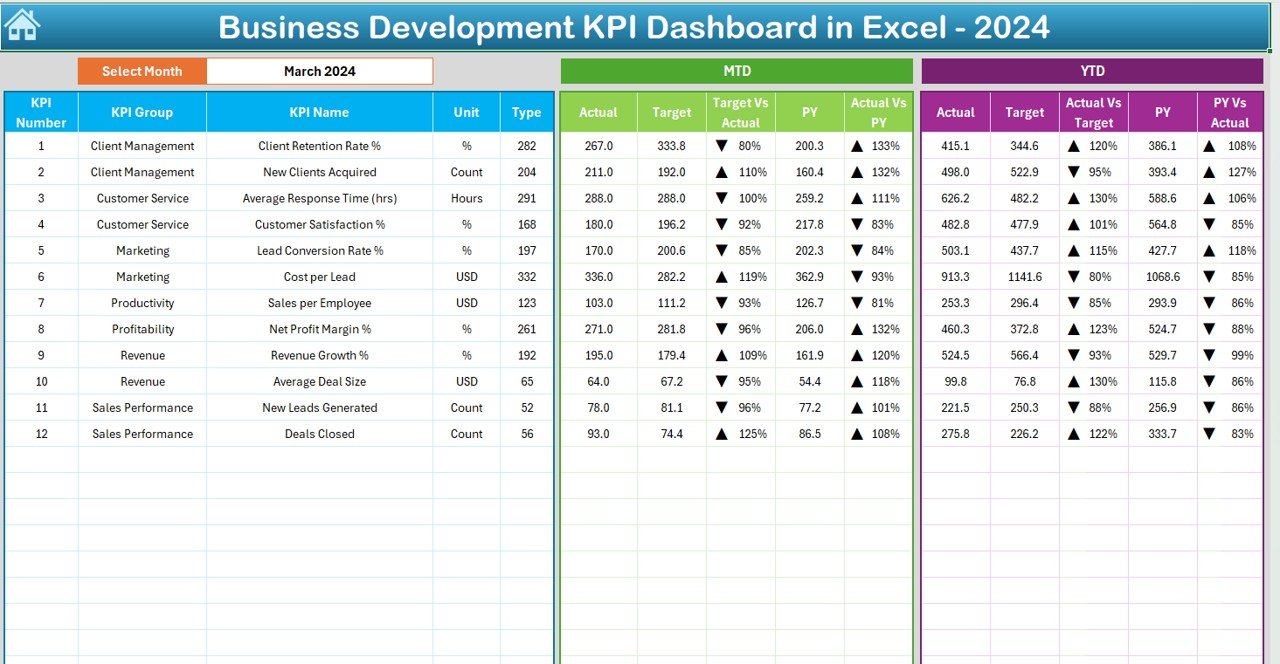
📅 Dynamic Month Selection – Choose a month from the drop-down (cell D3) to instantly refresh all metrics across the dashboard.
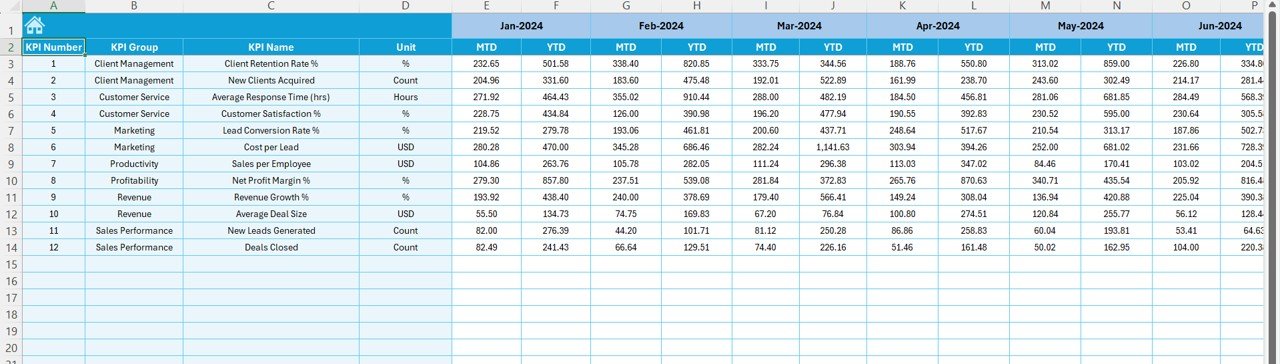
📈 MTD & YTD Performance Tracking – Compare Month-to-Date and Year-to-Date performance with Actual, Target, and Previous Year values.
🔺 Conditional Formatting – Up/down arrows indicate whether performance is improving or needs attention.
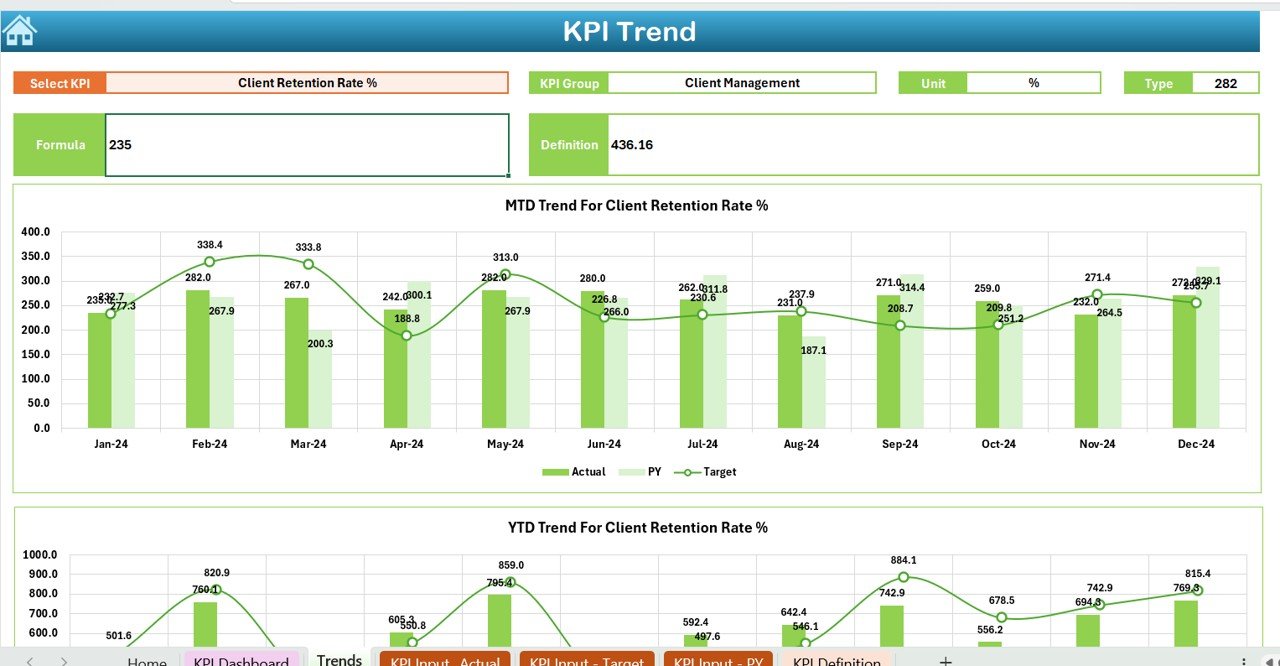
📊 Interactive Charts – Visualize KPI trends and spot insights instantly through prebuilt bar and line charts.
🧩 Customizable KPIs – Add or modify KPIs easily in the KPI Definition sheet to align with your business goals.
💡 Zero Technical Skills Required – Designed for ease of use — no advanced Excel or coding knowledge needed.
💰 Cost-Effective Solution – No expensive BI software required — everything runs smoothly in Excel.
📦 What’s Inside the Business Development KPI Dashboard
💻 Home Sheet (Navigation Page): A simple interface with clickable buttons to access all sheets quickly — making navigation smooth and efficient.Business Development KPI Dashboard in Excel
📊 Dashboard Sheet (Main View): Displays MTD & YTD values, Actual vs Target, and Previous Year comparisons — all dynamically updated based on your month selection.Business Development KPI Dashboard in Excel
📈 KPI Trend Sheet: Lets you select any KPI (cell C3) to analyze its monthly and yearly trends using visually clear charts and performance indicators.Business Development KPI Dashboard in Excel
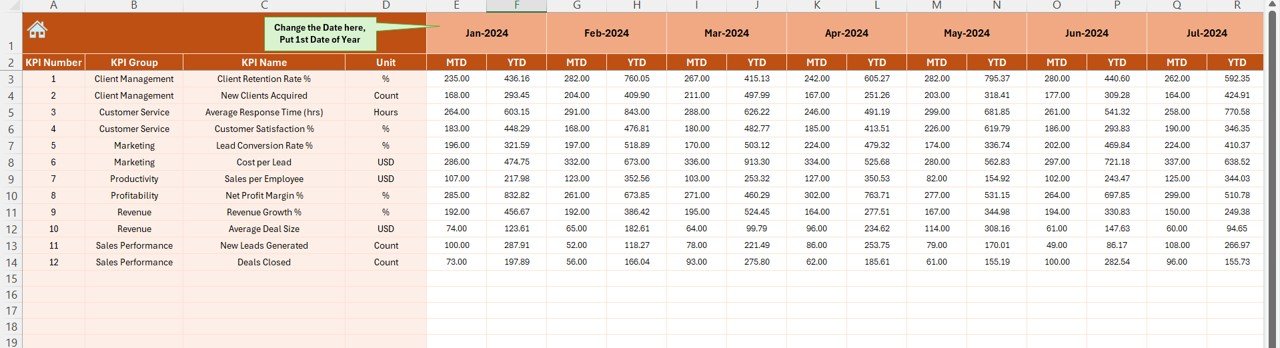
🧾 Actual Numbers Input Sheet: Record monthly performance metrics; structured data entry ensures consistency and accurate analysis.
🎯 Target Sheet: Set performance benchmarks for MTD and YTD goals — compare them easily against actual data.
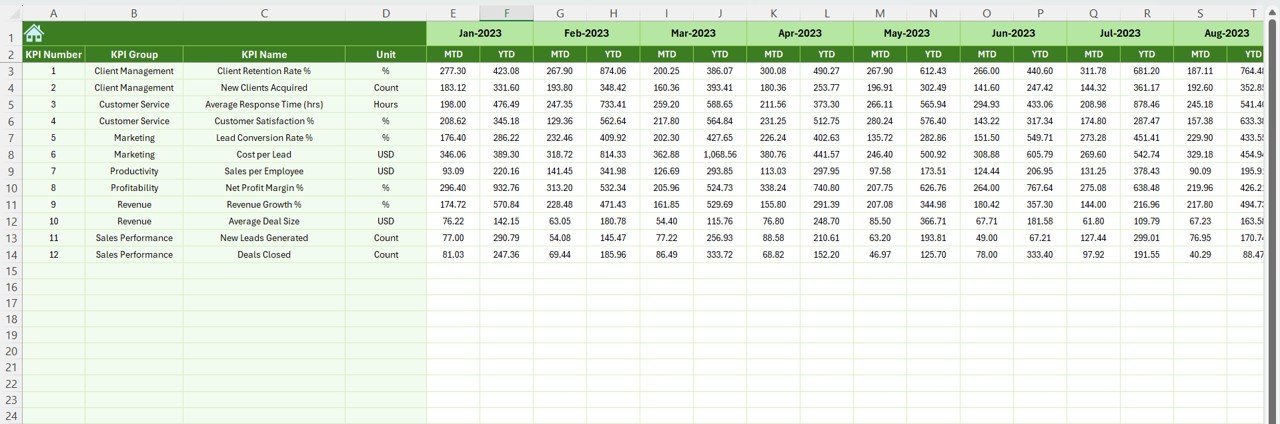
📅 Previous Year Sheet: Maintain historical data for side-by-side analysis and year-over-year growth evaluation.
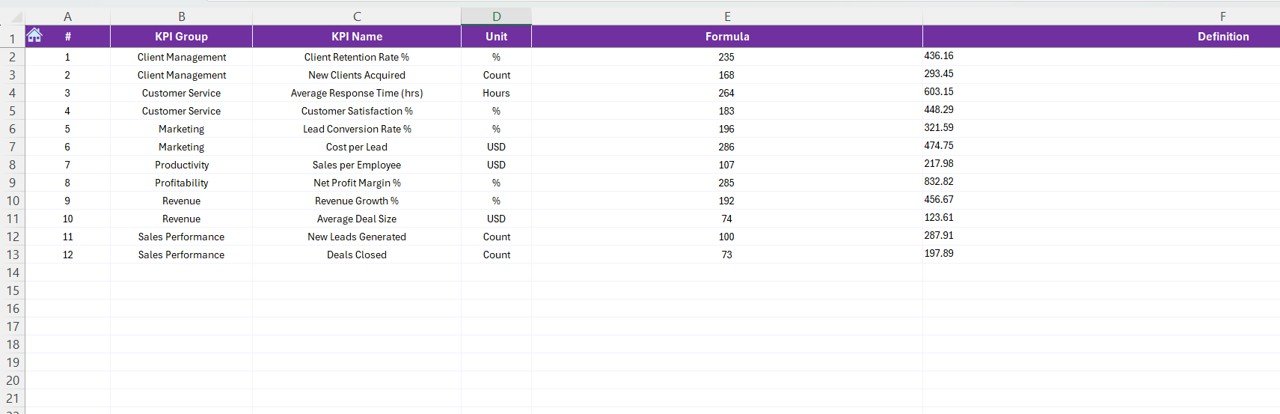
📘 KPI Definition Sheet: Lists all KPIs with their formulas, units, and definitions — ensuring consistency across the team.
🧭 How to Use the Business Development KPI Dashboard
1️⃣ Open the Home Sheet — use navigation buttons to explore sections.
2️⃣ Visit the Target Sheet — enter monthly & yearly targets.
3️⃣ Go to Actual Numbers Sheet — fill in real-time MTD and YTD data.
4️⃣ Update the Previous Year Sheet — input last year’s data for comparison.
5️⃣ Review KPI Definitions — confirm accuracy of formulas and logic.
6️⃣ Analyze results on the Dashboard Page — select any month (D3) and review performance metrics.
7️⃣ Explore the KPI Trend Sheet — track performance evolution using charts.
That’s it! 🎯 Within minutes, you’ll have a clear, visualized summary of your organization’s progress.
👥 Who Can Benefit from This Business Development KPI Dashboard
🏢 Business Development Teams: Measure conversion rates, leads, and growth against targets.
💼 Sales Managers: Identify top-performing reps, track deals, and spot missed opportunities.
📊 Executives & Decision-Makers: Get a high-level overview of performance without crunching numbers manually.
📈 Small Business Owners: Access a complete KPI dashboard without the cost of complex BI software.
🧠 Consultants & Analysts: Customize KPIs for multiple clients and generate reports easily.
💻 Corporate Trainers & Educators: Use this dashboard as a teaching or demo tool for KPI tracking.


Reviews
There are no reviews yet.