
Business growth does not happen randomly. It is driven by clear visibility, accurate forecasting, and timely decisions. However, many organizations still track deals, leads, and revenue using scattered Excel files or manual reports. As a result, decision-makers struggle to understand where growth is coming from and where opportunities are slipping away.
That is exactly where the Business Development Dashboard in Excel becomes a powerful and practical solution.
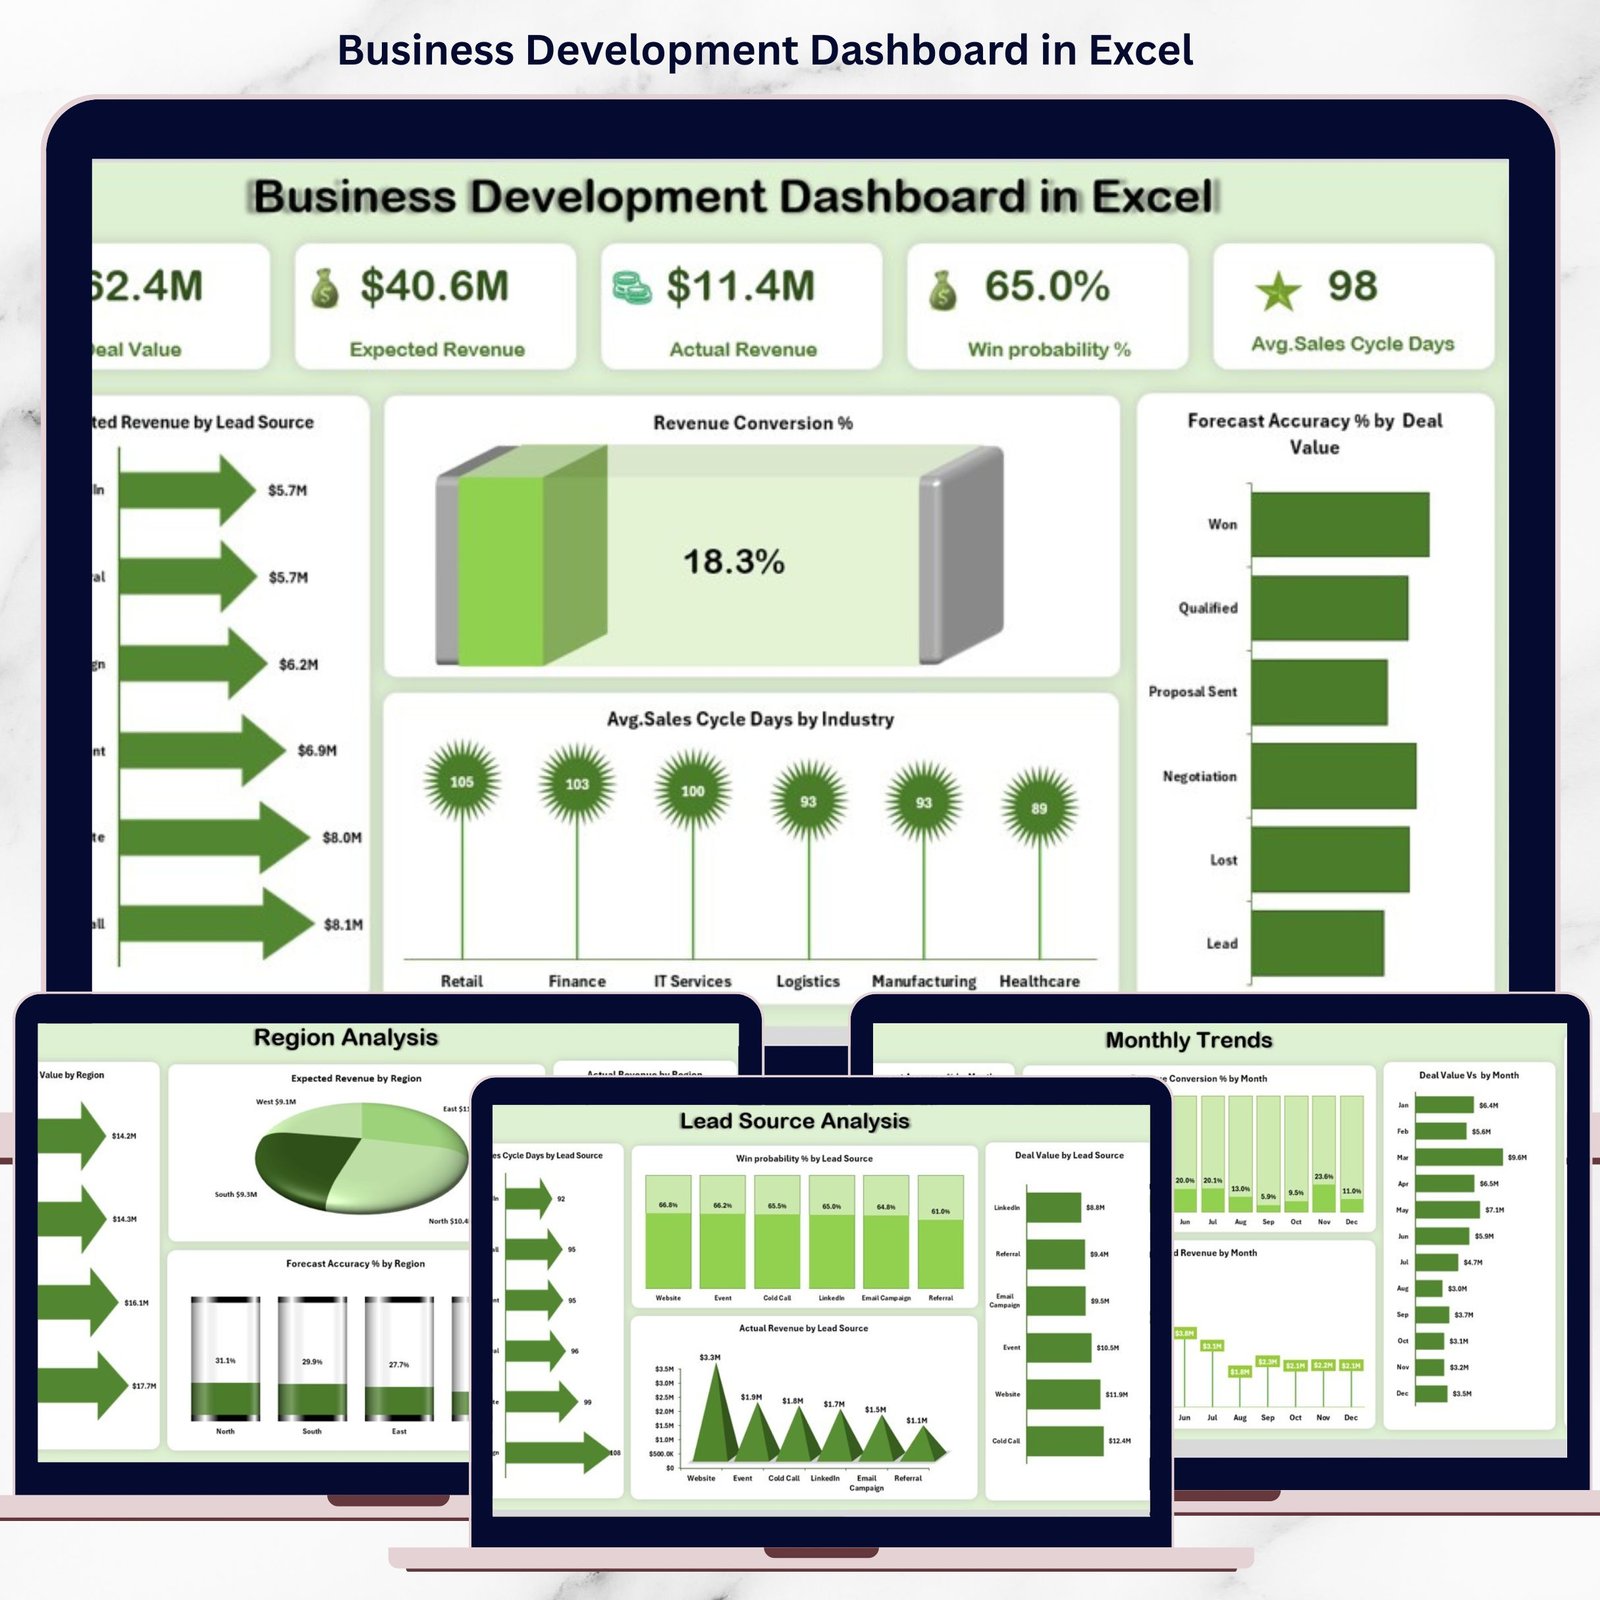
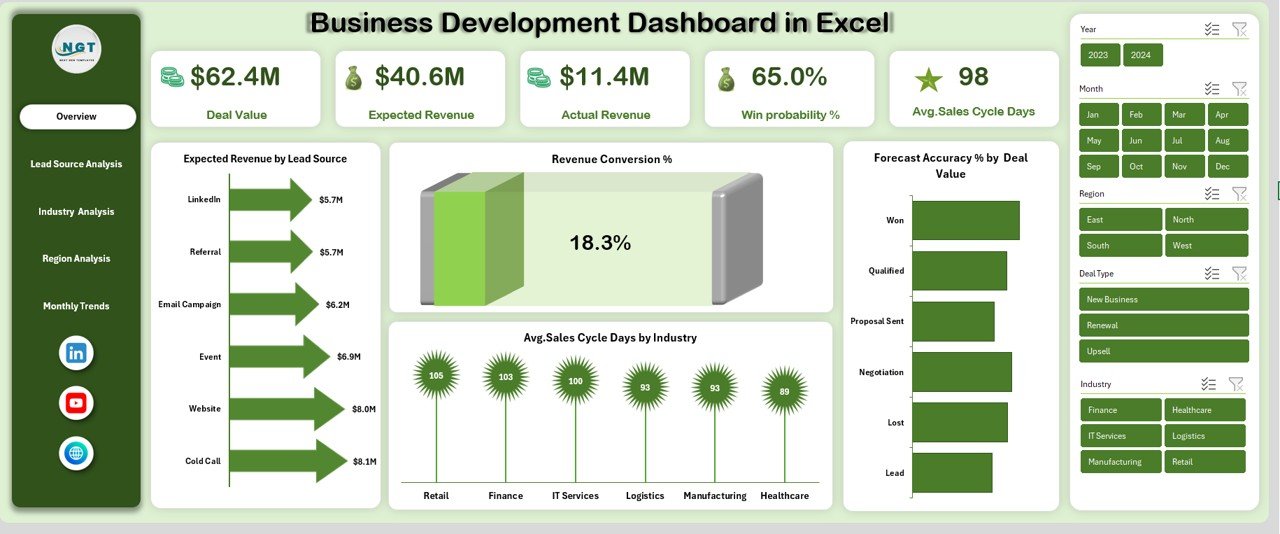
This ready-to-use dashboard transforms raw business development data into clear, interactive, and actionable insights. Instead of switching between multiple spreadsheets, you get a centralized view of deal performance, revenue trends, lead sources, industries, regions, and forecasting accuracy—all inside Excel.
Whether you manage sales pipelines, oversee revenue growth, or lead strategic planning, this dashboard helps you move from guesswork to data-driven decisions.
## 🚀 Key Features of Business Development Dashboard in Excel
📊 Executive-Level Overview – Instantly track Deal Value, Expected Revenue, Actual Revenue, and Win Probability % from a single screen.
📈 Accurate Revenue Forecasting – Analyze Forecast Accuracy % by Deal Value, Industry, Region, and Month.
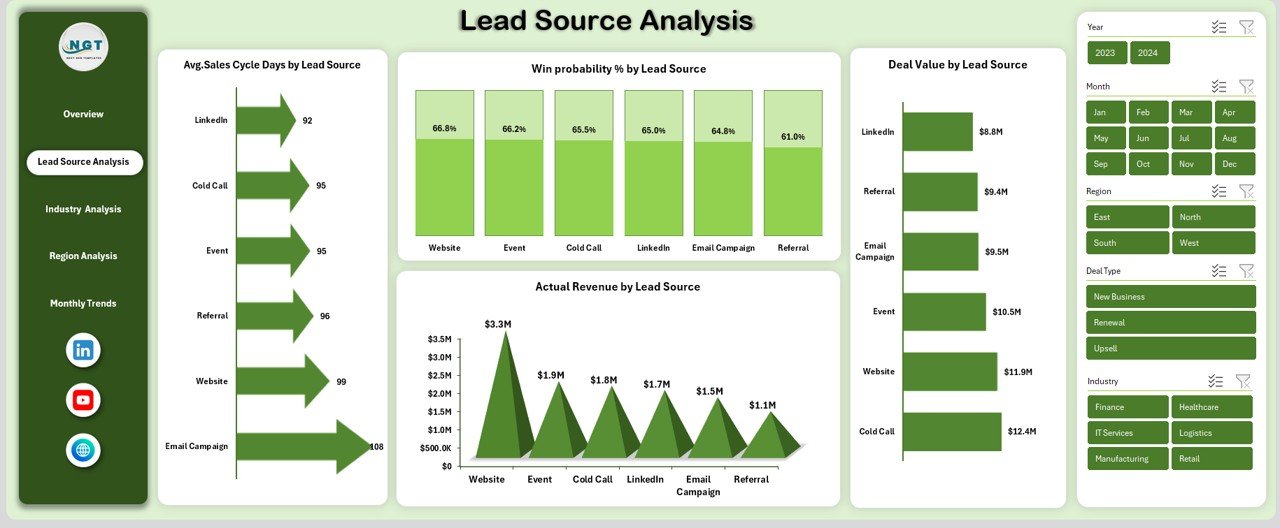
🎯 Lead Source Intelligence – Identify which lead channels deliver faster closures, higher win rates, and real revenue.
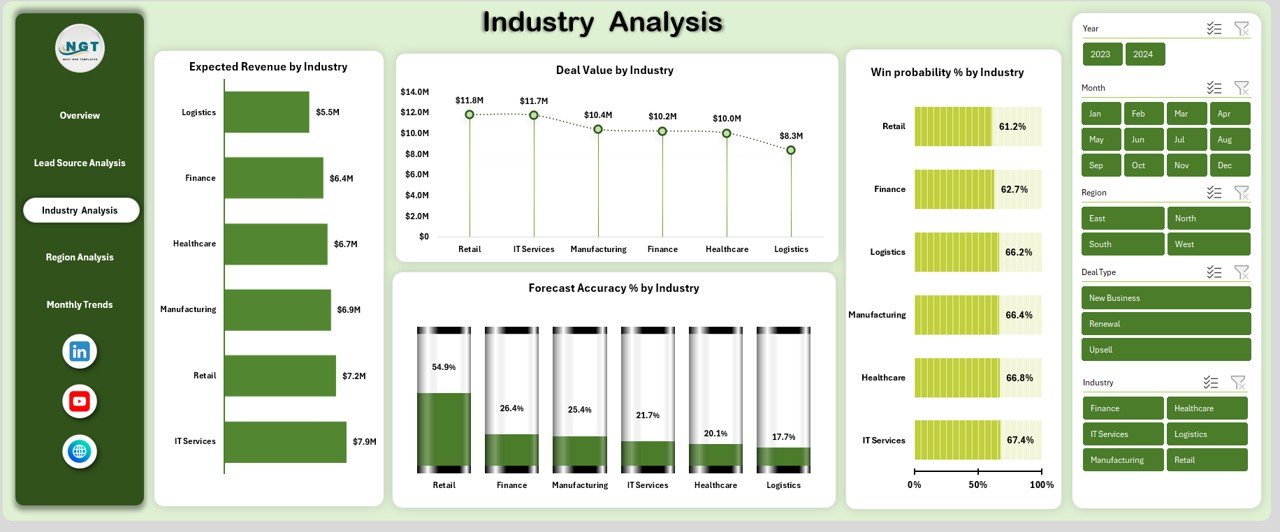
🏭 Industry Performance Analysis – Understand which industries drive growth and where sales cycles slow down.
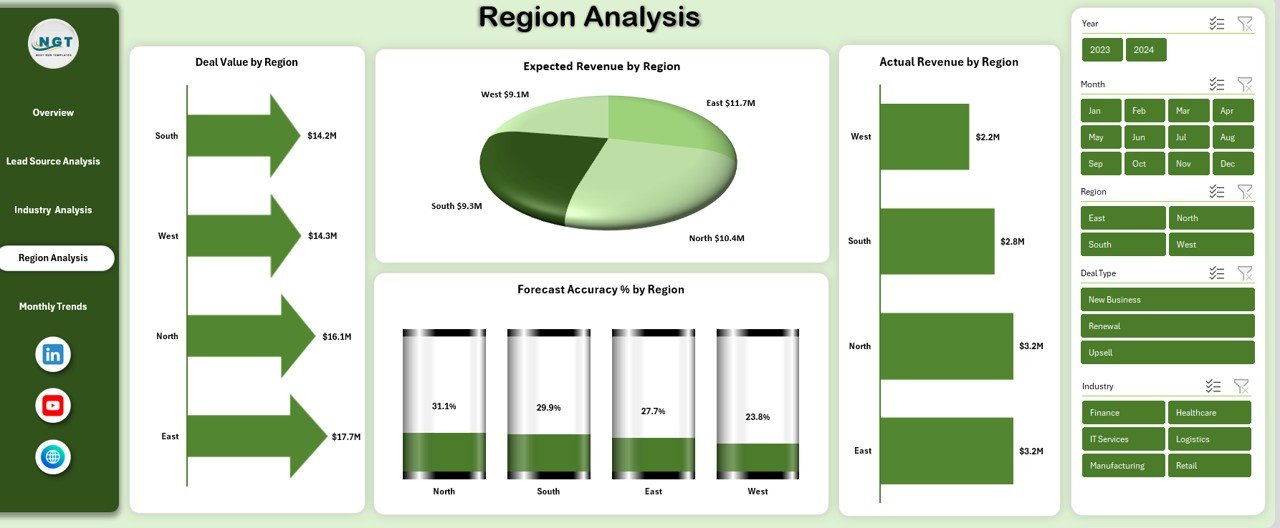
🌍 Regional Insights – Compare deal values, expected revenue, and actual performance across regions.
📅 Monthly Trend Tracking – Monitor how conversion rates, forecast accuracy, and expected revenue change over time.
⚡ Fully Excel-Based – No expensive BI tools or technical setup required.
🔄 Interactive & Dynamic – Built with pivot tables, slicers, and charts for instant filtering and updates.
## 📦 What’s Inside the Business Development Dashboard in Excel
This dashboard is thoughtfully designed with multiple analytical pages to support real-world business development needs:
✔ Overview Page – High-level KPIs with charts for expected revenue, conversion rates, forecast accuracy, and sales cycle insights.
✔ Lead Source Analysis – Avg. sales cycle days, win probability %, actual revenue, and deal value by lead source.
✔ Industry Analysis – Expected revenue, deal value, win probability, and forecast accuracy by industry.
✔ Region Analysis – Deep dive into deal value, expected revenue, actual revenue, and forecasting reliability by region.
✔ Monthly Trends Page – Track forecast accuracy %, revenue conversion %, and expected revenue by month.
Each page is structured to answer one key question: Where should we focus to drive growth faster and smarter?
## 🛠️ How to Use the Business Development Dashboard in Excel
Using this dashboard is simple and intuitive:
1️⃣ Enter or paste your business development data into the structured Excel tables.
2️⃣ Refresh the pivot tables to update all KPIs and visuals instantly.
3️⃣ Use slicers and filters to analyze performance by month, region, lead source, or industry.
4️⃣ Review trends, identify bottlenecks, and spot high-performing segments.
5️⃣ Use insights to improve forecasting, prioritize leads, and refine sales strategies.
No advanced Excel skills are required. If you can work with basic Excel features, you can use this dashboard confidently.
## 👥 Who Can Benefit from This Business Development Dashboard in Excel
This dashboard is ideal for:
✔ Business Development Managers tracking pipeline health
✔ Sales Leaders monitoring revenue performance
✔ Revenue Operations and Strategy Teams
✔ Startup Founders planning scalable growth
✔ Executives needing quick, reliable performance insights
If your organization relies on data to grow revenue, this dashboard becomes an essential decision-support tool.


Reviews
There are no reviews yet.