Managing angel investment networks requires clear visibility into startup performance, funding activity, and investor engagement. However, when organizations rely on scattered spreadsheets or manual reports, tracking performance becomes extremely difficult.
That is why the Business Angel Networks KPI Dashboard in Excel is the perfect solution.
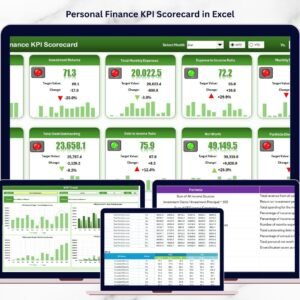
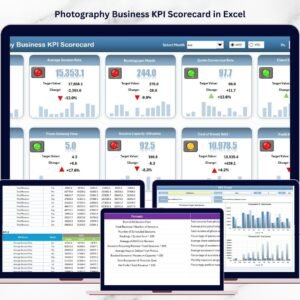
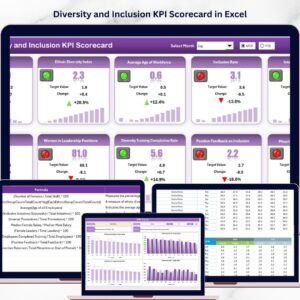
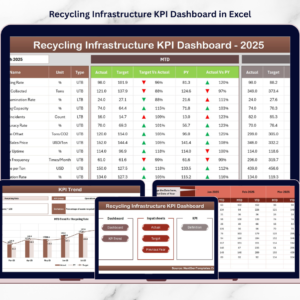
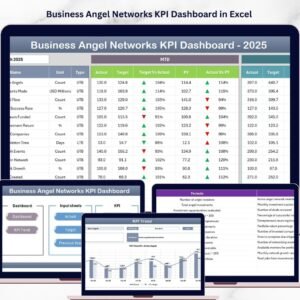
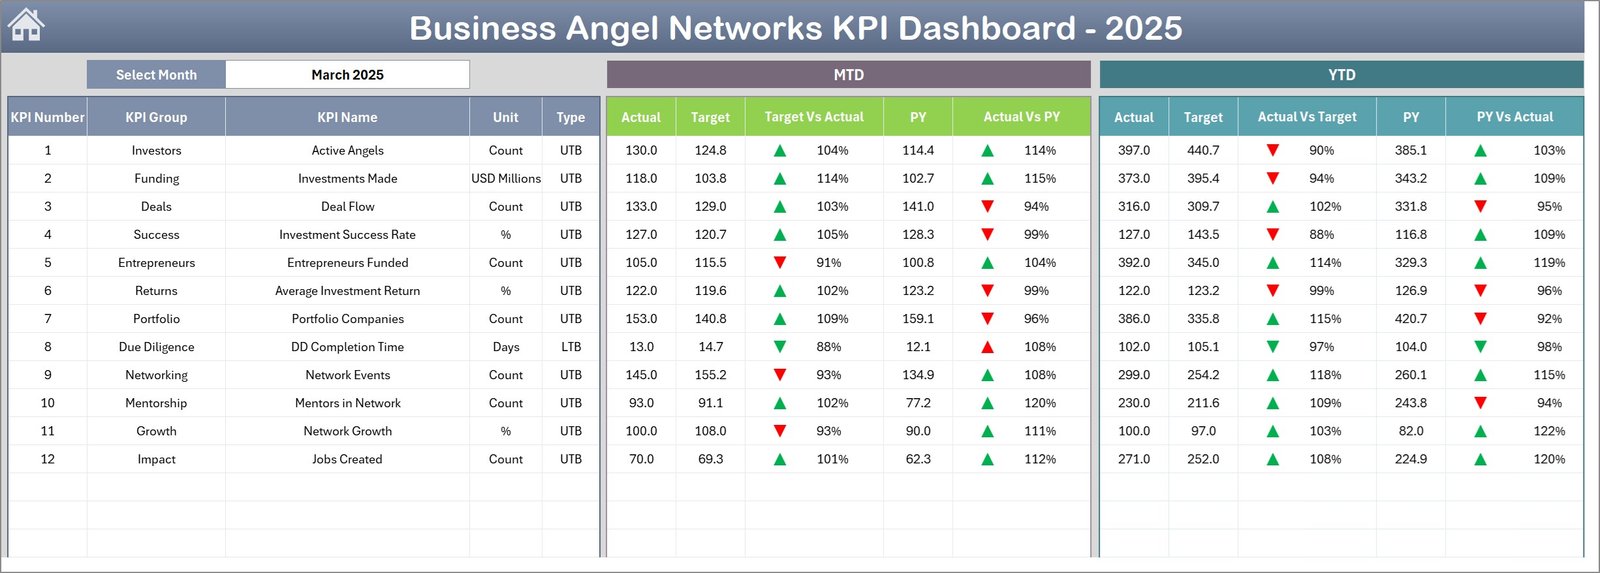
This powerful Excel-based dashboard helps angel networks track investment metrics, analyze startup growth, monitor investor participation, and evaluate funding performance — all in one structured dashboard.
Instead of spending hours compiling reports, organizations can quickly visualize important metrics through dynamic charts, automated calculations, and interactive analysis tools.
Whether you manage a startup investment network, venture community, accelerator program, or investor group, this dashboard helps you make smarter, faster, and data-driven decisions.
🚀 Key Features of Business Angel Networks KPI Dashboard in Excel
📊 Interactive KPI Dashboard
Monitor key investment metrics including MTD and YTD performance with automated calculations and visual indicators.
📅 Dynamic Month Selection
Easily switch between months using the dropdown selection. The entire dashboard updates automatically.
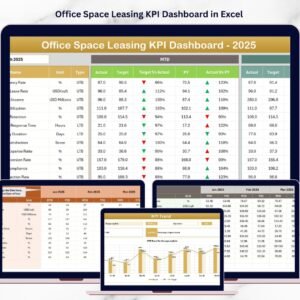
📈 Performance Comparison System
Compare Actual vs Target and Actual vs Previous Year performance instantly.
📉 Conditional Formatting Indicators
Up and down arrows visually highlight whether KPI performance improves or declines.
📊 Trend Analysis Charts
Visual charts help users identify KPI trends, growth patterns, and performance changes over time.
📂 Centralized Data Management
All investment data, KPI definitions, targets, and historical metrics exist in one organized Excel file.
⚙ Automated Calculations
Excel formulas and pivot tables update calculations automatically when new data is entered.
🔎 Flexible KPI Tracking
Track startup growth, funding activity, investor participation, portfolio performance, and more.
💡 Fully Customizable Structure
Add new KPIs, modify charts, or expand analysis pages according to your organization’s needs.
📊 What’s Inside the Business Angel Networks KPI Dashboard in Excel
This ready-to-use dashboard includes 7 structured worksheets designed for efficient investment performance tracking.
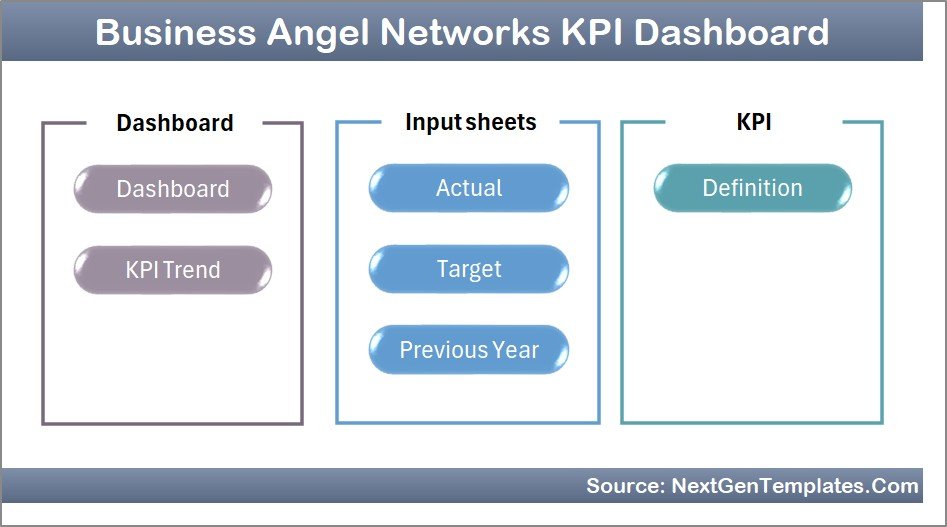
1️⃣ Summary Page
Acts as the main navigation page. It contains six buttons that allow users to jump directly to different dashboard sections.
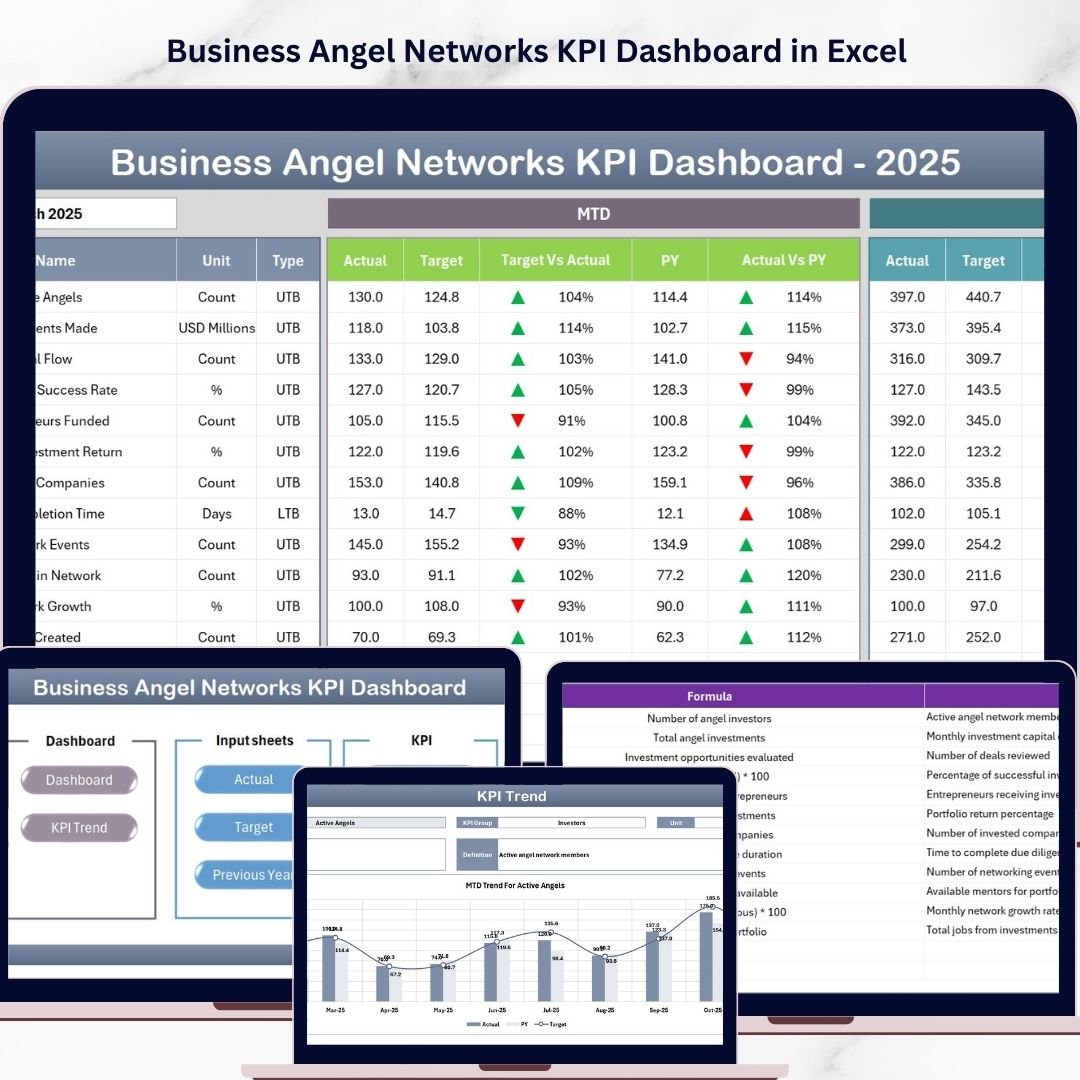
2️⃣ Dashboard Sheet
The central analytics page displaying key KPI metrics including:
-
MTD Actual Values
-
Target Values
-
Previous Year Performance
-
Target vs Actual comparison
-
Previous Year vs Actual comparison
The dashboard also displays Year-To-Date metrics to evaluate long-term performance.
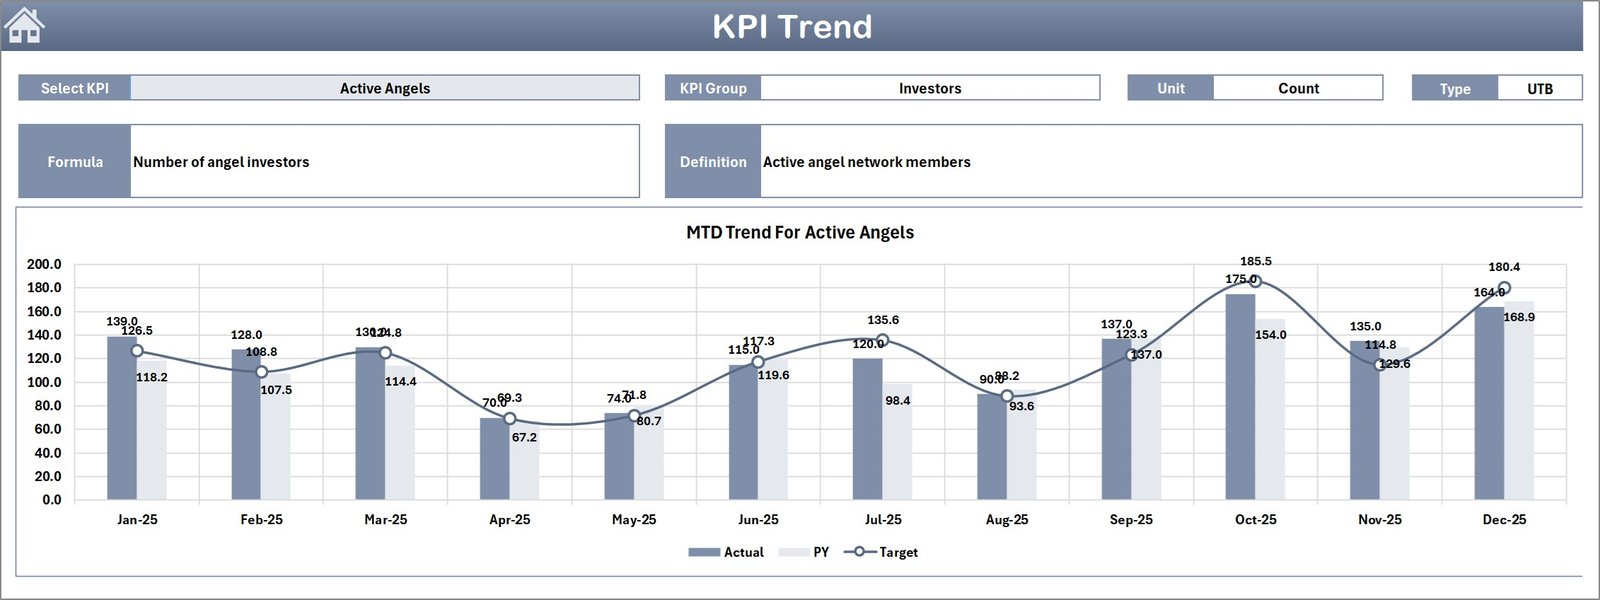
3️⃣ Trend Analysis Sheet
This sheet focuses on KPI performance trends. Users can select a KPI and view detailed charts comparing:
-
Actual performance
-
Target performance
-
Previous year results
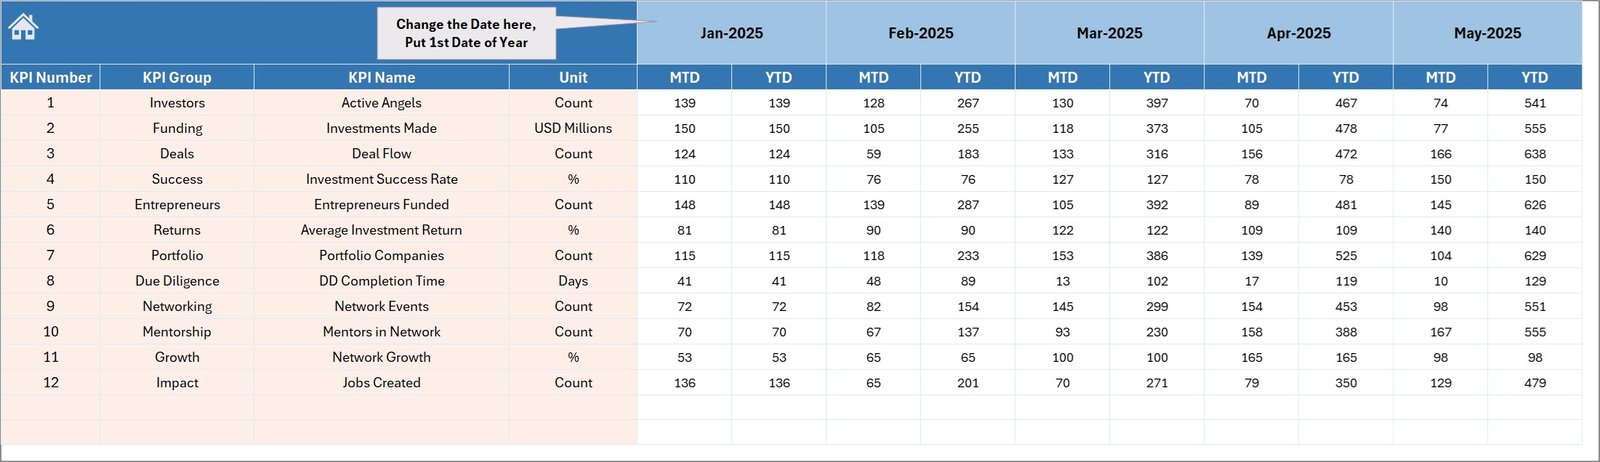
4️⃣ Actual Numbers Input Sheet
Users enter current performance data including MTD and YTD values.
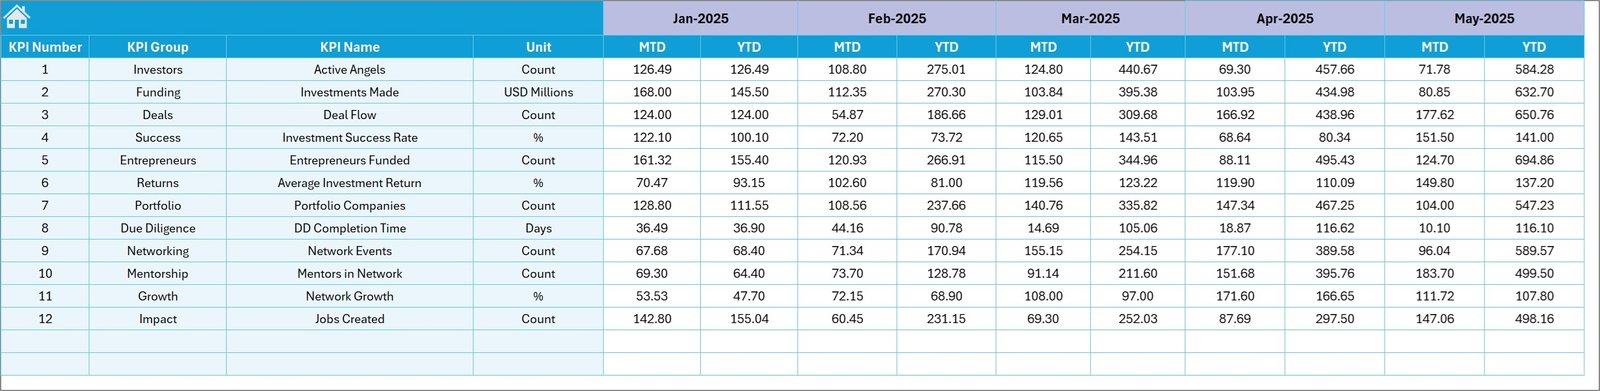
5️⃣ Target Sheet
Stores monthly and yearly KPI targets used for performance comparison.
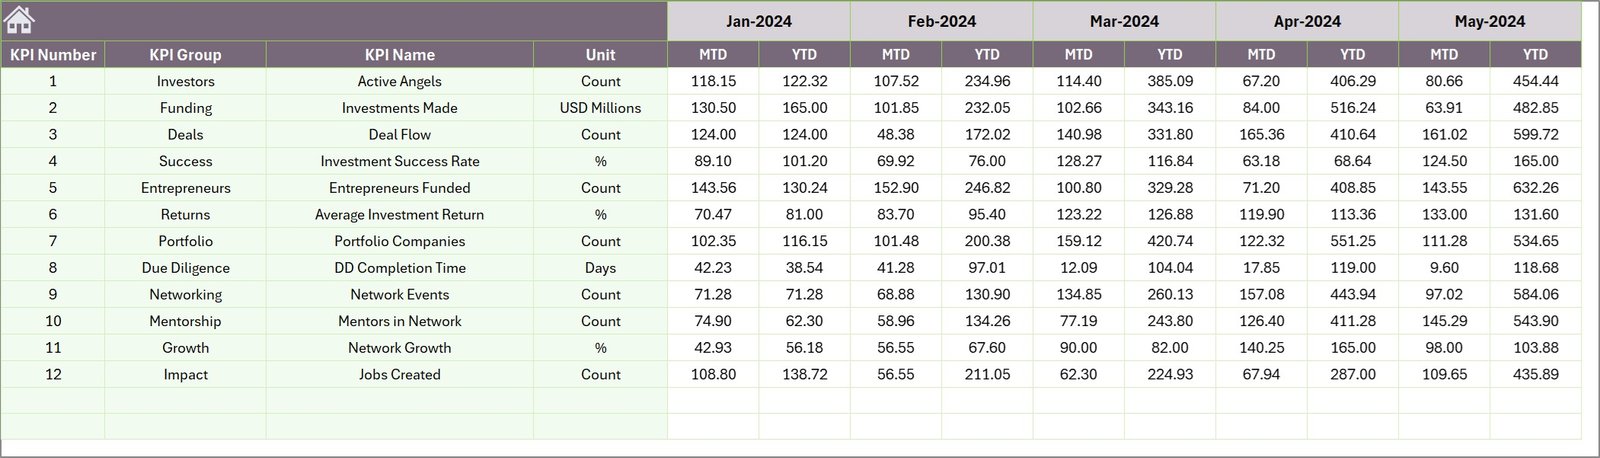
6️⃣ Previous Year Numbers Sheet
Maintains historical data to compare current performance with last year’s results.
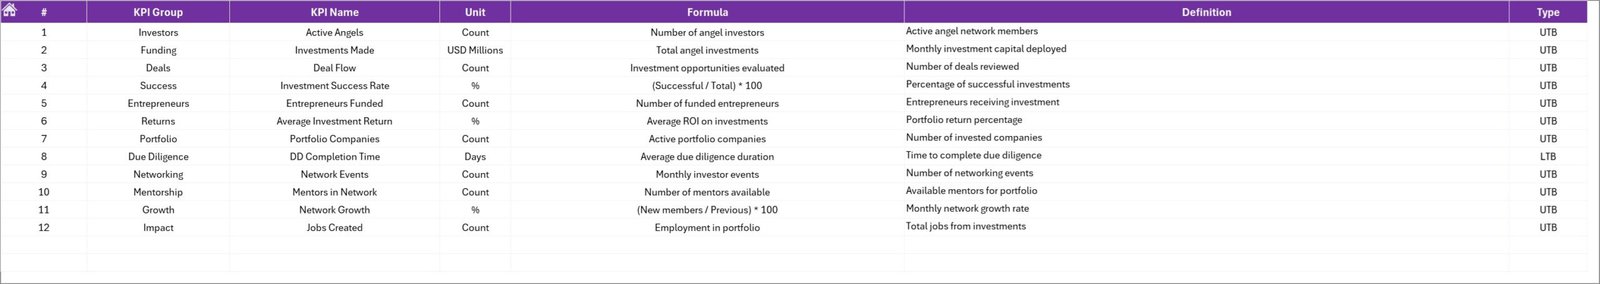
7️⃣ KPI Definition Sheet
Contains KPI details such as:
-
KPI Name
-
KPI Group
-
Measurement Unit
-
KPI Formula
-
KPI Definition
⚙ How to Use the Business Angel Networks KPI Dashboard in Excel
Using this dashboard is simple and efficient.
Step 1 – Enter KPI Definitions
Start by defining KPIs in the KPI Definition sheet.
Step 2 – Add Target Values
Enter monthly and yearly targets for each KPI.
Step 3 – Input Historical Data
Add previous year performance numbers for comparison analysis.
Step 4 – Enter Actual Performance Data
Update the Actual Numbers Input sheet with the latest performance metrics.
Step 5 – Analyze Dashboard Insights
Select a month from the dropdown and instantly view updated KPI metrics, comparisons, and trends.
This workflow allows organizations to monitor investment performance quickly and accurately.
🎯 Who Can Benefit from This Business Angel Networks KPI Dashboard
This dashboard is extremely useful for professionals involved in startup investment ecosystems.
👨💼 Angel Investment Networks
Track portfolio performance and investor activity.
🚀 Startup Accelerators & Incubators
Monitor startup growth metrics and funding progress.
📊 Venture Capital Analysts
Analyze deal flow, investment outcomes, and portfolio performance.
💼 Startup Investment Managers
Evaluate funding success and monitor startup performance indicators.
🏢 Entrepreneurship Development Organizations
Track ecosystem growth and startup engagement.
📈 Startup Mentorship Programs
Monitor startup progress and investment results.
Click here to read the Detailed blog post
Watch the step-by-step video tutorial: