

Modern buildings are becoming smarter every day. From HVAC systems and lighting controls to security monitoring and energy management, building automation systems generate huge amounts of operational data. However, without a structured monitoring system, this data becomes difficult to analyze and use effectively.
That’s exactly where the Building Automation KPI Dashboard in Excel becomes a powerful solution.
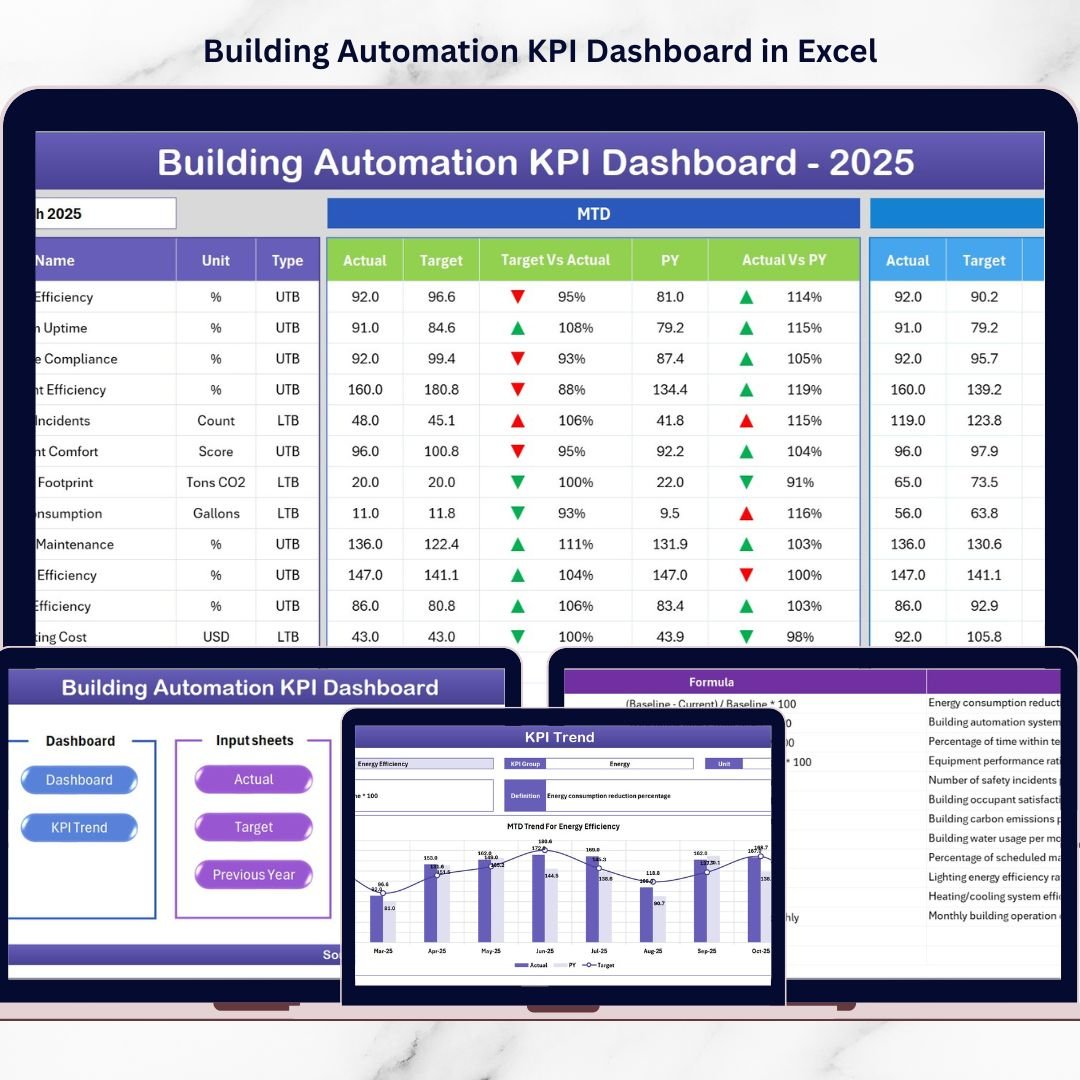
This ready-to-use Excel dashboard template helps facility managers, building operators, and organizations monitor critical performance indicators in a clear and interactive way. Instead of analyzing scattered reports, this dashboard consolidates all important building performance metrics into a single, easy-to-understand interface.
With dynamic charts, conditional formatting indicators, KPI comparisons, and automated calculations, users can instantly monitor operational performance, compare results with targets, and identify improvement opportunities.
Whether you manage commercial buildings, corporate offices, hospitals, smart facilities, or industrial infrastructure, this dashboard helps you transform raw building data into meaningful insights that support smarter decision-making.
🚀 Key Feature of Building Automation KPI Dashboard in Excel
📊 Dynamic KPI Monitoring
Track multiple building performance indicators in one centralized dashboard with automatic calculations and visual indicators.
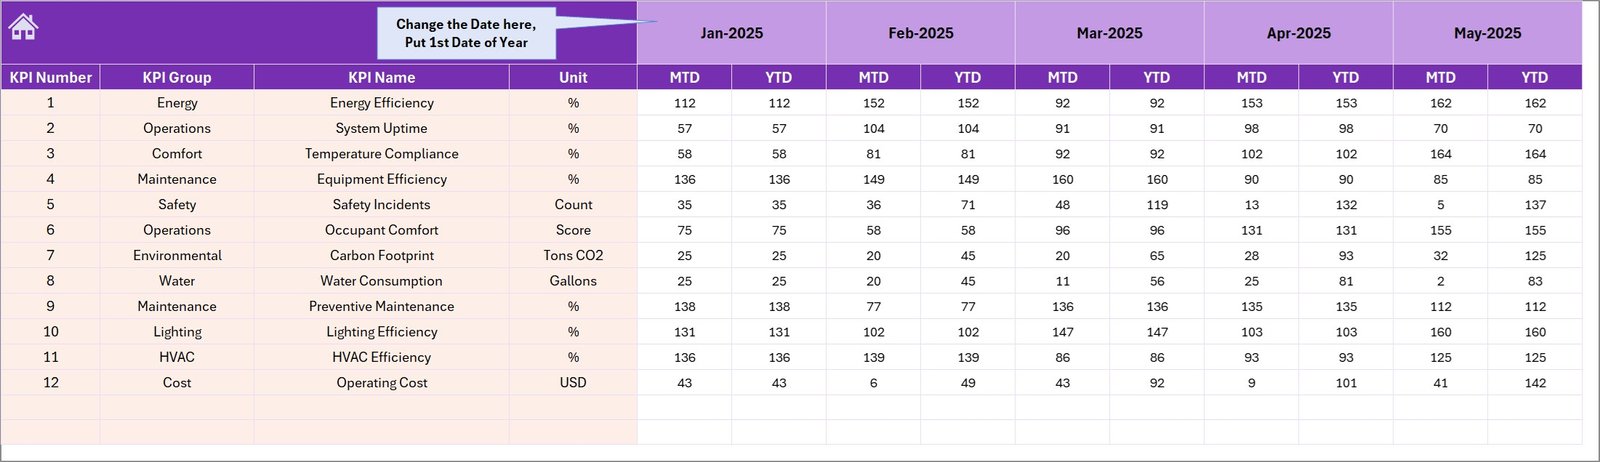
📅 Monthly Performance Selection
Use the drop-down month selector to instantly update the entire dashboard and analyze specific monthly performance.
📈 MTD and YTD KPI Tracking
Monitor both Month-to-Date and Year-to-Date performance to evaluate short-term and long-term operational trends.
📉 Target vs Actual Performance Comparison
Instantly compare actual KPI values with defined targets to identify performance gaps and improvement opportunities.
🔁 Previous Year Comparison
Analyze current performance against previous year data to understand long-term improvement trends.
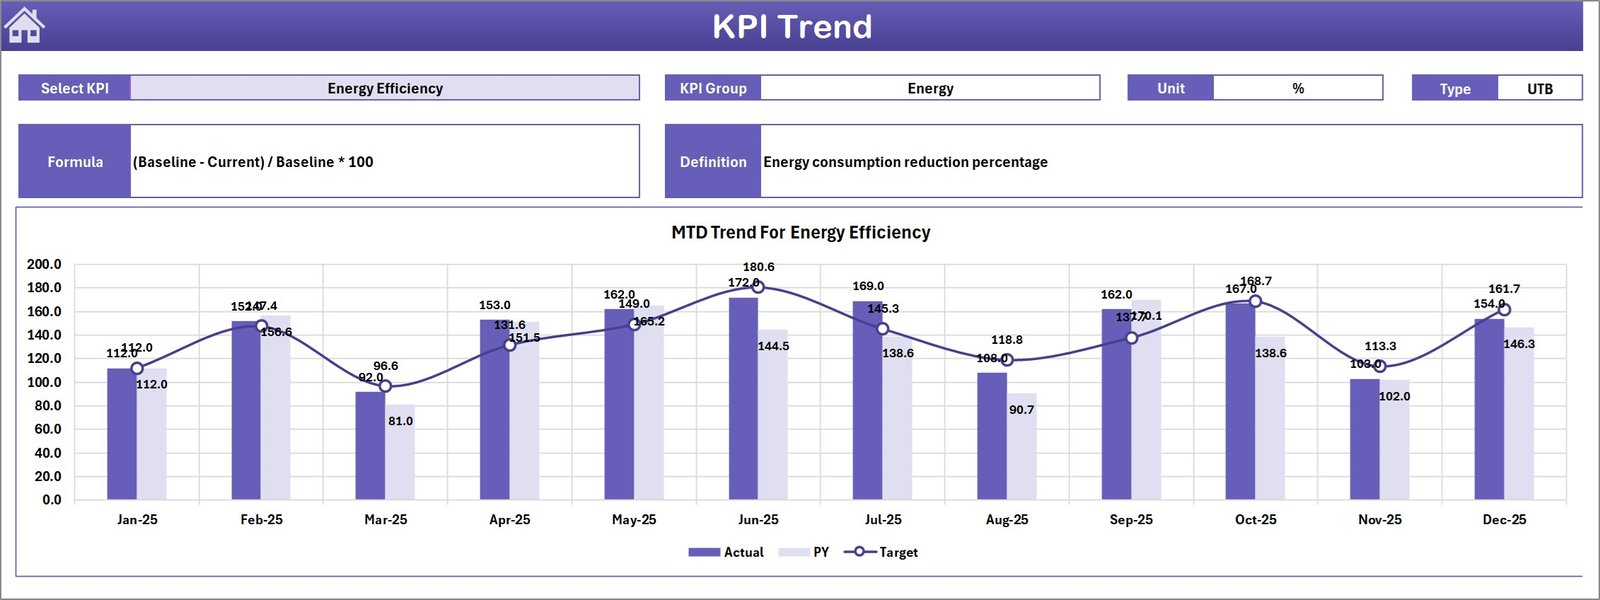
📊 Interactive KPI Trend Analysis
Visual trend charts display performance fluctuations over time, helping organizations detect patterns and operational changes.
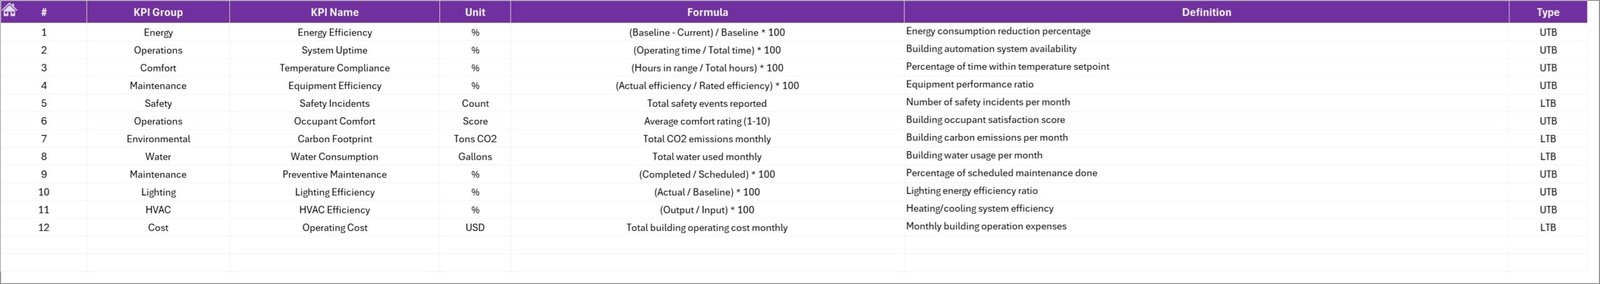
📂 Structured KPI Documentation
A dedicated KPI definition sheet explains KPI formulas, units, groups, and definitions for better understanding and transparency.
⚡ Easy Navigation System
The summary page includes navigation buttons that allow users to move between worksheets quickly and easily.
📦 What’s Inside the Building Automation KPI Dashboard in Excel
This powerful Excel dashboard contains 7 structured worksheets designed for comprehensive KPI monitoring.
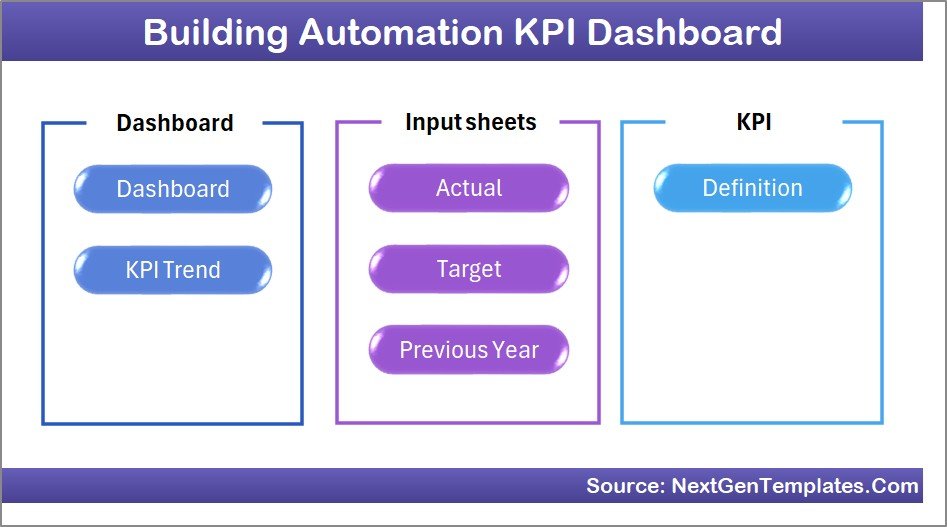
📑 Summary Page
Acts as a dashboard navigation hub with quick access buttons to jump between different analytical sheets.
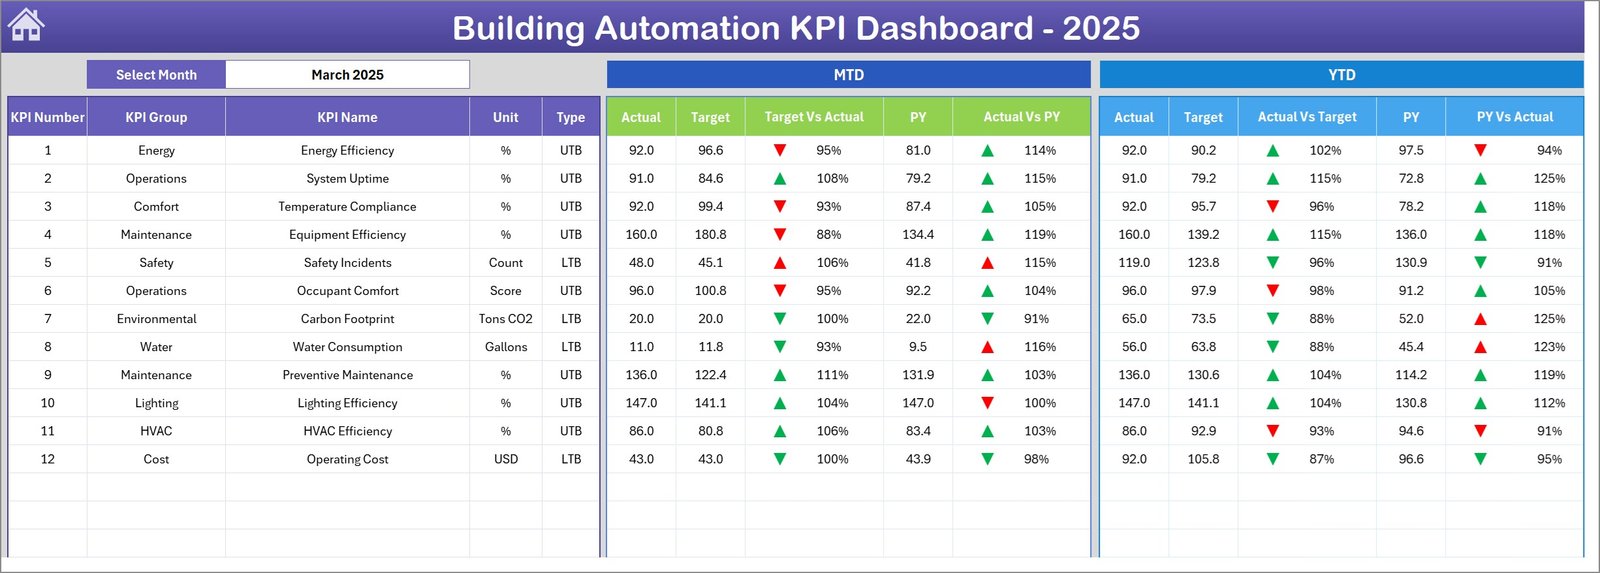
📊 Dashboard Sheet
The main monitoring page where all KPIs are displayed with MTD, YTD, Target, and Previous Year comparisons.
📈 Trend Analysis Sheet
Displays detailed KPI trend charts and KPI information including group, unit, formula, and definition.
📥 Actual Numbers Input Sheet
Users enter actual operational KPI values for both monthly and yearly performance tracking.
🎯 Target Sheet
Contains defined KPI targets used for measuring performance success.
📊 Previous Year Numbers Sheet
Stores historical KPI values used for year-over-year comparison analysis.
📘 KPI Definition Sheet
Documents KPI formulas, KPI units, KPI groups, and KPI descriptions for easy reference.
⚙️ How to Use the Building Automation KPI Dashboard
Using this dashboard is simple and does not require advanced Excel skills.
1️⃣ Enter your KPI definitions in the KPI Definition sheet.
2️⃣ Define your performance targets in the Target sheet.
3️⃣ Enter historical data in the Previous Year Numbers sheet.
4️⃣ Input current KPI values in the Actual Numbers Input sheet.
5️⃣ Select the desired month from the dashboard drop-down.
6️⃣ Instantly analyze KPI performance through charts, indicators, and trend analysis.
This simple workflow allows facility managers to track building performance efficiently.
👥 Who Can Benefit from This Building Automation KPI Dashboard
This dashboard is extremely valuable for professionals responsible for facility operations and building performance.
🏢 Facility Managers monitoring building systems and operational efficiency.
⚙️ Building Operations Teams responsible for automation systems and maintenance.
🏗 Property Management Companies managing multiple buildings or smart facilities.
🏥 Hospitals and Commercial Building Administrators tracking energy and operational metrics.
🏭 Industrial Facility Managers monitoring building infrastructure performance.
🏢 Corporate Office Facility Teams ensuring comfort, safety, and efficiency.
By using this dashboard, organizations can improve operational visibility and make better data-driven decisions.
Click here to read the Detailed blog post
Watch the step-by-step video tutorial:


