Board Game Startups Dashboard in Excel is a professionally designed, interactive analytics template built for board game entrepreneurs, tabletop gaming startups, indie game studios, and entertainment business analysts who need to track revenue, costs, profit margins, customer ratings, and funding performance across their board game product portfolio — all from one powerful, pivot-driven Excel Dashboard.
If you are running a board game startup and struggling to consolidate data from multiple product lines, funding rounds, distribution channels, and regional markets into one clear reporting view, this Board Game Startups Dashboard in Excel brings everything together into a professional, pivot-driven analytics hub. Simply enter your data in the Data sheet, refresh the pivots, and let the dashboard do the heavy lifting — giving you instant visibility into revenue trends, profit margins, customer satisfaction, and funding performance across every game category and market segment.
🔑 Key Features of Board Game Startups Dashboard in Excel
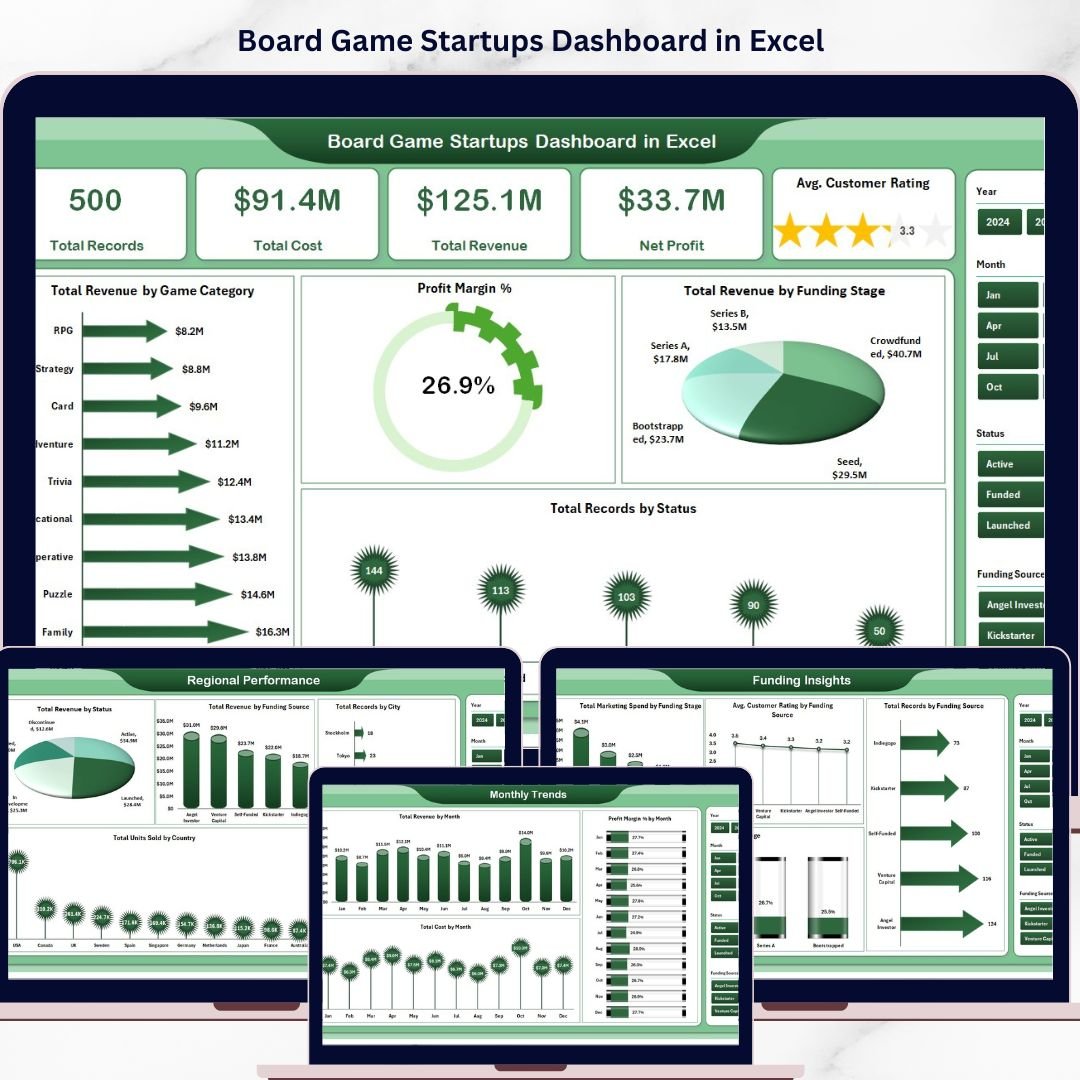
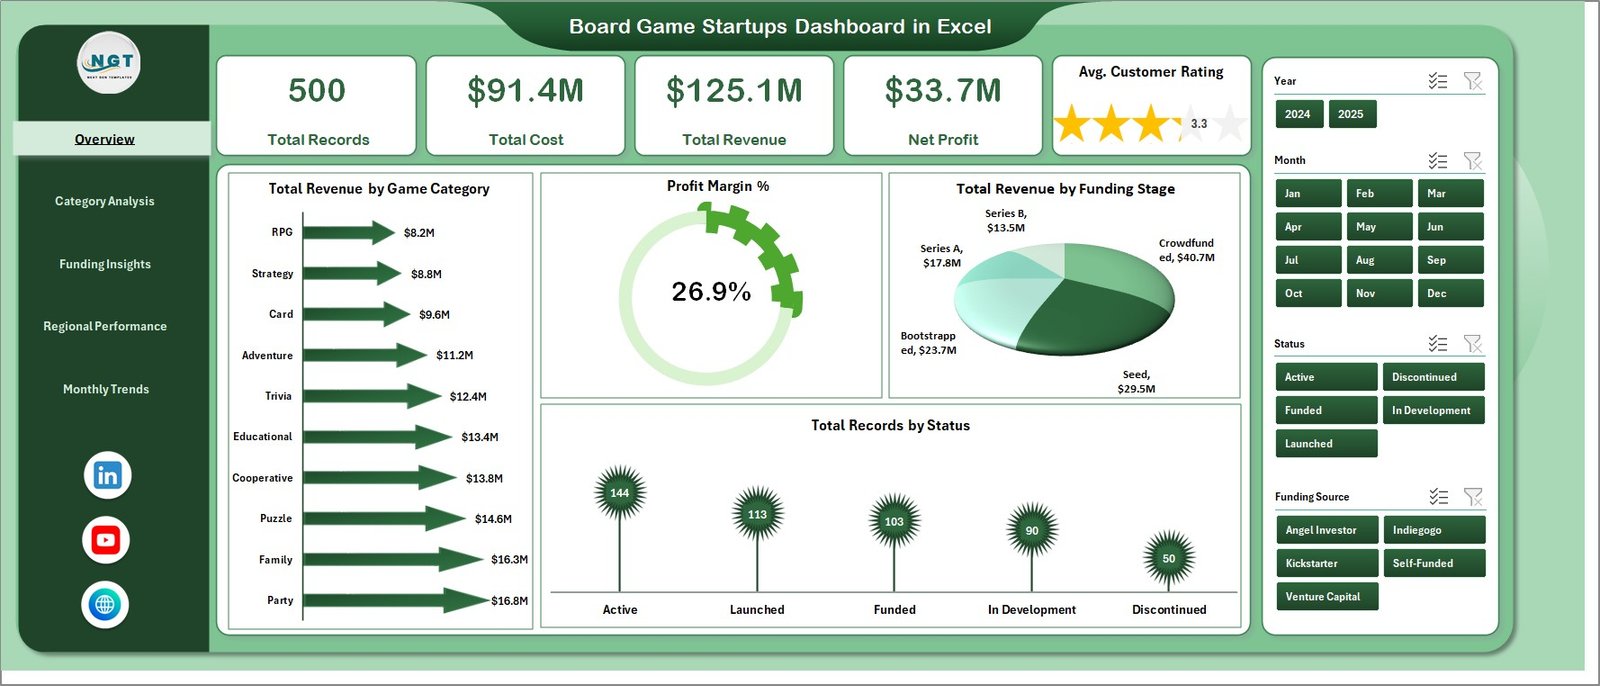
📊 Comprehensive KPI Cards — Monitor critical board game business metrics at a glance including Total Records, Total Cost, Total Revenue, Net Profit, and Avg. Customer Rating from dynamic KPI cards on the overview page that give decision-makers an instant snapshot of business health.
📈 Interactive Charts and Visualizations — Analyze board game startup performance through dynamic charts such as Total Revenue by Game Category, Profit Margin %, Total Revenue by Funding Stage, and Total Records by Status across five dedicated analysis pages.
🎯 Smart Slicers and Filters — Instantly filter your data by game category, funding stage, distribution channel, city, country, status, and more to drill down into the exact business insights you need for strategic decision-making.
📅 5 Dedicated Dashboard Pages — Explore Overview, Category Analysis, Funding Insights, Regional Performance, and Monthly Trends pages for a complete 360-degree view of your board game startup operations.
🔄 Fully Dynamic with Pivot Tables — Powered by pivot tables in the Support sheet so the entire dashboard updates automatically when you refresh the data. No complex formulas or VBA needed.
💾 Easy Data Entry — Simply add your operational data in the structured Data sheet and click Refresh All to update every chart, card, and analysis page instantly.
Board Game Startups Dashboard in Excel
📦 What’s Inside the Board Game Startups Dashboard in Excel
📌 Overview Page — High-level KPI cards displaying Total Records, Total Cost, Total Revenue, Net Profit, and Avg. Customer Rating. Interactive charts showing Total Revenue by Game Category, Profit Margin %, Total Revenue by Funding Stage, and Total Records by Status. Multiple slicers are available to apply filters and see the filtered dashboard quickly.
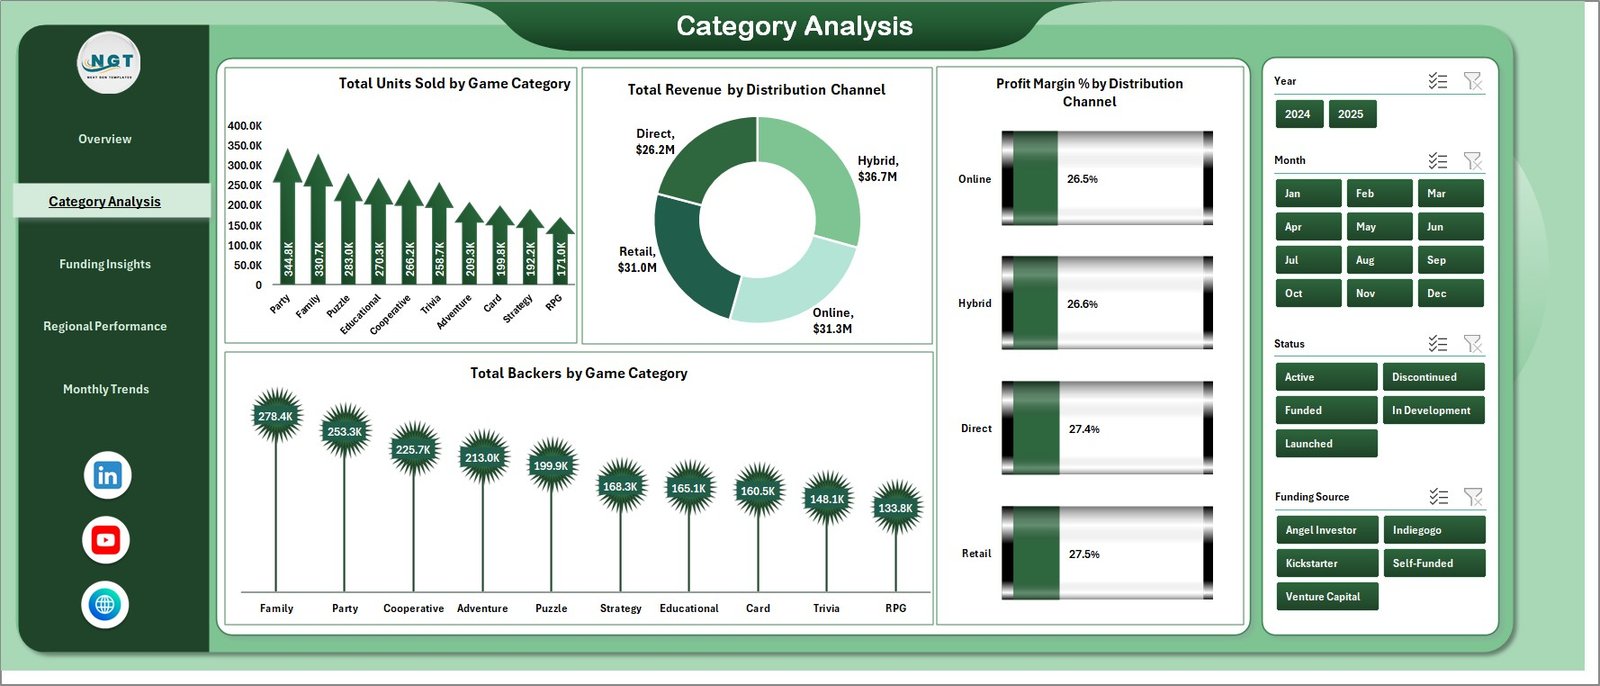
Category Analysis Page
📌 Category Analysis Page — Detailed breakdown of board game categories including Total Units Sold by Game Category, Total Revenue by Distribution Channel, Profit Margin % by Distribution Channel, and Total Backers by Game Category to understand which game types and channels drive the most revenue.
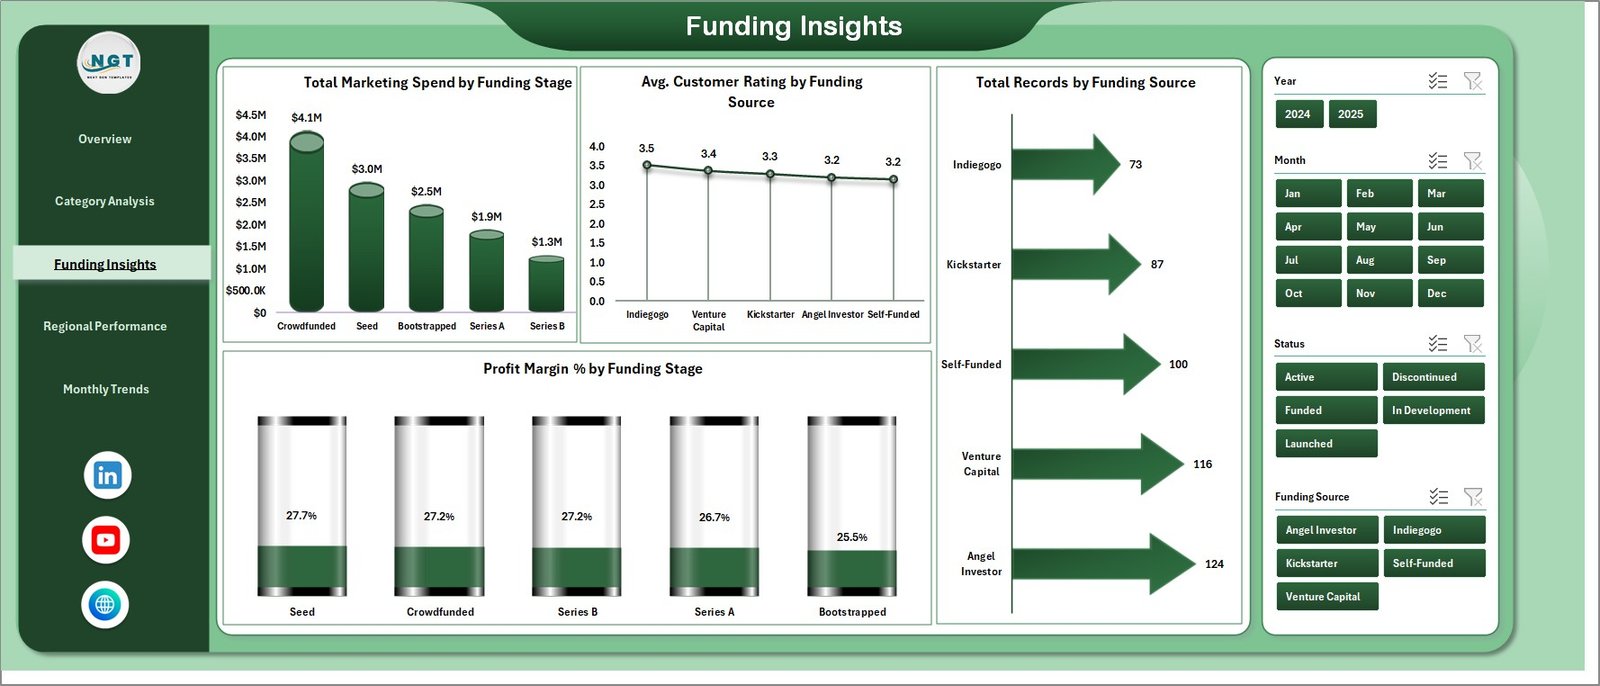
Funding Insights Page
📌 Funding Insights Page — Comprehensive funding analysis with Total Marketing Spend by Funding Stage, Avg. Customer Rating by Funding Source, Total Records by Funding Source, and Profit Margin % by Funding Stage to evaluate which funding sources deliver the best outcomes.
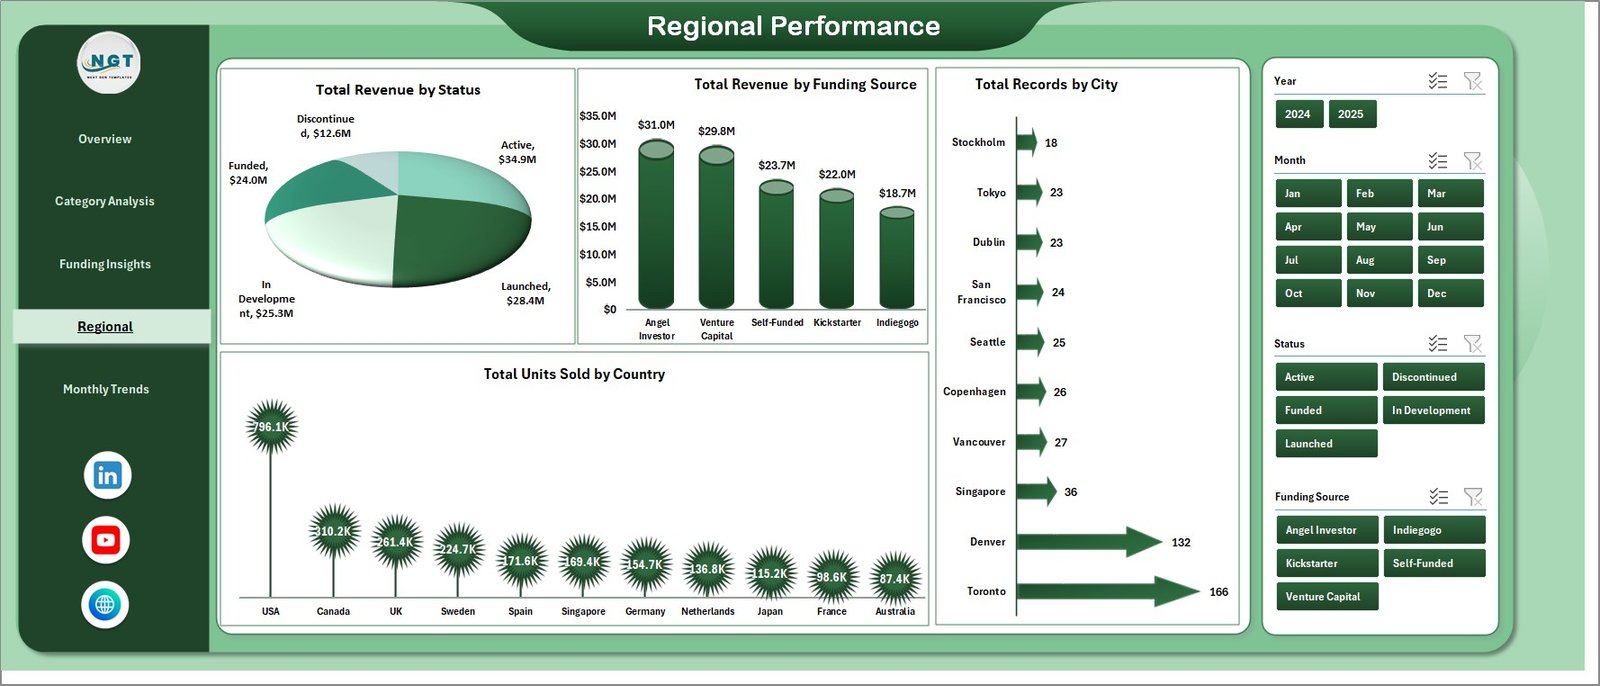
Regional Performance Page
📌 Regional Performance Page — Geographic breakdown of startup performance showing Total Revenue by Status, Total Revenue by Funding Source, Total Records by City, and Total Units Sold by Country to identify top-performing startup markets and regions.
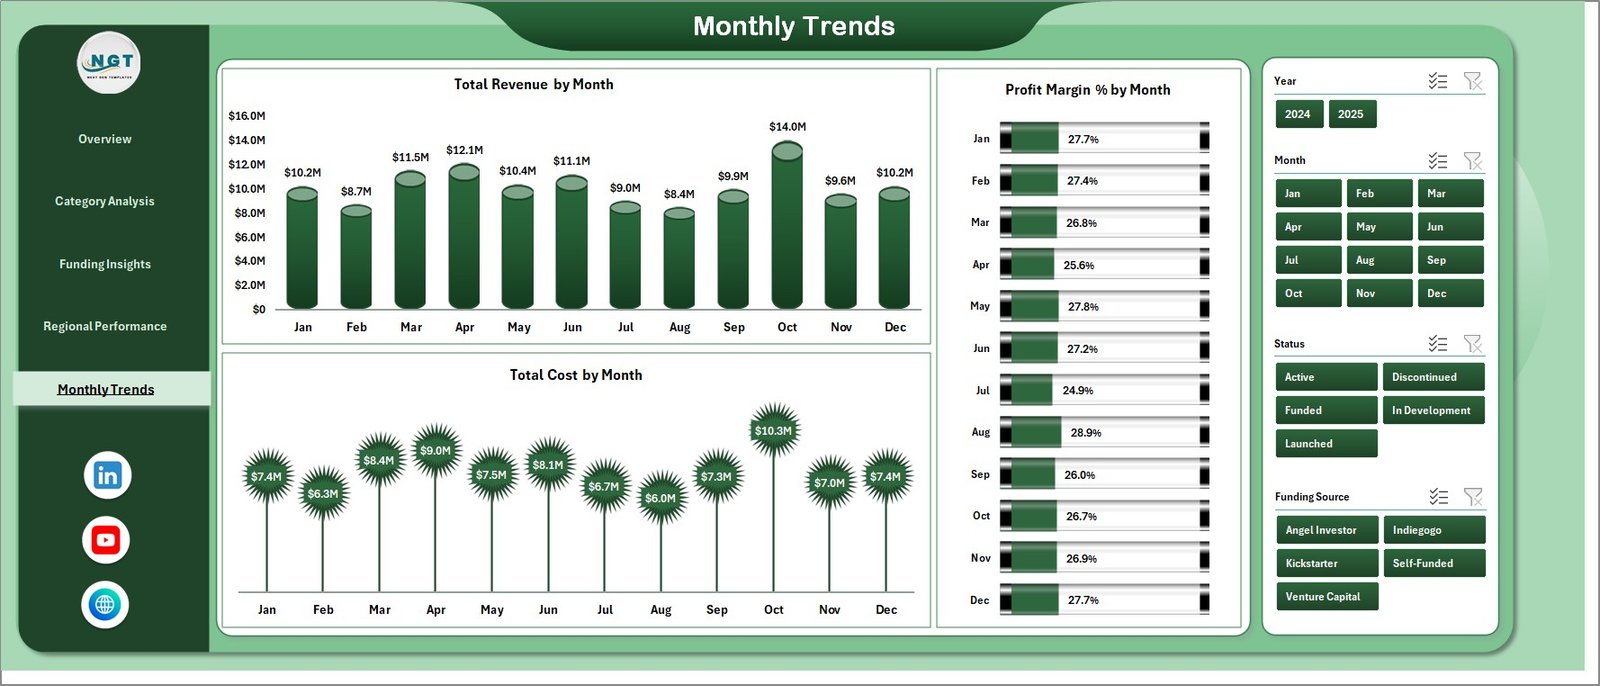
Monthly Trends Page
📌 Monthly Trends Page — Time-based analysis covering Total Revenue by Month, Profit Margin % by Month, and Total Cost by Month to help you identify seasonal patterns, growth trends, and cost fluctuations over time.
📌 Data Sheet — Structured data entry sheet where you input all your board game startup operational data in a clean tabular format. Simply replace the sample data with your own records keeping the same column structure.
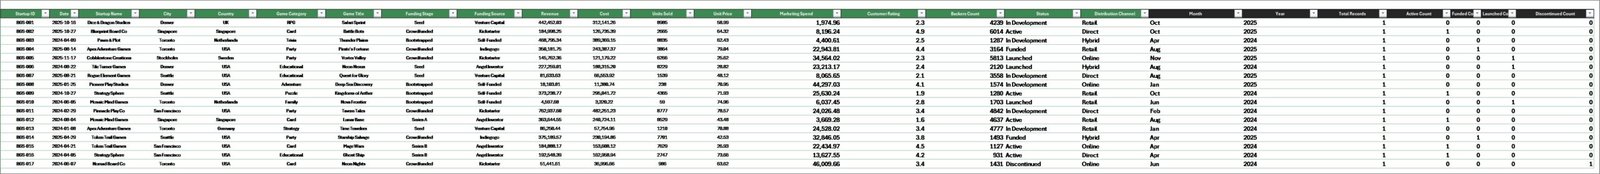
Data Sheet
📌 Support Sheet — Contains all pivot tables that power the dashboard dynamically. Go to the Data tab in the Excel Ribbon and click Refresh All after updating the data in the Data sheet. All pivots will be refreshed and all charts will be refreshed. You can keep this sheet hidden.
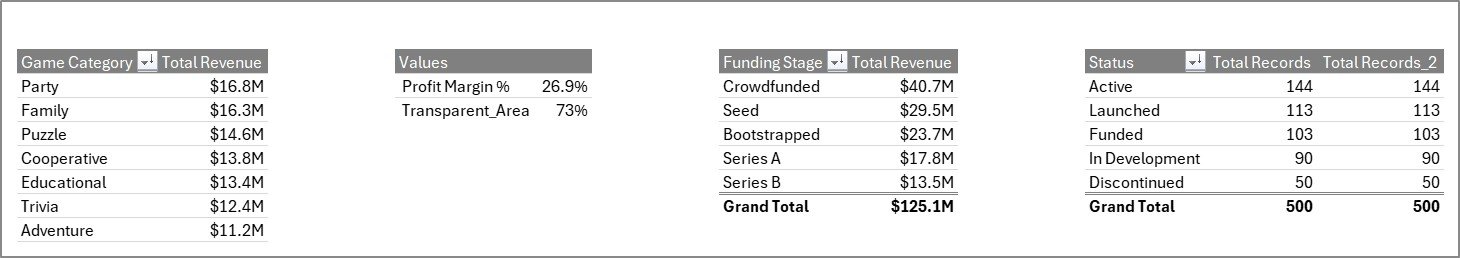
Support Sheet
⚙️ How to Use the Board Game Startups Dashboard in Excel
1️⃣ Download and Open — Download the Excel file and open it. Enable editing and macros if prompted.
2️⃣ Enter Your Data — Navigate to the Data sheet and replace the sample data with your actual board game startup records following the same column structure.
3️⃣ Refresh the Dashboard — Go to the Data tab in the Excel Ribbon and click Refresh All. All pivot tables in the Support sheet will update, and every chart and KPI card across all five dashboard pages will reflect your new data instantly.
4️⃣ Apply Filters — Use the slicers on each page to filter by game category, funding stage, distribution channel, status, region, or month to get targeted insights.
5️⃣ Analyze and Report — Navigate through the five dashboard pages to explore category performance, funding insights, regional data, and monthly trends for data-driven board game business decisions.
👥 Who Can Benefit from This Board Game Startups Dashboard in Excel
🎲 Board Game Entrepreneurs — Track revenue, costs, profit margins, and customer ratings across your entire product portfolio from one centralized dashboard.
🏢 Indie Game Studios — Monitor distribution channel effectiveness, funding utilization, and regional sales performance to optimize your go-to-market strategy.
📊 Tabletop Gaming Investors — Evaluate startup performance, funding stage progression, and profitability metrics to make informed investment decisions.
📋 Crowdfunding Campaign Managers — Analyze backer data, funding source effectiveness, and marketing spend ROI to optimize your next Kickstarter or crowdfunding campaign.
📈 Business Analysts — Leverage multi-dimensional analysis across categories, channels, regions, and time periods to build comprehensive board game industry reports.
🎓 Academic Researchers — Use the structured data format and visual analytics for research into gaming industry startups, entertainment business models, and entrepreneurship case studies.
📖 Click here to read the Detailed Blog Post
🎥 Visit our YouTube channel to learn step-by-step video tutorials
👉 YouTube.com/@NextGenTemplates


Reviews
There are no reviews yet.