
In today’s fast-paced biotech and life sciences industry, companies generate massive volumes of complex data every day. However, turning that data into meaningful insights is still a challenge for many professionals. As a result, decision-making becomes slow, inefficient, and sometimes inaccurate.
So, how can you track funding, valuation, revenue, innovation, and business performance in one place without switching between multiple reports?
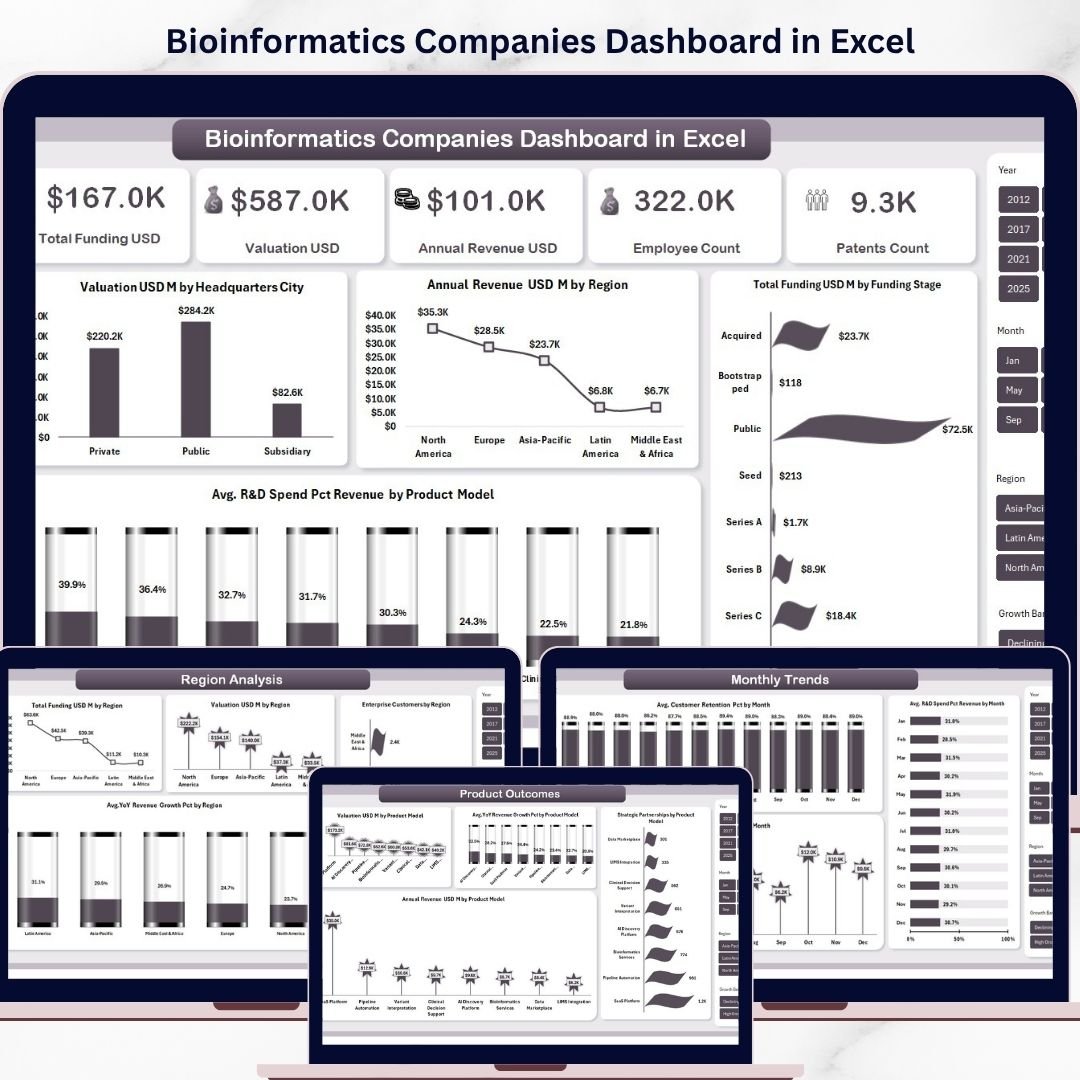
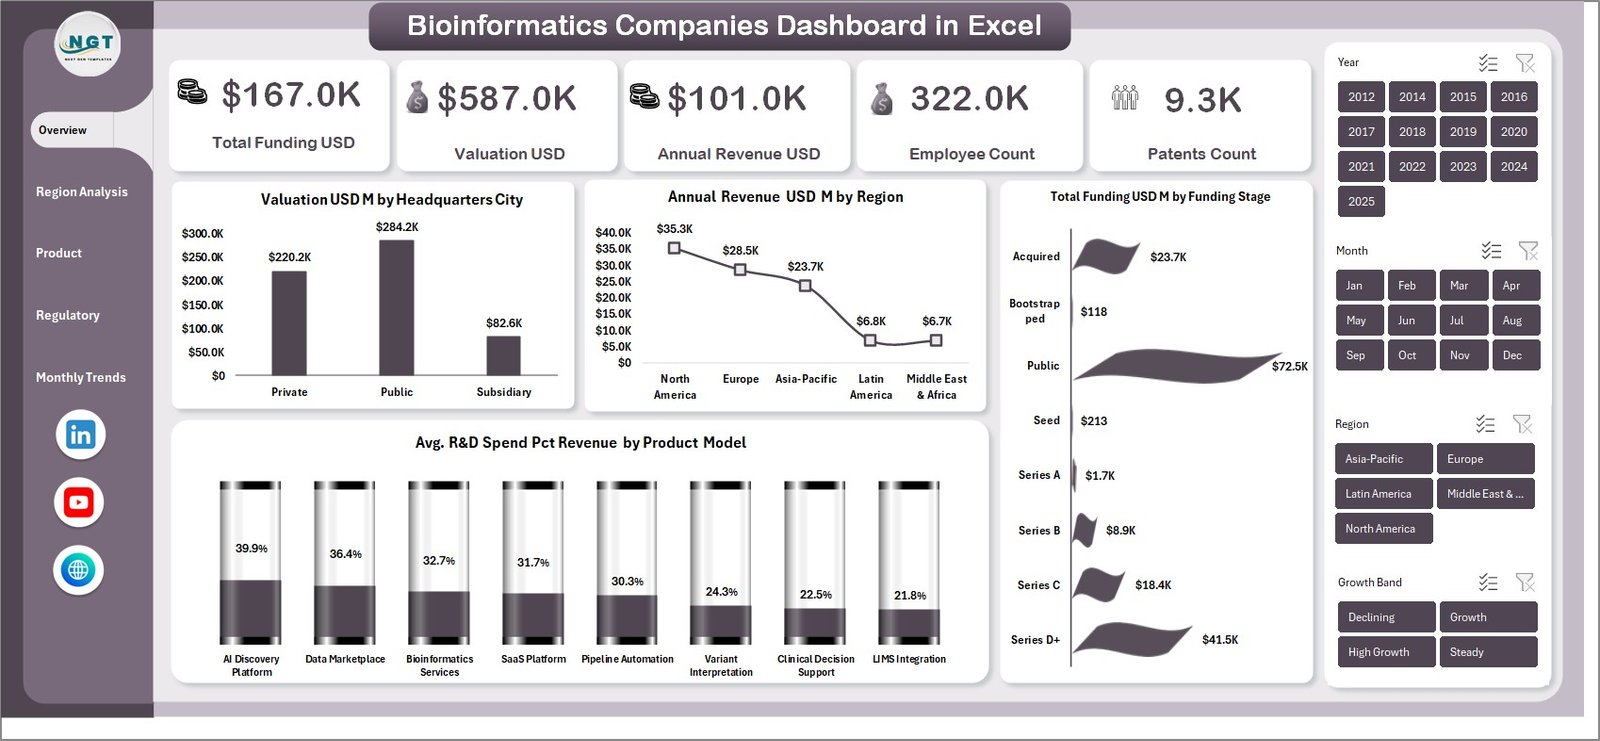
👉 The answer is simple: Bioinformatics Companies Dashboard in Excel
This powerful, ready-to-use Excel dashboard helps you transform raw data into clear, actionable insights. Whether you are analyzing funding trends, monitoring R&D investments, or comparing regional performance, this dashboard gives you complete control over your data.
Instead of working with scattered spreadsheets, you get a centralized, interactive platform that allows you to analyze key metrics instantly. Therefore, you can identify trends faster, uncover opportunities, and make smarter business decisions.
🚀 Key Features of Bioinformatics Companies Dashboard in Excel
📊 Interactive Overview Dashboard – Get a complete snapshot of performance with KPI cards like Total Funding, Valuation, Revenue, Employee Count, and Patents.
🌍 Region-Based Analysis – Understand geographical performance with insights on funding, valuation, enterprise customers, and growth trends.
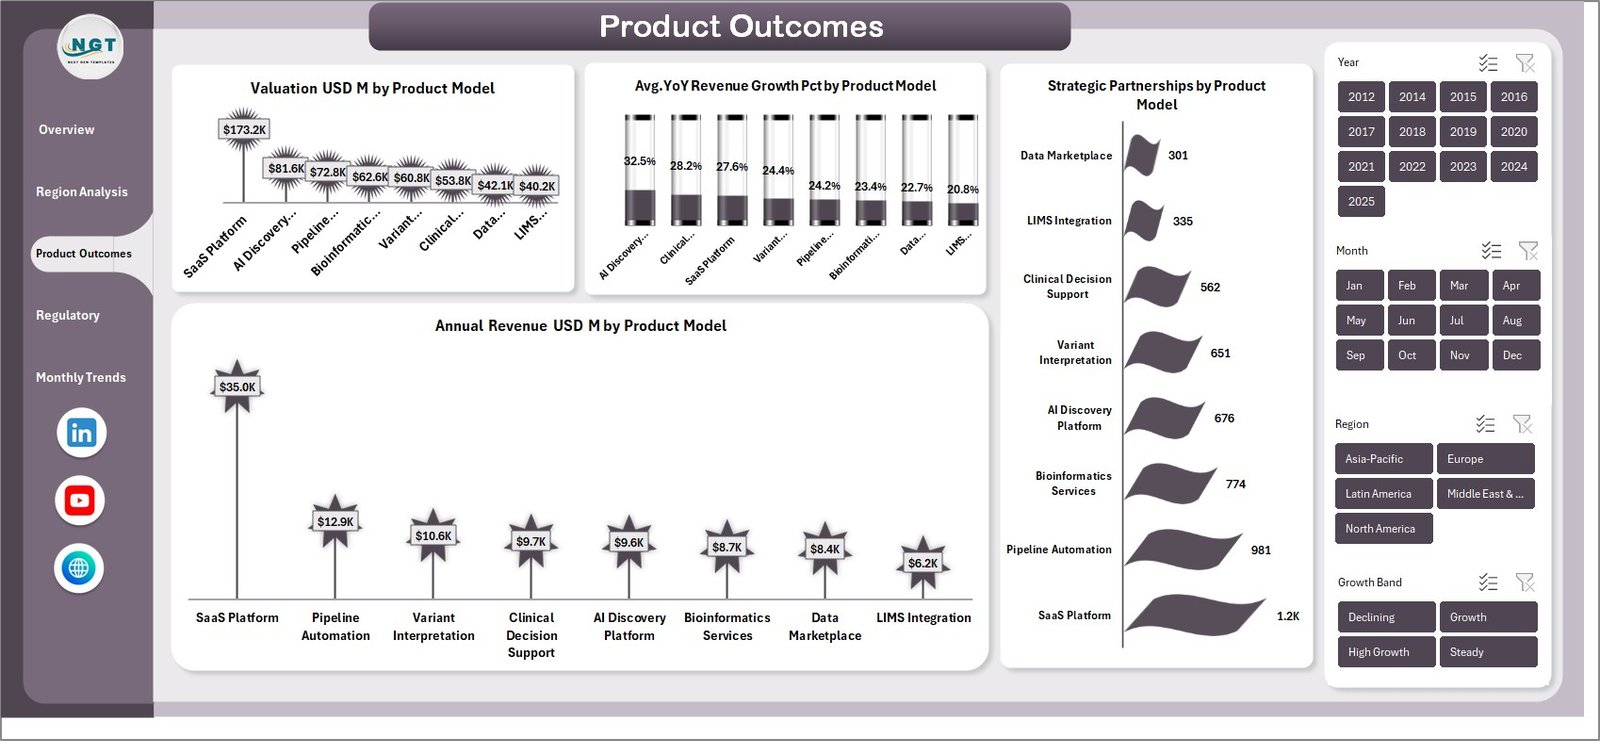
🧬 Product Performance Insights – Analyze which product models drive higher revenue, valuation, and partnerships.
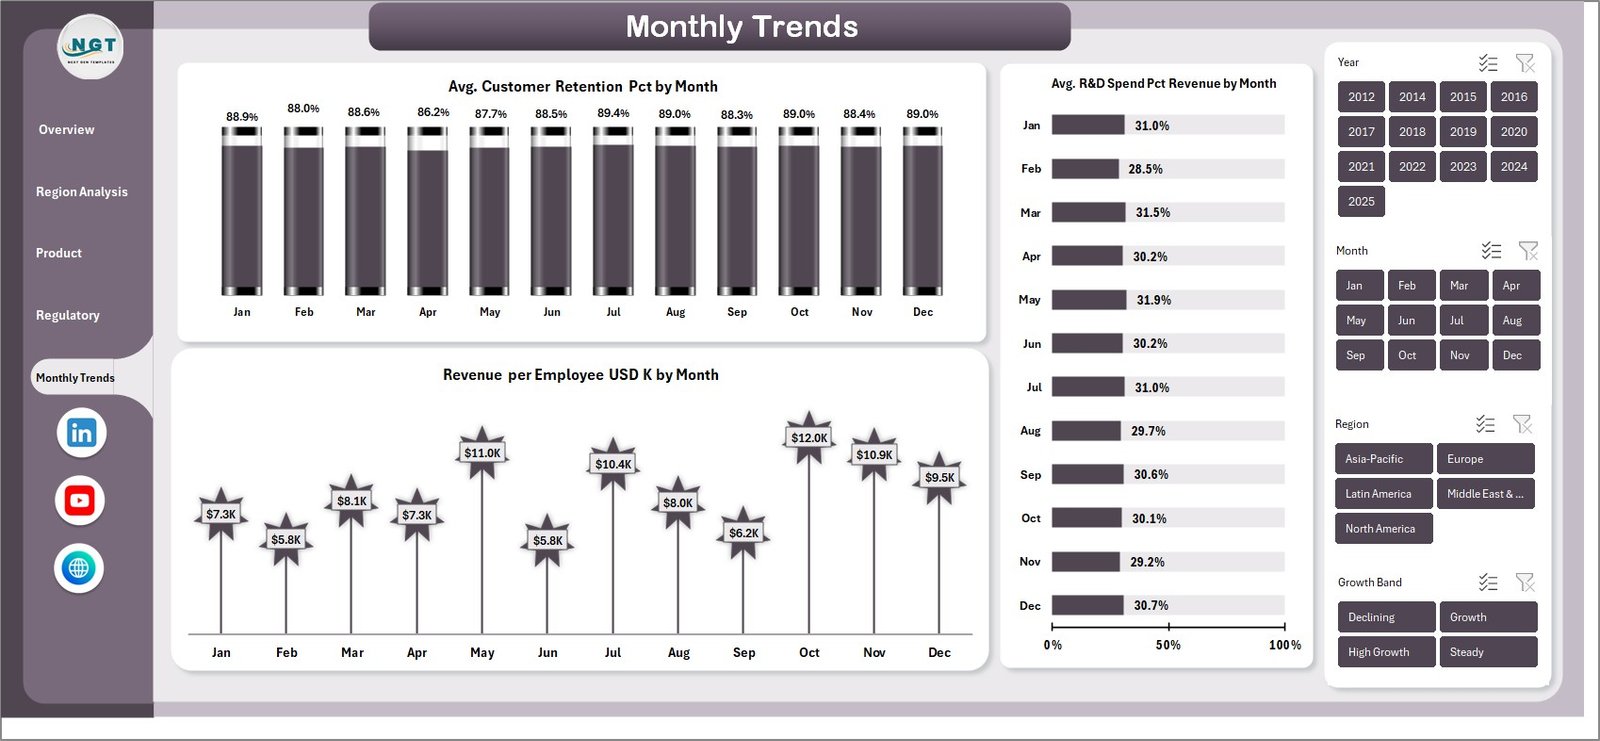
📈 Advanced Trend Analysis – Monitor monthly trends such as customer retention, R&D spending, and revenue per employee.
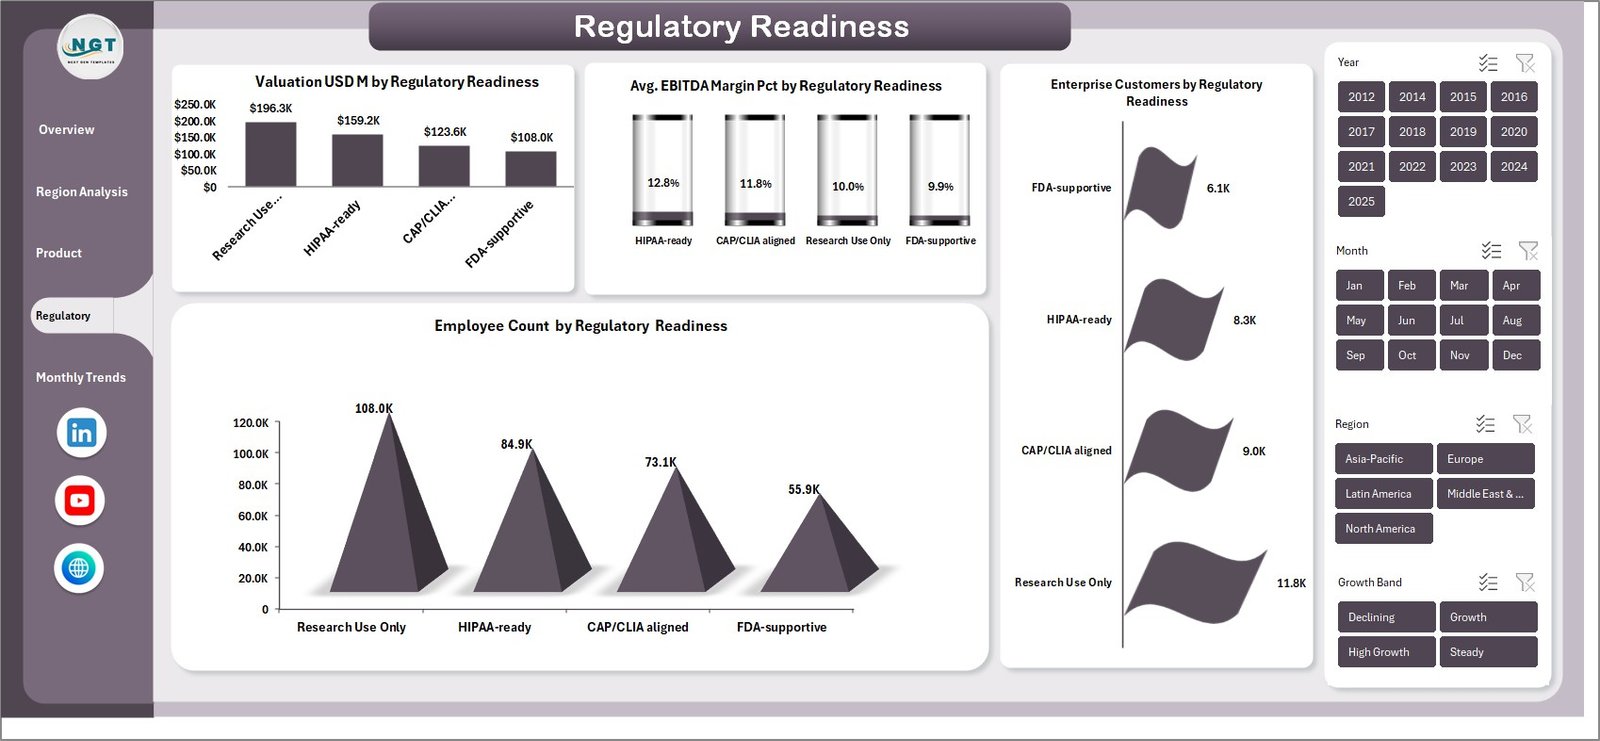
📑 Regulatory Readiness Tracking – Evaluate compliance impact on profitability, workforce, and customer trust.
⚡ Dynamic Filters & Slicers – Instantly filter data and customize views for deeper insights.
📉 Automated Calculations – Reduce manual work and minimize errors with built-in formulas.
📦 What’s Inside the Bioinformatics Companies Dashboard in Excel
This Excel template includes multiple professionally designed sheets to give you complete business visibility:
✔️ Overview Page – High-level KPIs and visual charts for quick insights
✔️ Region Analysis Page – Compare performance across different regions
✔️ Product Outcomes Page – Evaluate product-based performance metrics
✔️ Regulatory Readiness Page – Track compliance and its business impact
✔️ Monthly Trends Page – Analyze performance changes over time
Each sheet is designed with interactive charts and easy navigation, ensuring a smooth user experience.
⚙️ How to Use the Bioinformatics Companies Dashboard in Excel
Using this dashboard is simple and user-friendly:
1️⃣ Input Your Data – Enter your company data such as funding, revenue, employees, and R&D metrics
2️⃣ Use Slicers & Filters – Select regions, product models, or time periods
3️⃣ Analyze Insights – View automated charts and KPIs
4️⃣ Make Decisions – Identify trends, gaps, and growth opportunities
Within minutes, you can turn raw data into powerful insights without advanced technical skills.
👨💼 Who Can Benefit from This Bioinformatics Companies Dashboard in Excel
This dashboard is ideal for:
👨💼 Business Analysts – Track performance and generate insights
📊 Data Analysts – Analyze large datasets efficiently
🧪 Bioinformatics Researchers – Monitor innovation and R&D performance
💰 Investors & Venture Capitalists – Evaluate company growth and potential
🏢 Executives & Decision Makers – Make data-driven strategic decisions
Whether you are a startup or an established biotech company, this dashboard helps you stay ahead in a competitive market.
By using this dashboard, you can streamline your reporting process, improve data accuracy, and make faster decisions. Instead of spending hours creating reports, you can focus on strategy and growth.
🚀 Don’t let your data sit idle — transform it into actionable insights today!


