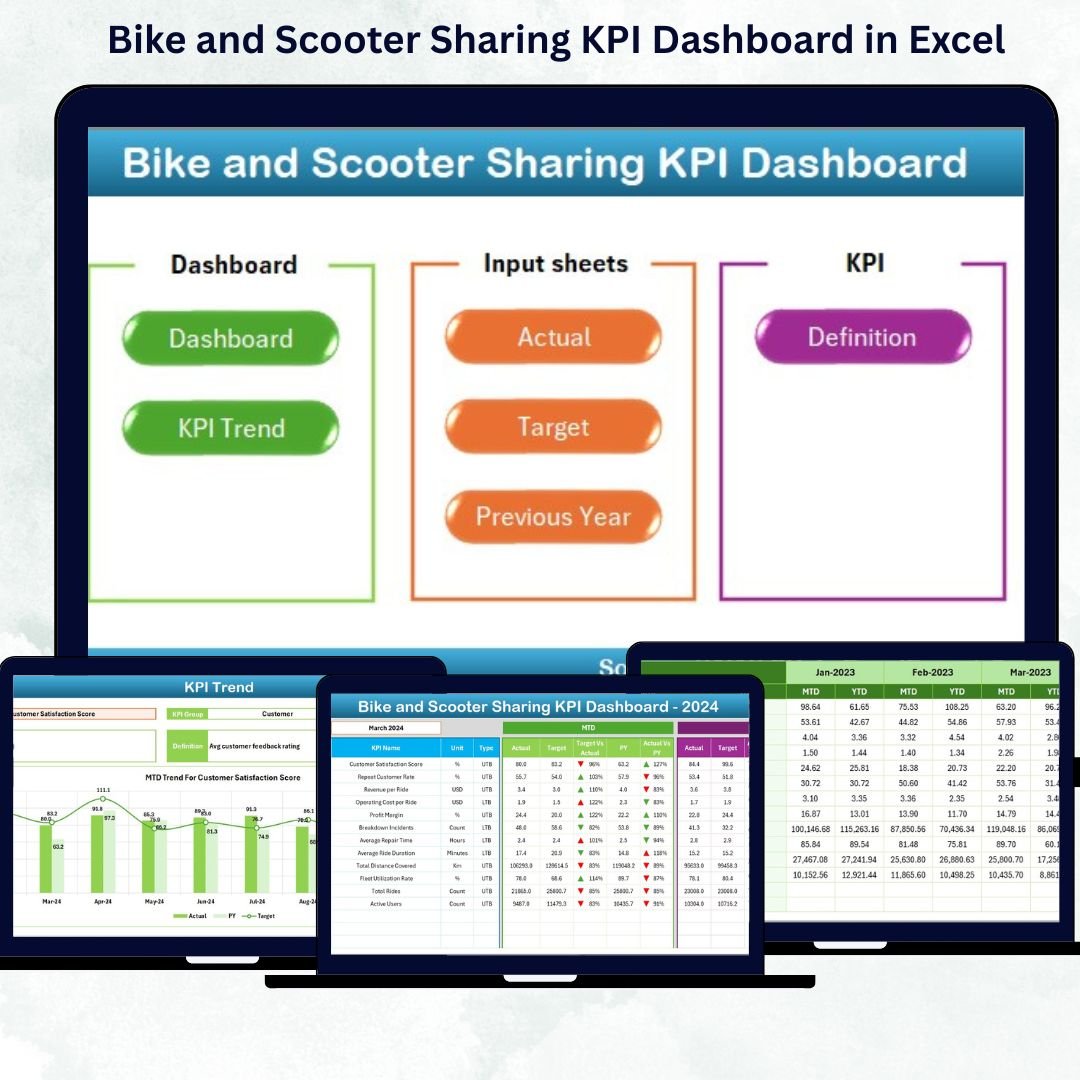
In the era of smart mobility and sustainable transport, managing bike and scooter sharing operations efficiently is vital for success. From user satisfaction and ride utilization to maintenance costs and downtime — every KPI tells a story about your fleet’s performance.
That’s where the Bike and Scooter Sharing KPI Dashboard in Excel becomes your ultimate performance companion. 🎯 This ready-to-use Excel dashboard simplifies performance tracking, trend analysis, and decision-making — all within the comfort of Microsoft Excel. No coding, no complex setup, just clear insights at your fingertips!
⚙️ Key Features of the Bike and Scooter Sharing KPI Dashboard in Excel
📊 Comprehensive KPI Monitoring – Track utilization rate, maintenance cost, revenue per ride, downtime %, and customer satisfaction — all in one place.
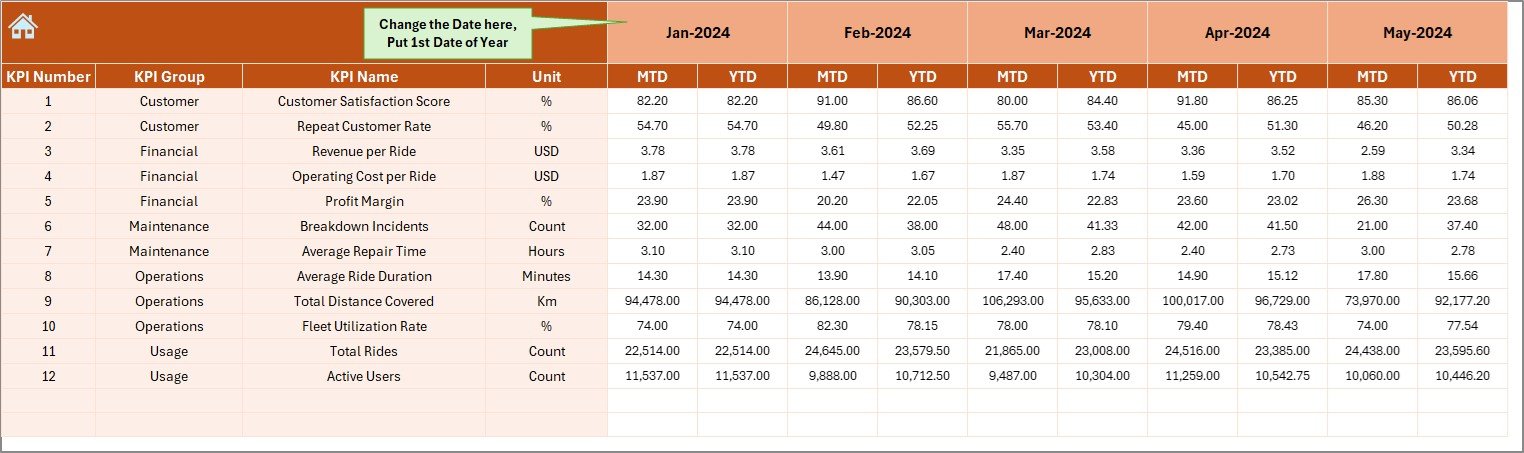
📆 Dynamic Month Selector (Cell D3) – Instantly switch between months to view updated metrics for MTD (Month-to-Date) and YTD (Year-to-Date).
📈 Target vs Actual vs Previous Year – Compare how your fleet is performing against business goals with conditional formatting using up/down arrows.
💡 Interactive Navigation Buttons – Move across pages effortlessly with the Home sheet buttons.
🧮 Seven Analytical Sheets – Each sheet is purpose-built for a specific analytical view — from input to visualization.
🧭 Customizable and Scalable – Easily adapt the dashboard to your organization’s KPIs, regions, or fleets.
🚦 Conditional Formatting – Green and red arrows make trends instantly visible for better decision-making.
🔒 No Add-ins or Macros – 100% Excel-based, lightweight, and compatible with both Windows and Mac.
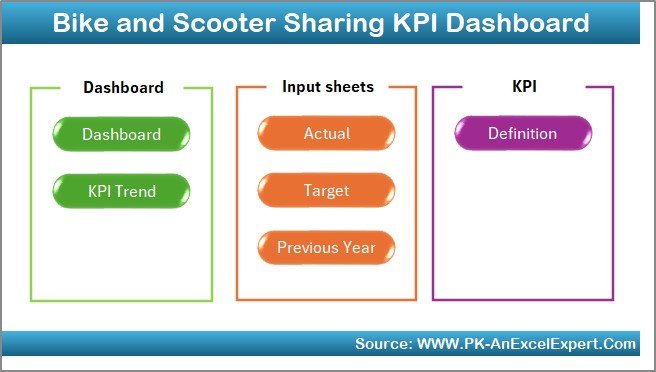
📂 What’s Inside the Bike and Scooter Sharing KPI Dashboard in Excel
🛠️ 1. Home Sheet: The central navigation hub that lets you jump to any analytical sheet. You can also customize it with your logo and colors.
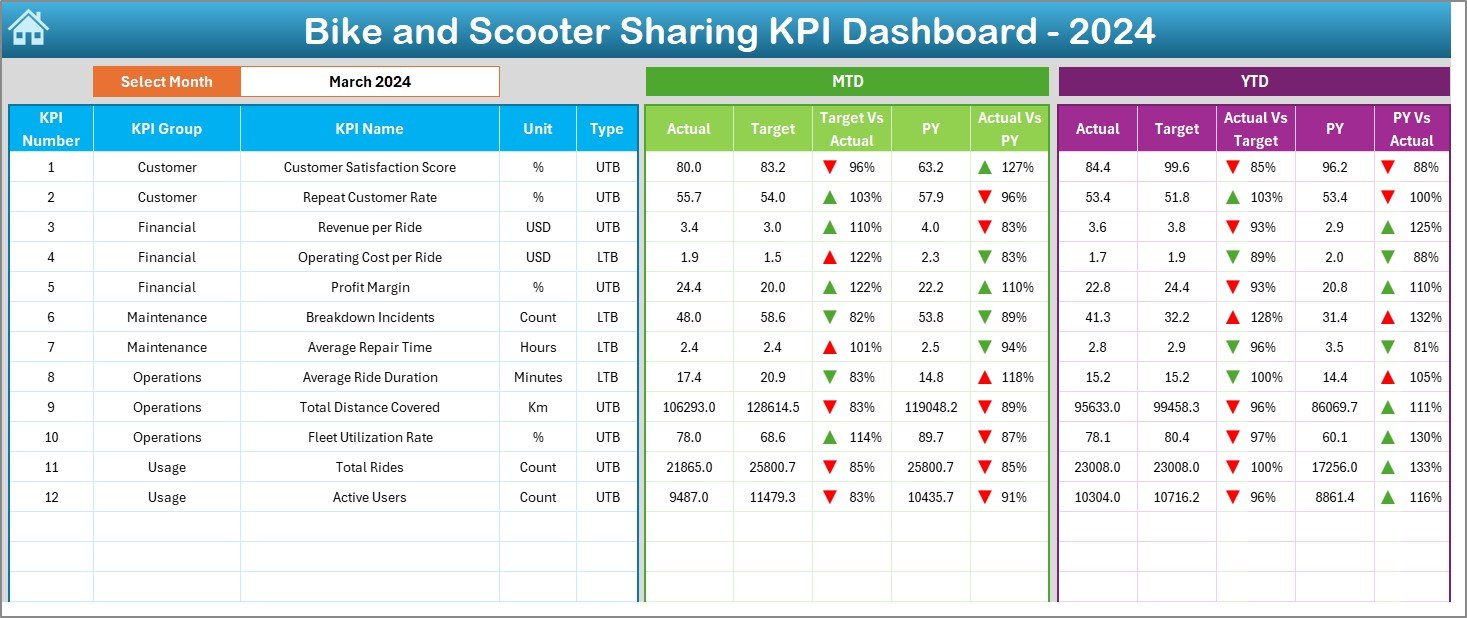
📊 2. Dashboard Sheet: The heart of your analysis — view all KPIs with dynamic month selection and visual comparisons of Actual, Target, and Previous Year data.
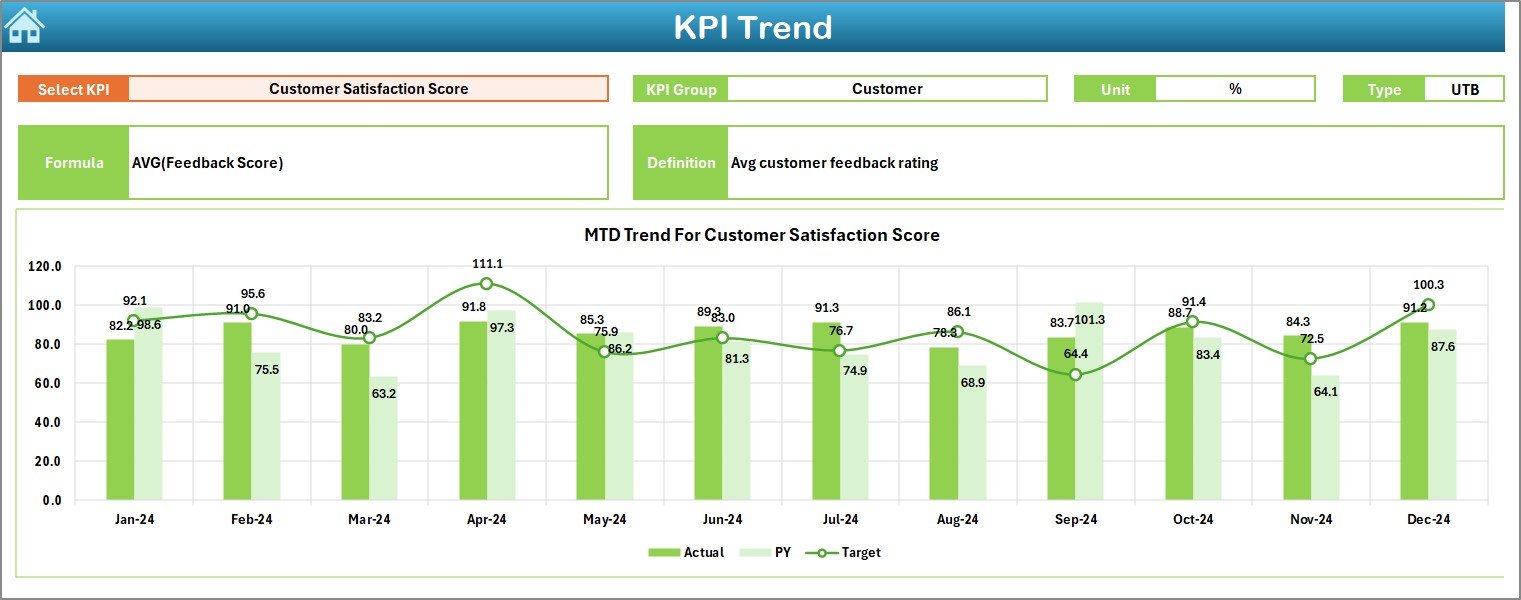
📈 3. KPI Trend Sheet: Choose any KPI from the dropdown (cell C3) to view its trend over time. Analyze MTD/YTD progress, formula, and performance patterns easily.
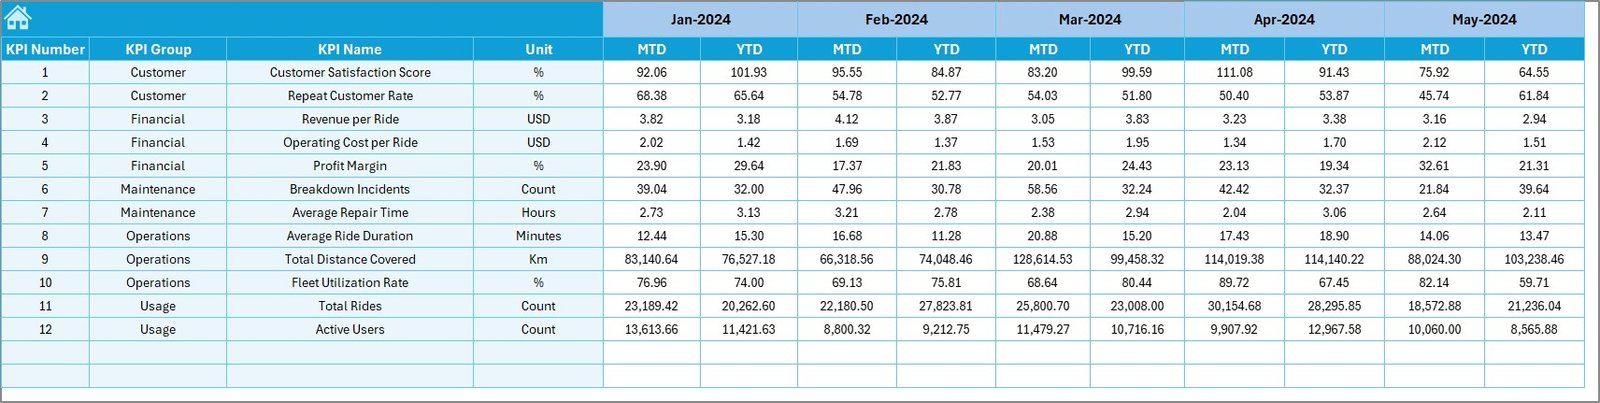
📋 4. Actual Numbers Input Sheet: Record your monthly MTD and YTD data here. This sheet drives real-time visuals in the dashboard automatically.
🎯 5. Target Sheet: Enter performance goals (MTD/YTD) to measure whether you’re on track or lagging behind.
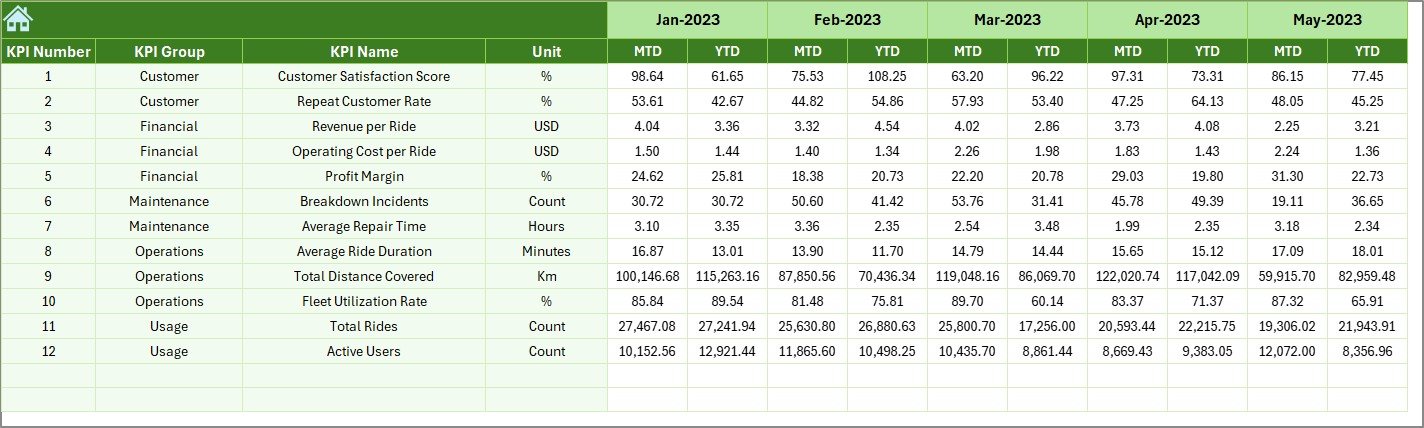
📉 6. Previous Year Sheet: Maintain last year’s data to benchmark growth and long-term progress.
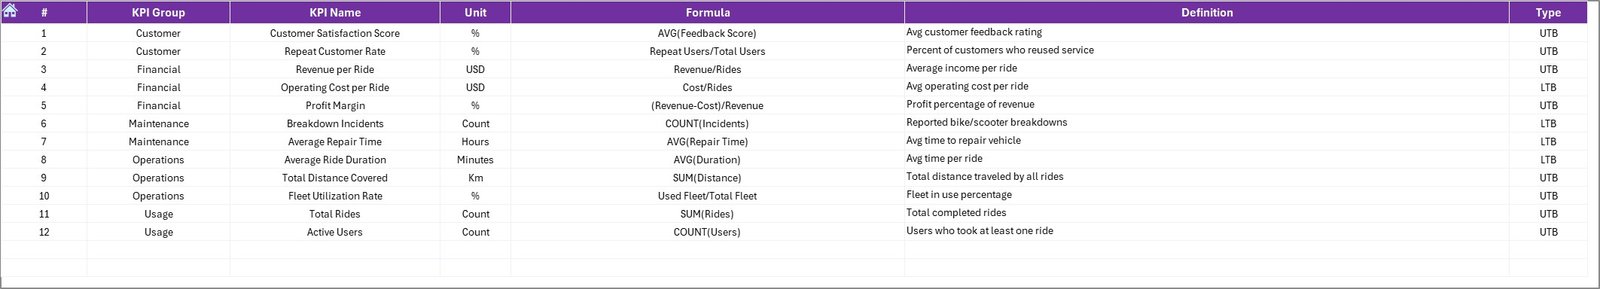
📘 7. KPI Definition Sheet: A reference hub for all your KPIs — including definitions, units, formulas, and whether the KPI is LTB (Lower the Better) or UTB (Upper the Better).
This structure ensures your entire reporting process — from data entry to management presentation — runs seamlessly and efficiently.
🧭 How to Use the Bike and Scooter Sharing KPI Dashboard in Excel
1️⃣ Enter Actual Data – Input monthly metrics into the Actual Numbers Input sheet.
2️⃣ Add Targets – Fill in target KPIs for MTD/YTD in the Target sheet.
3️⃣ Include Previous Year Data – Enter last year’s results for benchmarking.
4️⃣ Choose KPI or Month – Use dropdowns and slicers to explore data dynamically.
5️⃣ View the Dashboard – Instantly visualize performance across time, KPI type, or department.
6️⃣ Analyze & Present – Use visuals in management meetings or export them as PDFs.
💡 Tip: Combine this Excel dashboard with Power Query or VBA to automate monthly updates for a more advanced setup.
👥 Who Can Benefit from This Dashboard
🏢 Operations Managers: Track fleet uptime, utilization, and maintenance efficiency.
💰 Finance Teams: Evaluate cost per ride, total revenue, and profitability metrics.
📣 Marketing Managers: Monitor customer satisfaction and growth rates for promotions.
🧭 Executives: Gain a bird’s-eye view of company-wide KPIs and decision insights.
🚲 City Planners & Analysts: Use data to assess service coverage, demand, and sustainability.
Whether you run a small urban fleet or a large-scale sharing network, this dashboard delivers precision, control, and clarity — empowering you to make smarter, faster, data-backed decisions.


Reviews
There are no reviews yet.