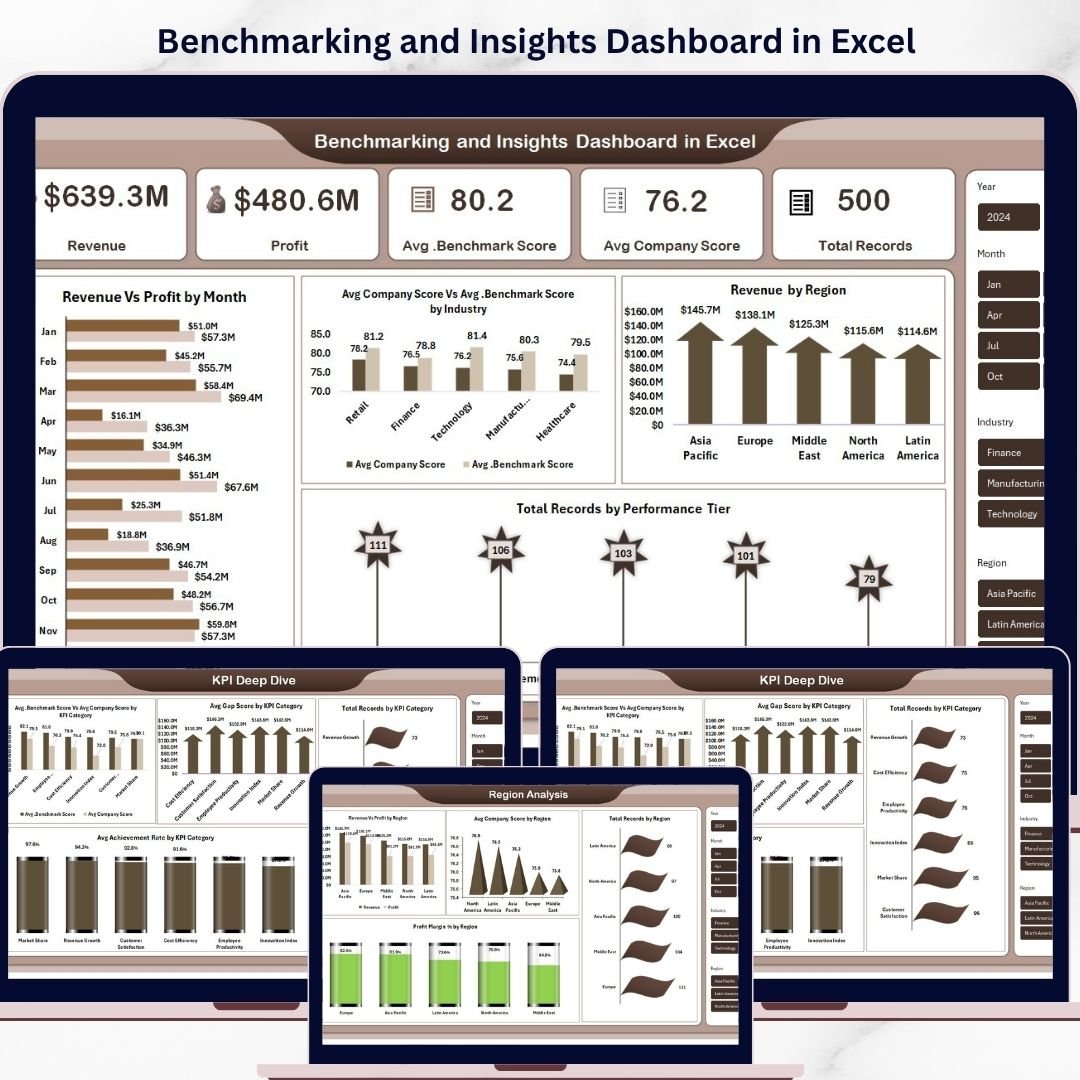
Are you still struggling to compare your business performance with industry standards? Stop wasting hours on manual reports and scattered data. The Benchmarking and Insights Dashboard in Excel is a powerful, ready-to-use solution designed to help you track, compare, and analyze your business performance effortlessly.
This dynamic Excel dashboard gives you complete visibility into your revenue, profit, KPI performance, and benchmarking scores. Whether you are a business owner, analyst, or manager, this tool enables you to make faster and smarter decisions using real-time insights.
With interactive visuals and easy-to-use features, you can quickly identify performance gaps, compare your company against industry benchmarks, and uncover hidden opportunities for growth.
🚀 Key Features of Benchmarking and Insights Dashboard in Excel
✨ Interactive Overview Dashboard – Get a complete snapshot of revenue, profit, and performance metrics in one place
📊 Benchmark vs Company Comparison – Easily compare your company’s performance with industry standards
📈 Dynamic Charts & Visuals – Analyze trends with visually appealing charts like revenue vs profit, score comparisons, and more
🌍 Region-Based Analysis – Understand performance across different regions for better strategic decisions
🏭 Industry Insights – Dive deep into industry-wise revenue, profit, and performance metrics
📌 KPI Deep Dive Analysis – Evaluate KPI categories with detailed benchmarking and achievement rates
⚡ Automated Calculations – Reduce manual effort with built-in formulas and calculations
🎯 Performance Tier Analysis – Identify top-performing and underperforming segments quickly
🔄 Easy Customization – Modify the dashboard as per your business needs without advanced Excel skills
📦 What’s Inside the Benchmarking and Insights Dashboard in Excel
This Excel template comes with multiple well-structured sheets designed for complete analysis:
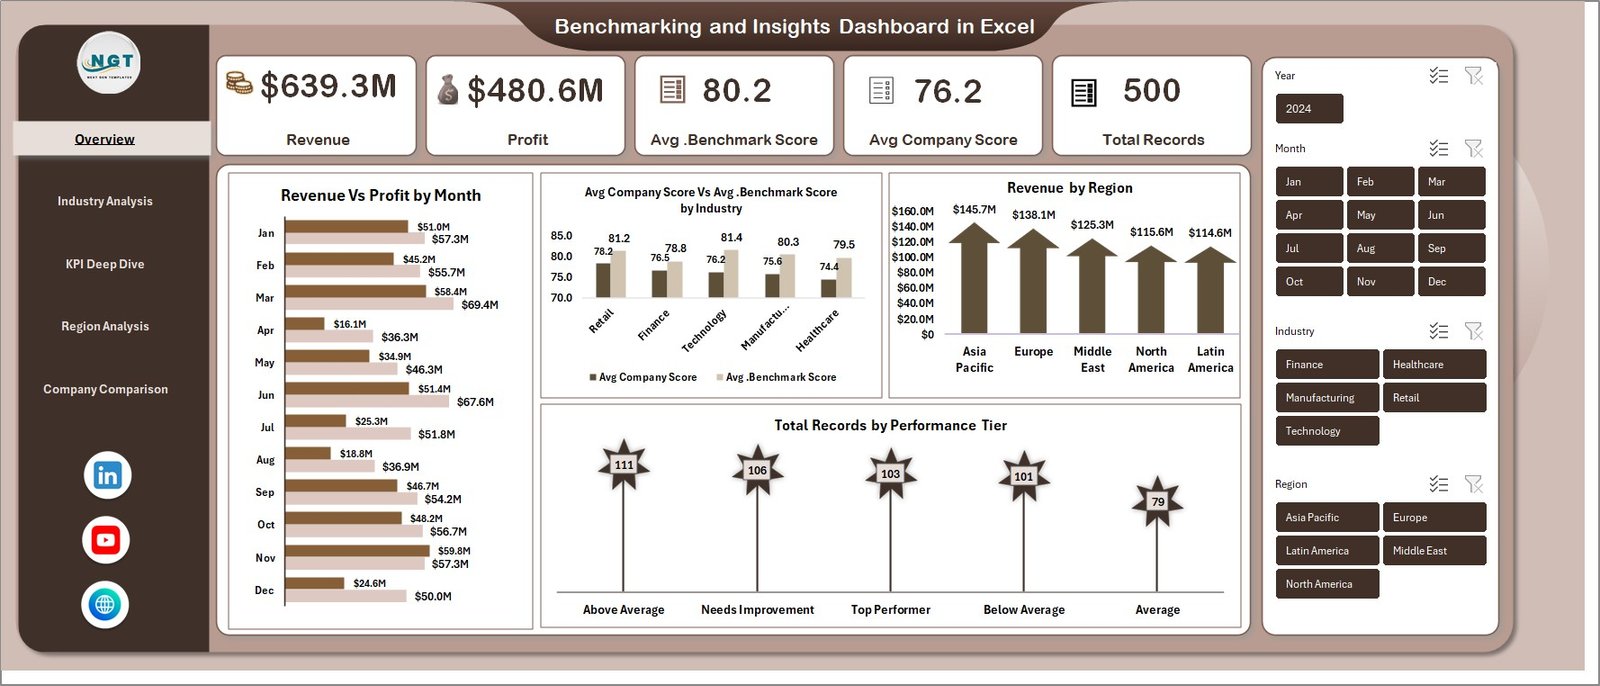
📊 Overview Sheet
- Revenue, Profit, Avg. Benchmark Score, Avg. Company Score
- Revenue vs Profit by Month
- Score Comparison by Industry
- Revenue by Region
- Performance Tier Distribution
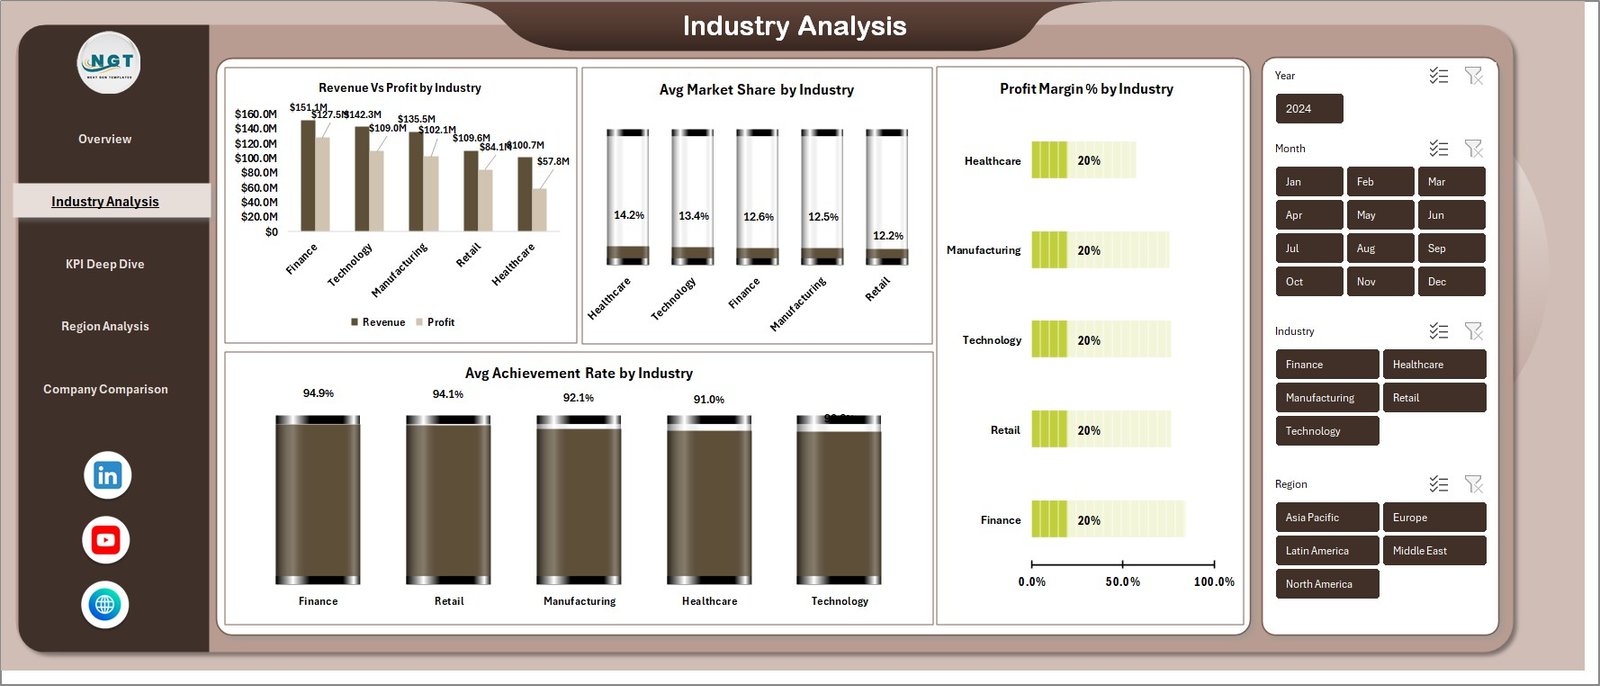
🏭 Industry Analysis Sheet
- Revenue vs Profit by Industry
- Market Share Analysis
- Profit Margin % by Industry
- Achievement Rate by Industry
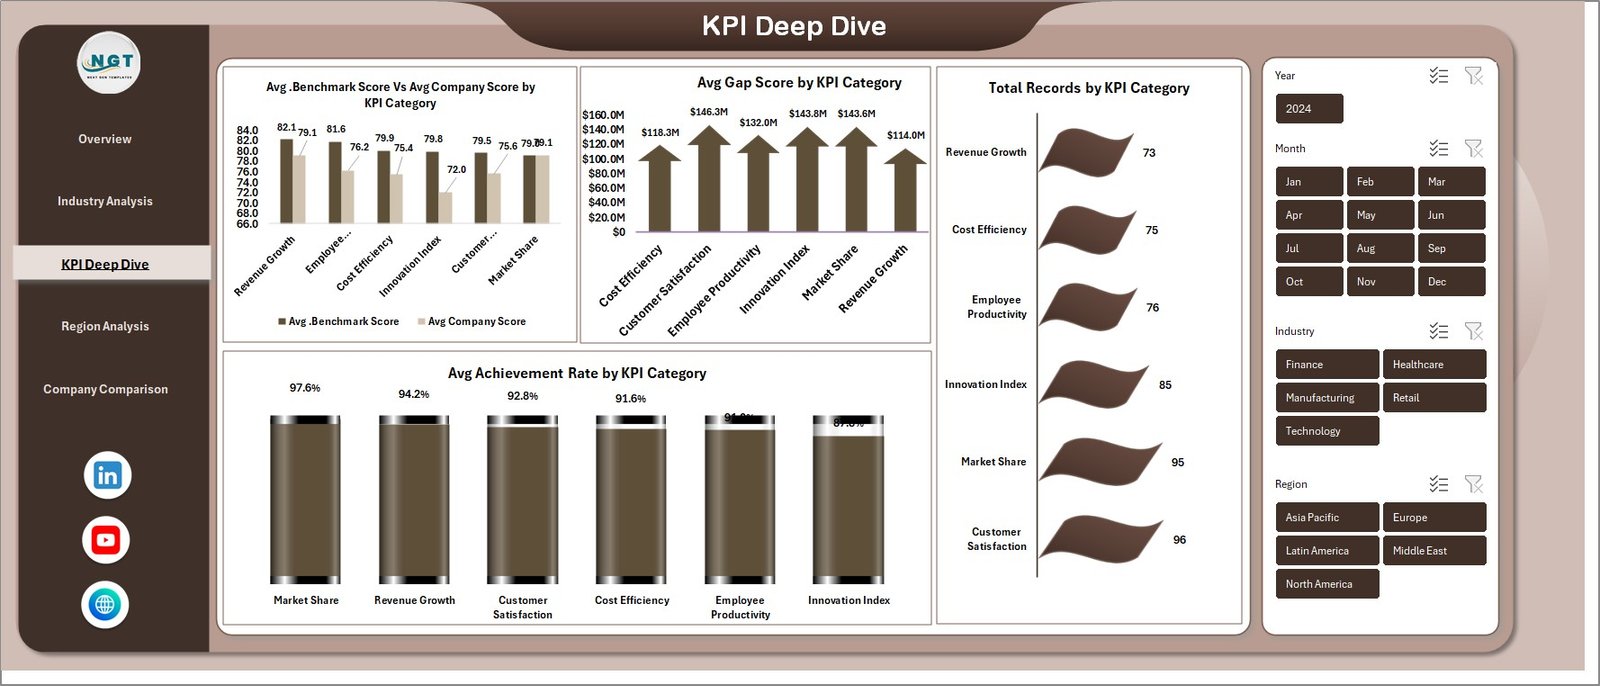
📌 KPI Deep Dive Sheet
- Benchmark vs Company Score by KPI Category
- Cost Analysis by KPI Category
- Total Records and Achievement Rate
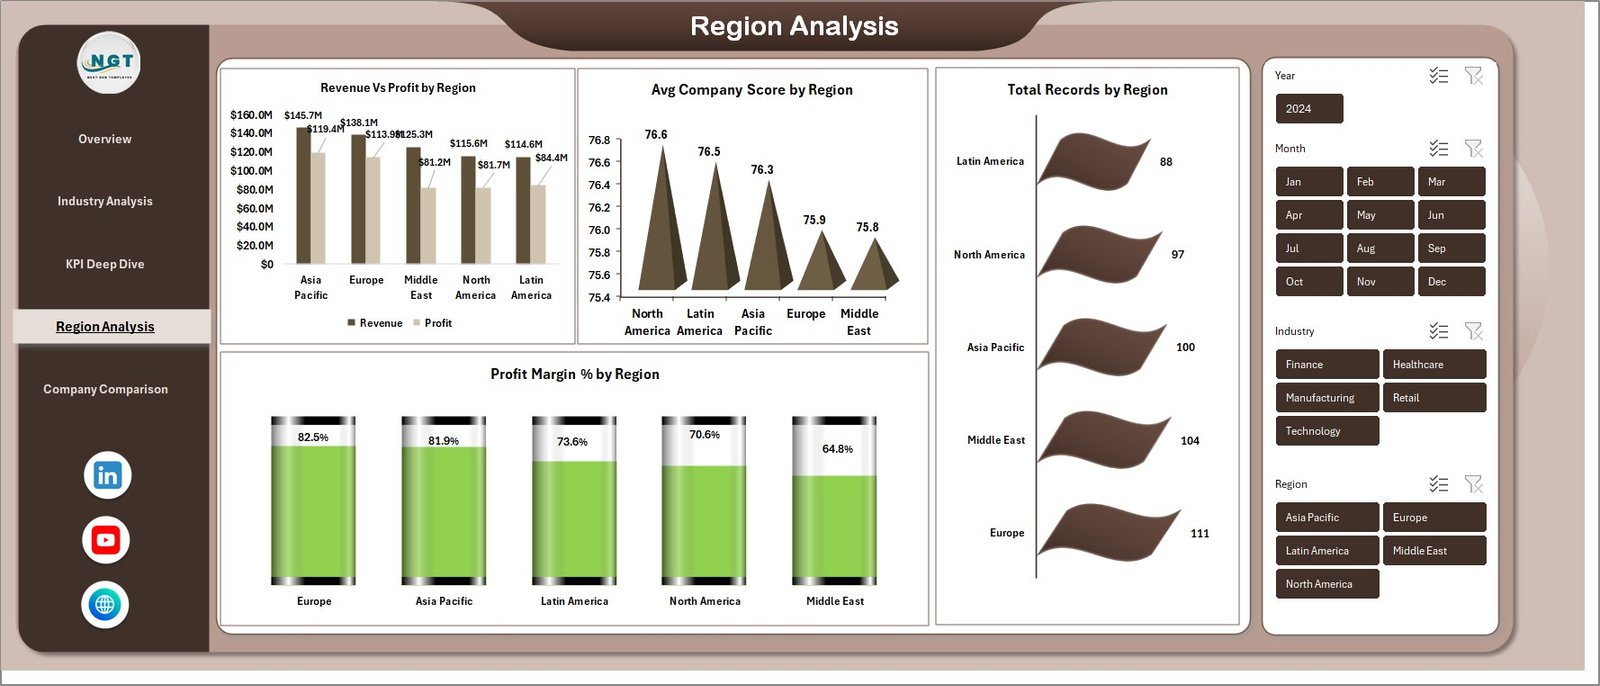
🌍 Region Analysis Sheet
- Revenue vs Profit by Region
- Company Score by Region
- Profit Margin % and Record Distribution
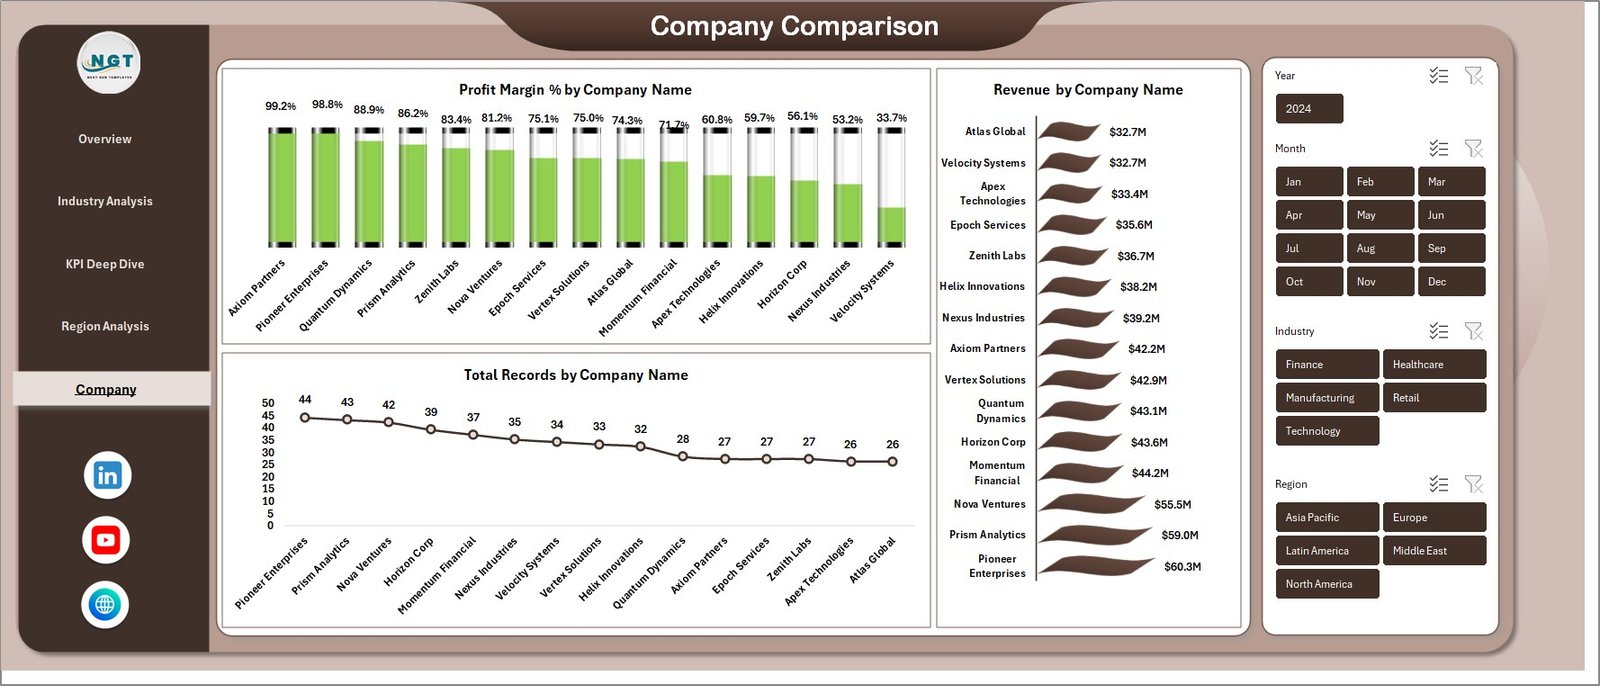
🏢 Company Comparison Sheet
- Profit Margin % by Company
- Revenue by Company
- Total Records by Company
⚙️ How to Use the Benchmarking and Insights Dashboard in Excel
Using this dashboard is extremely simple, even if you are not an Excel expert:
1️⃣ Enter your business data into the designated input sections
2️⃣ Update KPI values, revenue, profit, and benchmarking scores
3️⃣ Refresh the dashboard to instantly view updated insights
4️⃣ Use filters and slicers to analyze specific industries, regions, or KPIs
5️⃣ Identify trends, gaps, and opportunities to improve performance
Within minutes, you will have a complete business intelligence system ready to guide your decisions.
🎯 Who Can Benefit from This Benchmarking and Insights Dashboard in Excel
This dashboard is ideal for:
👨💼 Business Owners – Track performance and compare with industry standards
📊 Data Analysts – Perform in-depth analysis without building dashboards from scratch
📈 Managers & Executives – Make data-driven strategic decisions
🏭 Consultants – Provide professional insights to clients quickly
💼 Finance Teams – Monitor revenue, profit, and performance metrics efficiently
🎓 Students & Learners – Learn real-world business analytics and dashboarding
With this ready-to-use Excel dashboard, you don’t just analyze data—you transform it into actionable insights. Save time, improve accuracy, and stay ahead of your competition with smarter reporting.


