Managing a backpacker hostel can quickly become overwhelming when you are dealing with bookings, guest satisfaction, occupancy rates, and revenue tracking all at once. What if you could monitor everything in one powerful, interactive dashboard?
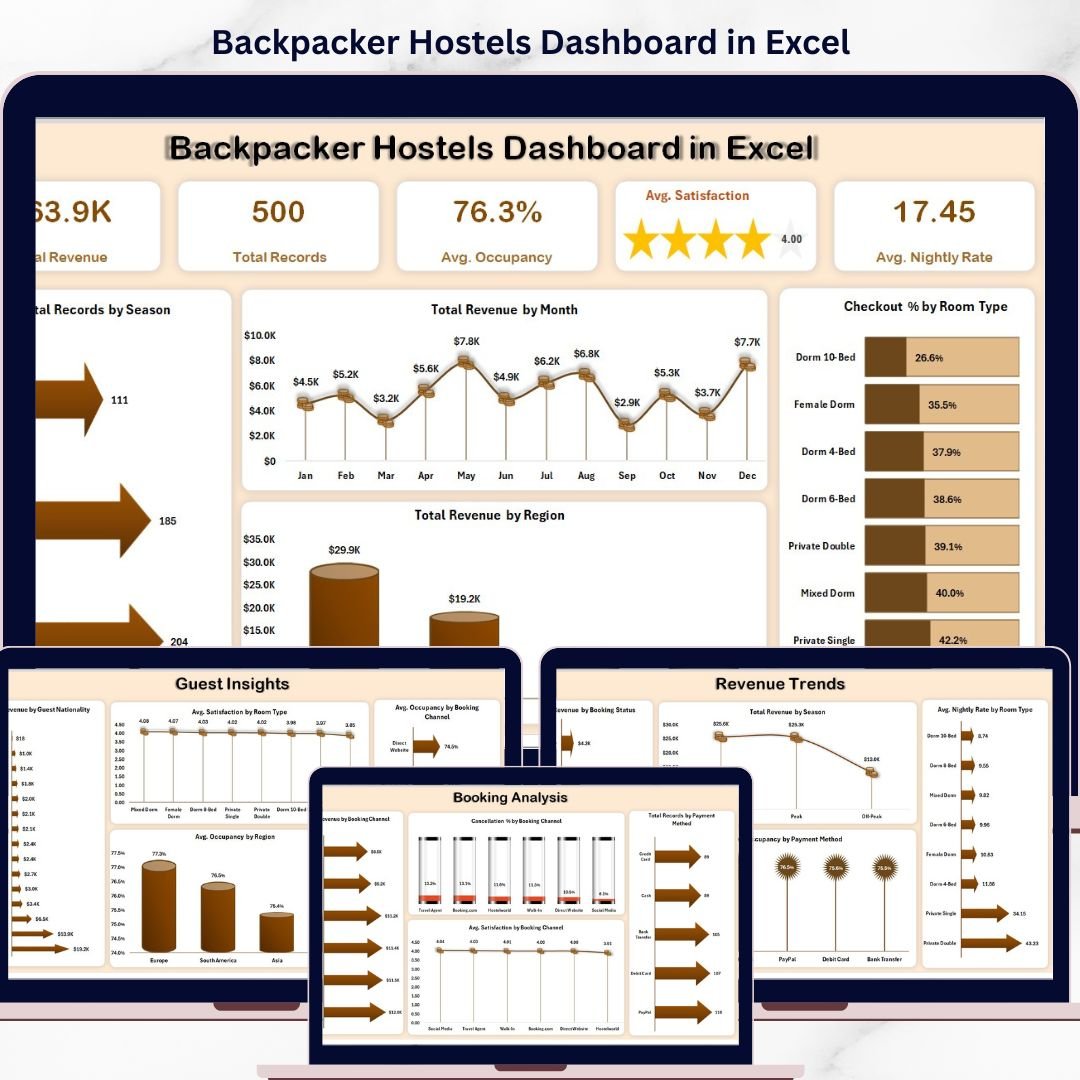
Introducing the Backpacker Hostels Dashboard in Excel – a smart, ready-to-use solution designed to simplify hostel management and give you clear insights instantly. Whether you run a single hostel or manage multiple locations, this dashboard helps you track performance, analyze trends, and make better business decisions effortlessly.
This dynamic Excel dashboard transforms your raw data into meaningful insights using visually appealing charts, KPI cards, and slicers. Instead of spending hours creating reports manually, you can now focus on improving your guest experience and increasing profitability.
🚀 Key Features of Backpacker Hostels Dashboard in Excel
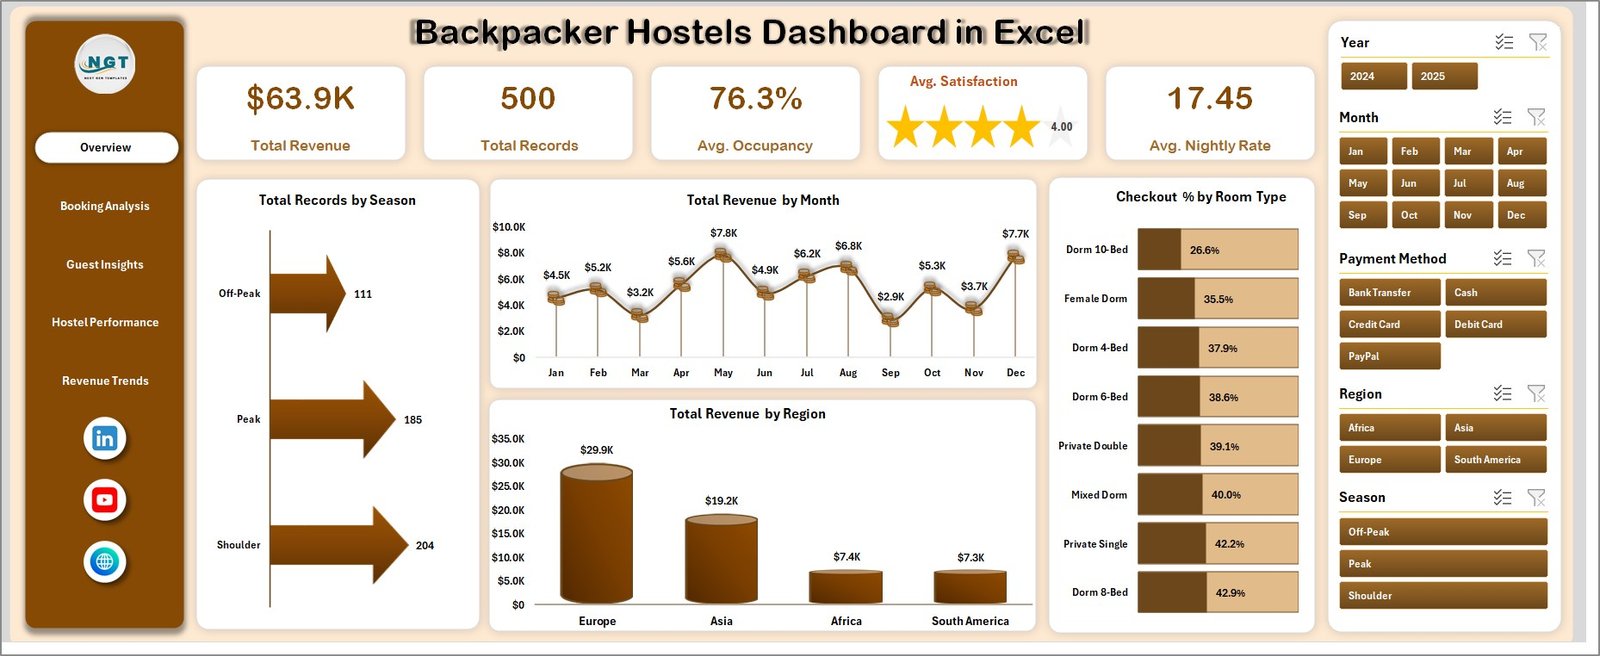
✨ All-in-One Overview Page – Instantly view key metrics like Total Revenue, Total Records, Average Occupancy, Average Satisfaction, and Average Nightly Rate in one place.
📊 Interactive Charts & Visuals – Analyze hostel performance using charts such as Total Revenue by Month, Region, and Checkout % by Room Type.
🎯 Advanced Filtering with Slicers – Quickly filter data by Year, Month, Region, Payment Method, and more for deeper insights.
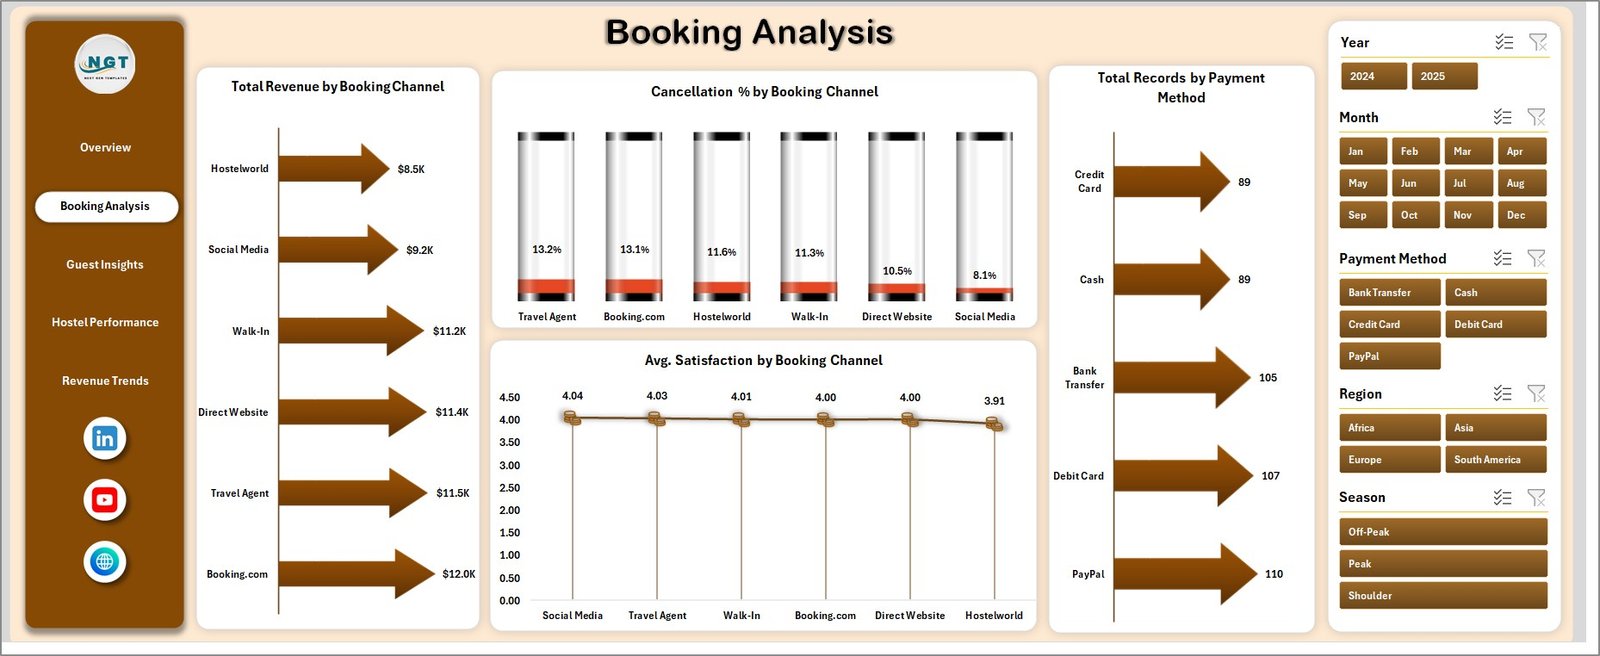
📈 Booking Channel Insights – Understand which booking channels generate the most revenue and where cancellations occur.
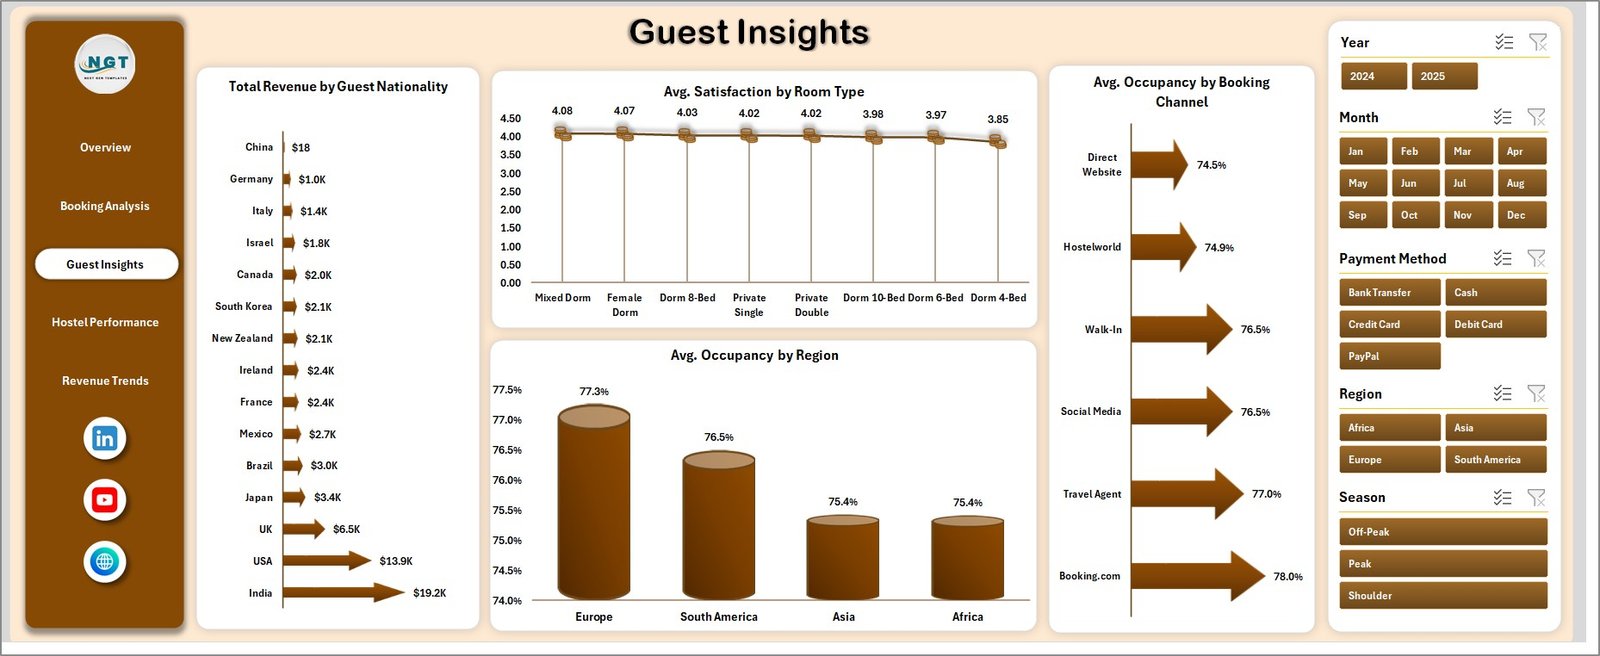
🌍 Guest Analytics – Discover trends by guest nationality, room preferences, and satisfaction levels.
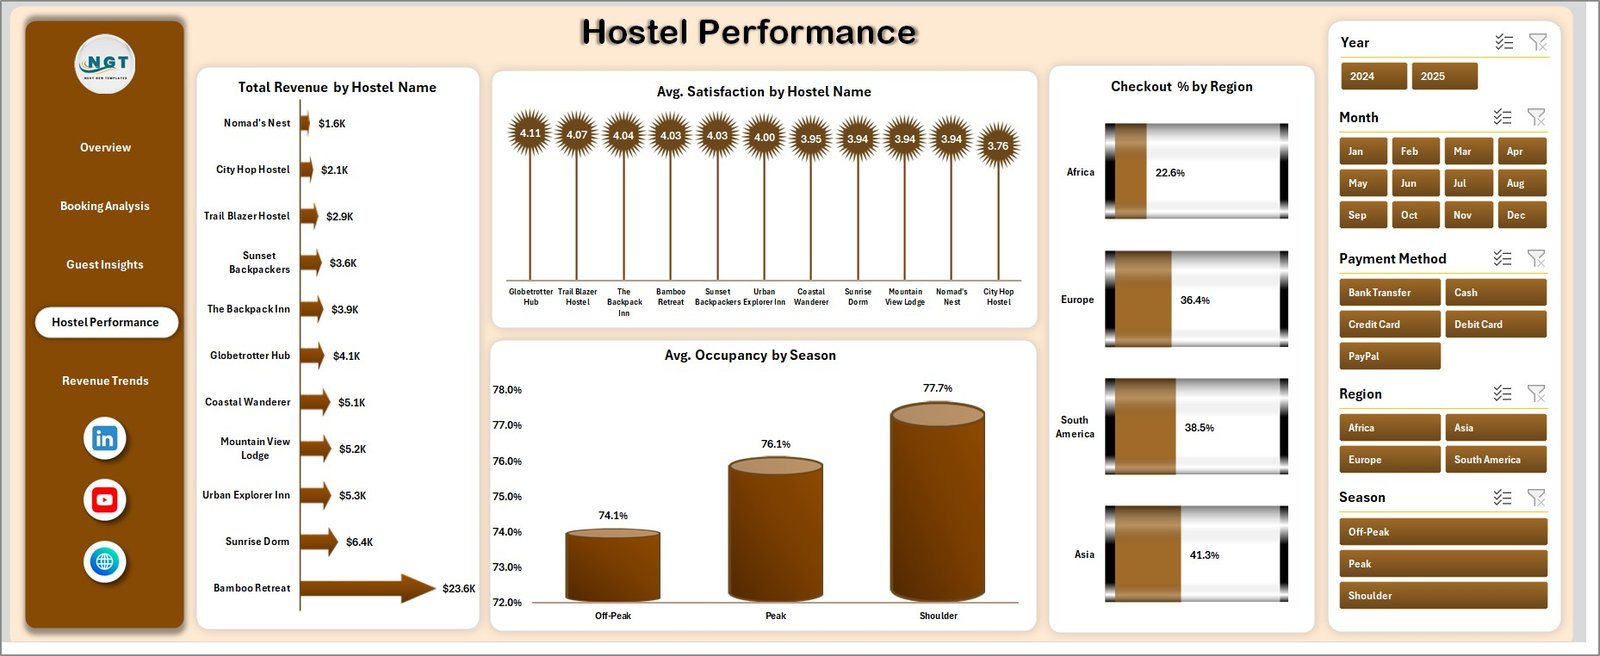
🏨 Hostel Performance Tracking – Compare performance across different hostels and identify top-performing locations.
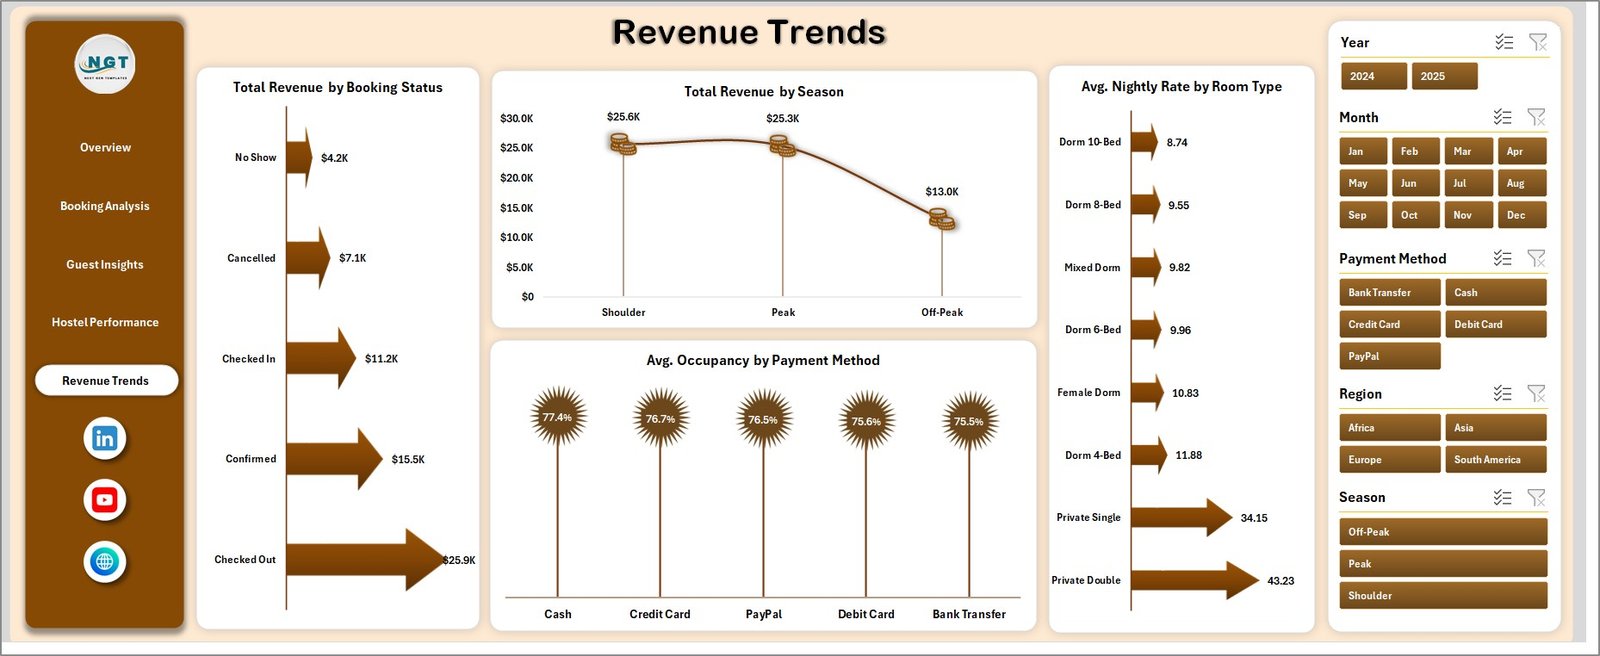
💡 Revenue Trend Analysis – Monitor revenue patterns across seasons, booking status, and room types.
🔄 Auto-Refresh Functionality – Simply update the data sheet and refresh to instantly update all charts and reports.
📂 What’s Inside the Backpacker Hostels Dashboard in Excel
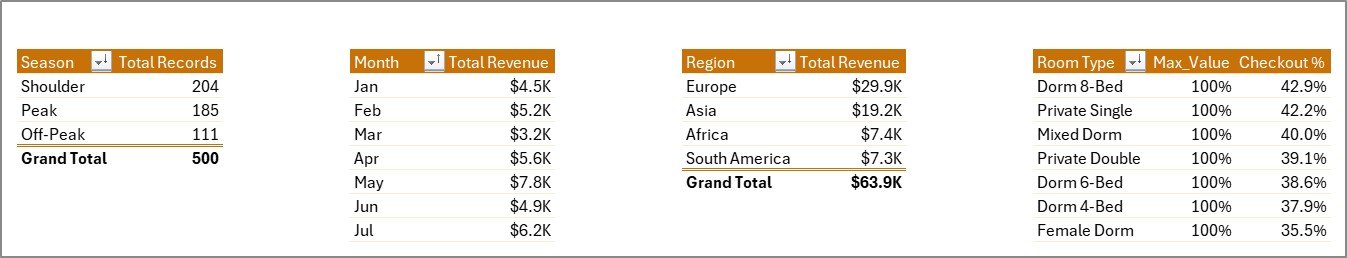
📁 Overview Page – Displays high-level KPIs along with charts like Total Records by Season, Revenue by Month, Revenue by Region, and Checkout % by Room Type.
📁 Booking Analysis Page – Shows Total Revenue by Booking Channel, Cancellation %, Payment Method distribution, and Satisfaction scores.
📁 Guest Insights Page – Provides deep insights into guest behavior including nationality, occupancy trends, and satisfaction ratings.
📁 Hostel Performance Page – Tracks revenue, satisfaction, and occupancy across different hostels and regions.
📁 Revenue Trends Page – Helps analyze revenue patterns based on booking status, seasons, room types, and payment methods.
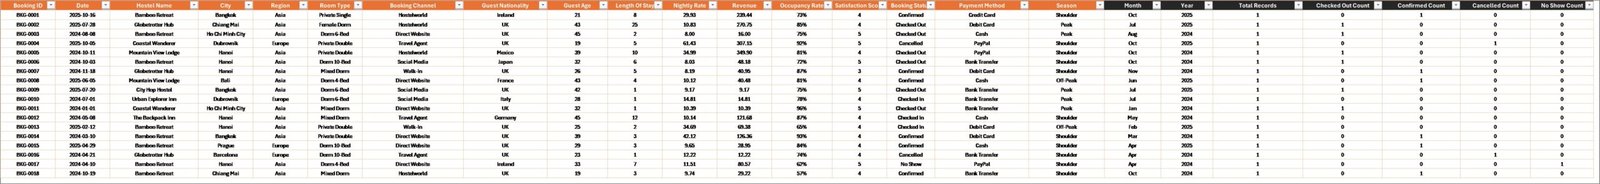
📁 Data Sheet Tab – A structured data entry sheet where you can input your data in the same format.
📁 Support Sheet – Contains pivot tables that power the dashboard dynamically (can be hidden for cleaner view).
⚙️ How to Use the Backpacker Hostels Dashboard in Excel
🧩 Step 1: Enter your data in the Data Sheet using the provided format.
🔄 Step 2: Go to the Excel Data tab and click on “Refresh All”.
📊 Step 3: Watch the dashboard automatically update with new charts and KPIs.
🎛️ Step 4: Use slicers to filter and analyze data instantly.
📈 Step 5: Gain actionable insights and make smarter business decisions.
No advanced Excel skills are required. This dashboard is designed to be user-friendly and easy to operate.
👥 Who Can Benefit from This Backpacker Hostels Dashboard in Excel
🏨 Hostel Owners & Managers looking to improve operations and profitability.
📊 Data Analysts who want a ready-made reporting solution.
🌍 Travel & Hospitality Professionals managing bookings and guest data.
💼 Business Owners seeking better decision-making tools.
📈 Consultants helping hospitality businesses optimize performance.
🔗 Click here to read the Detailed blog post
▶️ Visit our YouTube channel to learn step-by-step video tutorials
👉 https://www.youtube.com/@PKAnExcelExpert


