
Autonomous Vehicles KPI Dashboard are no longer an experiment—they are already transforming transportation, logistics, and mobility services. However, innovation without measurement creates blind spots. Autonomous vehicle programs generate massive volumes of data related to safety, efficiency, reliability, and system performance. When this data stays scattered across spreadsheets or technical logs, teams struggle to see the full picture.
That is exactly where the Autonomous Vehicles KPI Dashboard in Power BI becomes an essential performance management tool.
This ready-to-use Power BI dashboard converts complex autonomous vehicle KPI data into clear visuals, interactive tables, trend charts, and performance indicators. Instead of manually reviewing raw data, engineering teams, operations managers, and leadership can monitor all critical KPIs from a single interactive dashboard.
The dashboard uses Excel as the data source and Power BI as the visualization layer. This combination keeps data entry simple while delivering powerful analytics. As a result, even non-technical users can update KPI values easily and still benefit from advanced Power BI insights.
🔑 Key Feature of Autonomous Vehicles KPI Dashboard in Power BI
🚀 Centralized KPI Monitoring – Track all autonomous vehicle KPIs from one interactive dashboard
📊 MTD & YTD Performance Tracking – Monitor short-term and long-term progress clearly
🎯 Target vs Actual Comparison – Instantly identify performance gaps
📅 Previous Year Benchmarking – Measure improvement year over year
🧭 Dynamic Slicers – Filter KPIs by month and KPI group
📈 Trend Analysis Charts – Visualize KPI movement over time
🧾 KPI Definition Drill-Through – Understand KPI logic instantly
🔄 Excel-Based Data Entry – Update data without Power BI expertise
This dashboard removes guesswork and replaces it with clear, actionable insights.
📦 What’s Inside the Autonomous Vehicles KPI Dashboard in Power BI
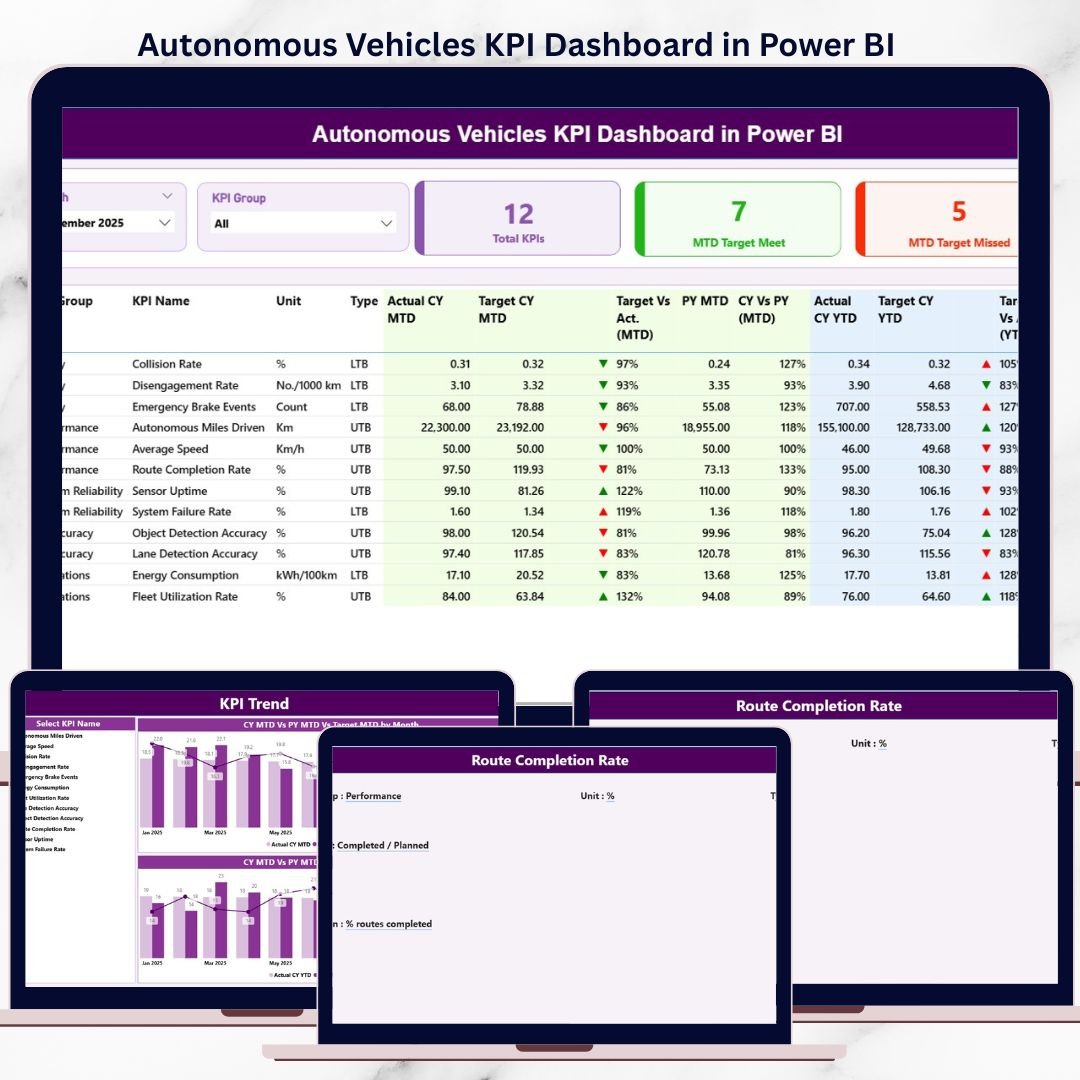
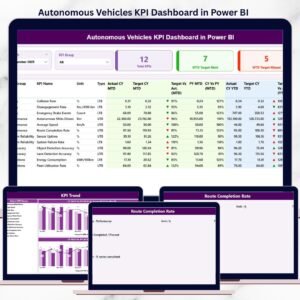
📊 Summary Page – Complete KPI Snapshot
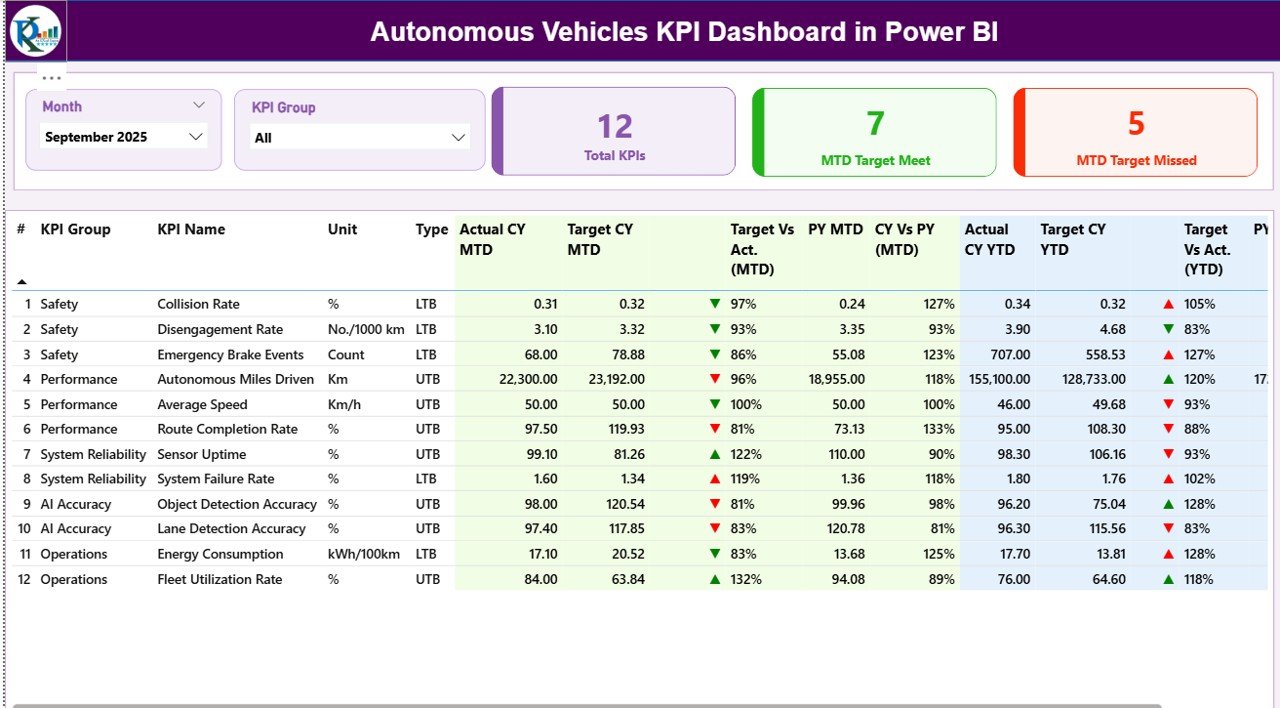
The Summary Page acts as the main control center of the dashboard.
What You See on This Page:
-
Month slicer for dynamic analysis
-
KPI Group slicer for category-wise filtering
-
KPI Cards showing:
-
Total KPIs
-
MTD Target Met
-
MTD Target Missed
-
Detailed KPI Table Includes:
-
KPI Number
-
KPI Group
-
KPI Name
-
Unit
-
KPI Type (UTB / LTB)
MTD Analysis:
-
Actual vs Target with visual indicators
-
Previous Year comparison
YTD Analysis:
-
Actual vs Target tracking
-
Long-term performance comparison
This page helps decision-makers understand overall performance within seconds.
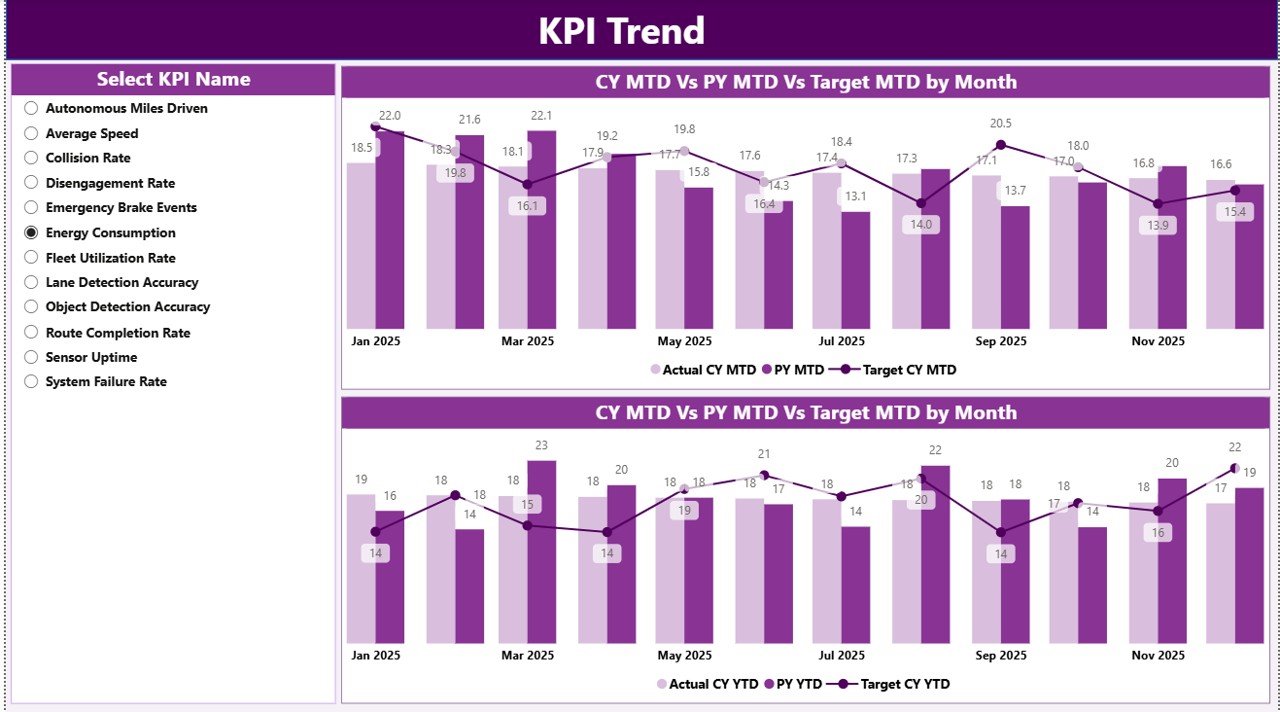
📈 KPI Trend Page – Performance Over Time
The KPI Trend Page focuses on trend-based analysis.
Key Capabilities:
-
KPI Name slicer for focused analysis
-
MTD Trend Chart (Actual vs Target vs PY)
-
YTD Trend Chart (Actual vs Target vs PY)
With these visuals, teams can spot risks early, track improvement patterns, and support proactive decisions.
📘 KPI Definition Page – KPI Clarity & Governance
The KPI Definition Page is a drill-through reference page.
What It Shows:
-
KPI Number
-
KPI Group
-
KPI Name
-
Unit
-
Formula
-
KPI Definition
-
KPI Type (UTB / LTB)
This page ensures everyone interprets KPIs consistently, reducing confusion across teams.
🛠️ How to Use the Autonomous Vehicles KPI Dashboard in Power BI
✅ Enter KPI definitions in Excel
✅ Update actual and target values monthly
✅ Refresh the Power BI dashboard
✅ Use slicers to filter KPIs
✅ Review MTD & YTD trends
✅ Take faster, data-driven decisions
No advanced Power BI knowledge is required.
👥 Who Can Benefit from This Autonomous Vehicles KPI Dashboard
🚘 Autonomous Vehicle Development Teams
📊 Data Analysts & BI Teams
🛡️ Safety & Compliance Teams
⚙️ Fleet & Operations Managers
🧠 R&D Leadership
📈 Strategy & Performance Teams
Suitable for startups, research labs, and enterprise-level AV programs.
### 👉 Click here to read the Detailed blog post
▶️ Visit our YouTube channel to learn step-by-step video tutorials
https://youtube.com/@PKAnExcelExpert


Reviews
There are no reviews yet.