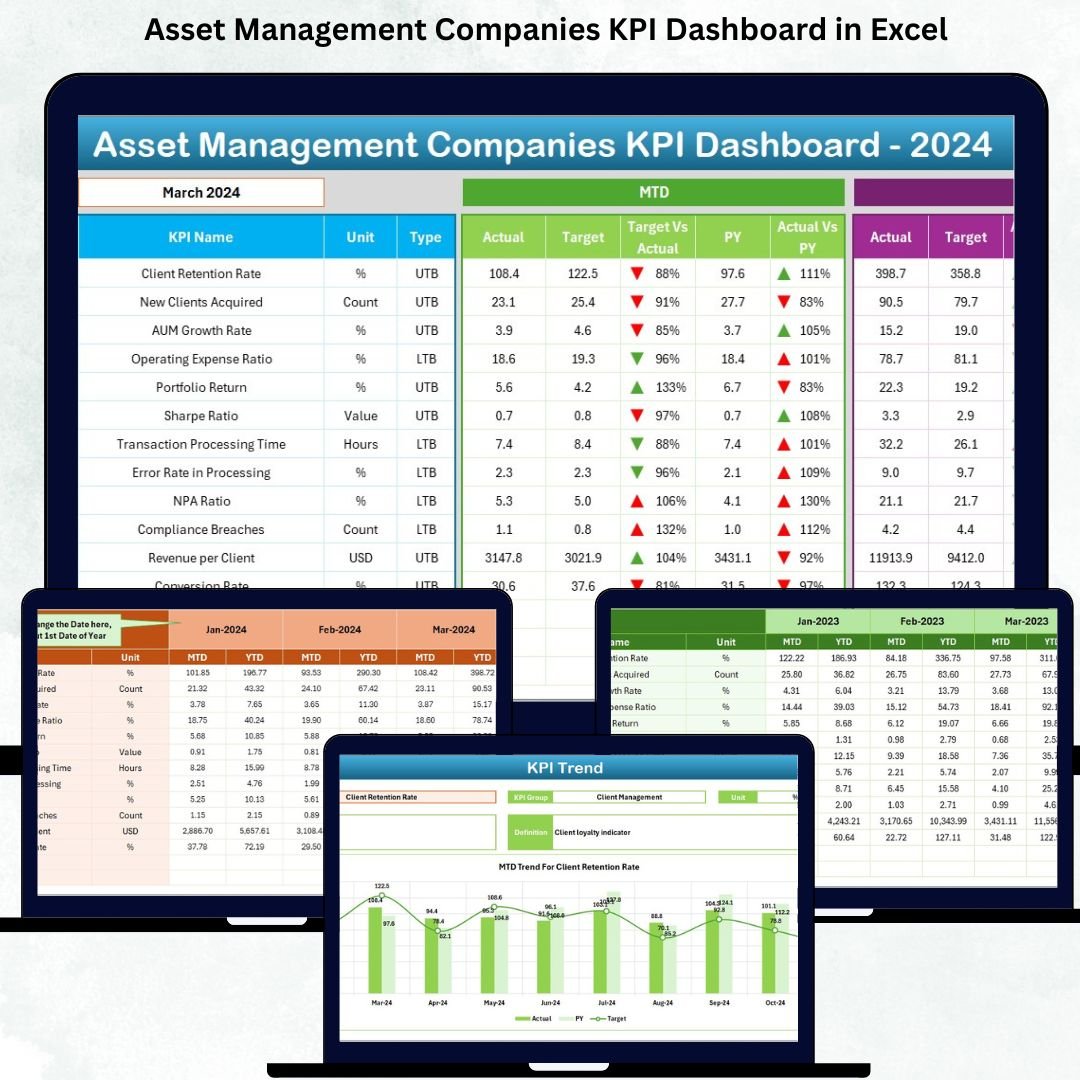
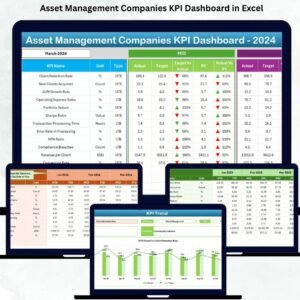
The Asset Management Companies KPI Dashboard in Excel is a powerful reporting solution designed for investment firms that manage portfolios, analyze financial performance, and track operational efficiency. In an industry driven by precision, compliance, and timely decision-making, this dashboard brings clarity to complex data. It transforms your monthly and yearly numbers into simple, interactive visuals that help you analyze performance, spot trends, and make informed decisions faster.
With a clean layout, dropdown selectors, KPI definitions, trend charts, and structured worksheets, this Excel dashboard becomes a central performance control system for investment managers, analysts, operations teams, and leadership. No technical skills are required—every insight updates with a single month selection. Whether you are monitoring fund performance, risk ratios, client onboarding timelines, compliance metrics, or revenue targets, this dashboard ensures complete visibility across your operations.
✨ Key Features of the Asset Management Companies KPI Dashboard in Excel
-
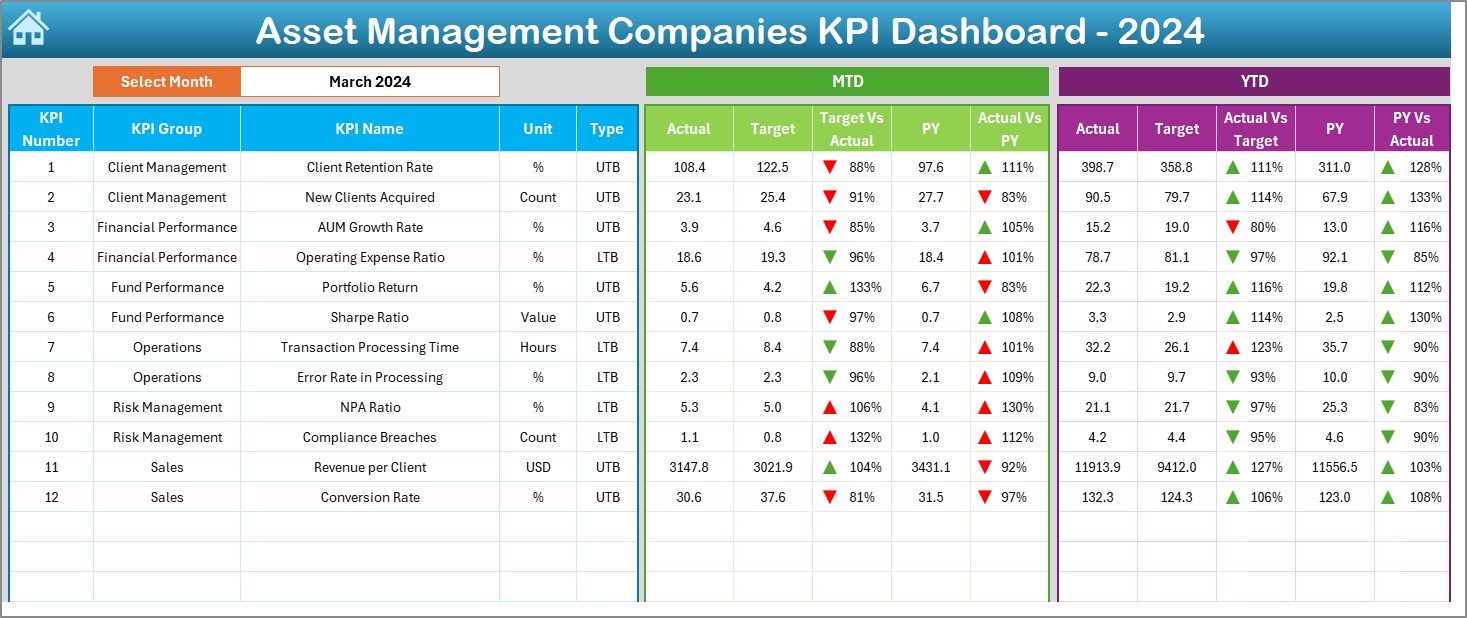
📊 Interactive Dashboard Page: Choose a month and instantly view updated MTD and YTD values, targets, and previous-year comparisons.
-
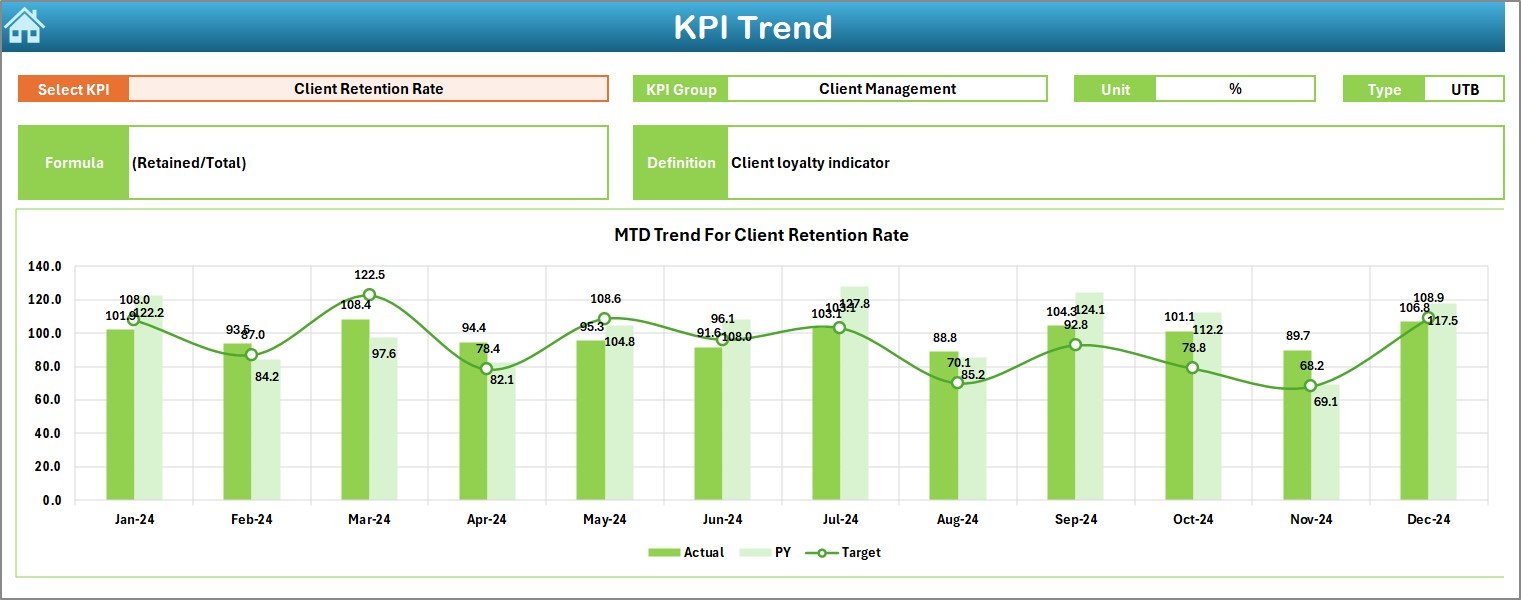
📈 Trend Analysis Charts: Visualize KPI movement with two clear charts—MTD Trend and YTD Trend—to understand patterns and performance shifts.
-
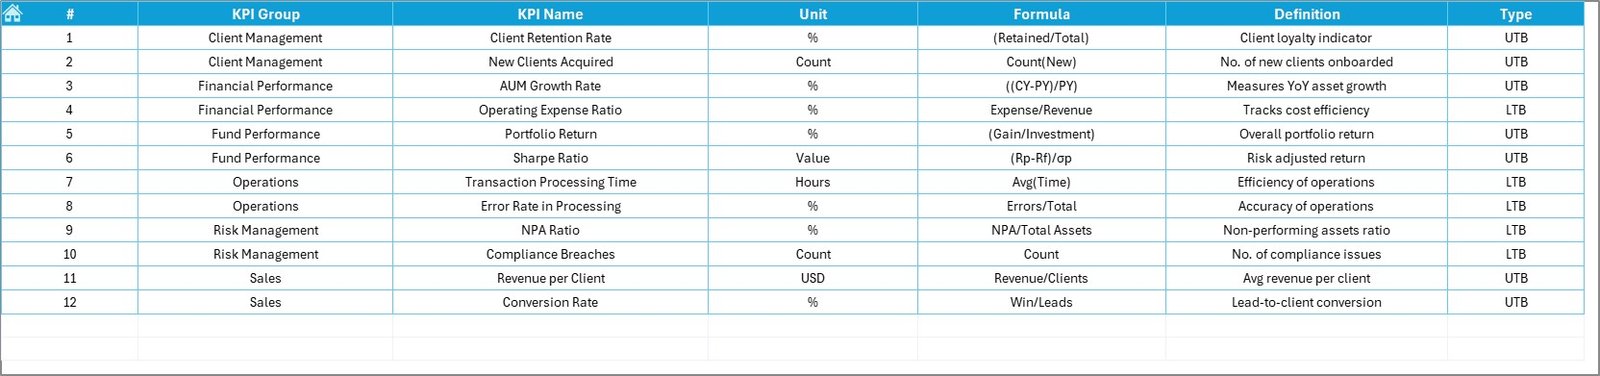
📑 KPI Definition Page: See KPI name, group, unit, formula, definition, and type (UTB/LTB) for transparency across teams.
-
📂 Structured Worksheets: Includes sheets for actuals, targets, previous-year numbers, KPI definitions, and navigation.
-
🟢🔴 Visual Icons: Conditional formatting arrows make performance direction clear—green for improvement, red for decline.
-
🧭 Home Navigation Page: Six navigation buttons help teams move through the file effortlessly.
-
⚡ Fully Automated: All metrics update automatically when you change the month or update data in the input sheets.
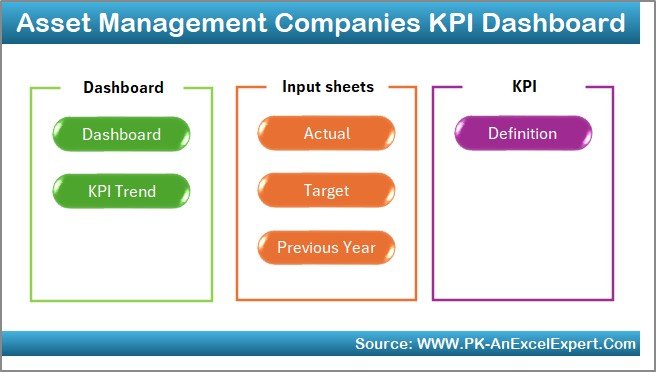
📦 What’s Inside the Asset Management Companies KPI Dashboard in Excel
This ready-to-use dashboard contains seven professional worksheets:
-
🏠 Home Sheet: Quick navigation panel for easy access to all pages.
-
📊 Dashboard Sheet: The main view showing MTD/YTD actuals, targets, PY values, comparisons, and performance icons.
-
📈 KPI Trend Sheet: Displays MTD and YTD trend charts and KPI metadata based on the selected KPI.
-
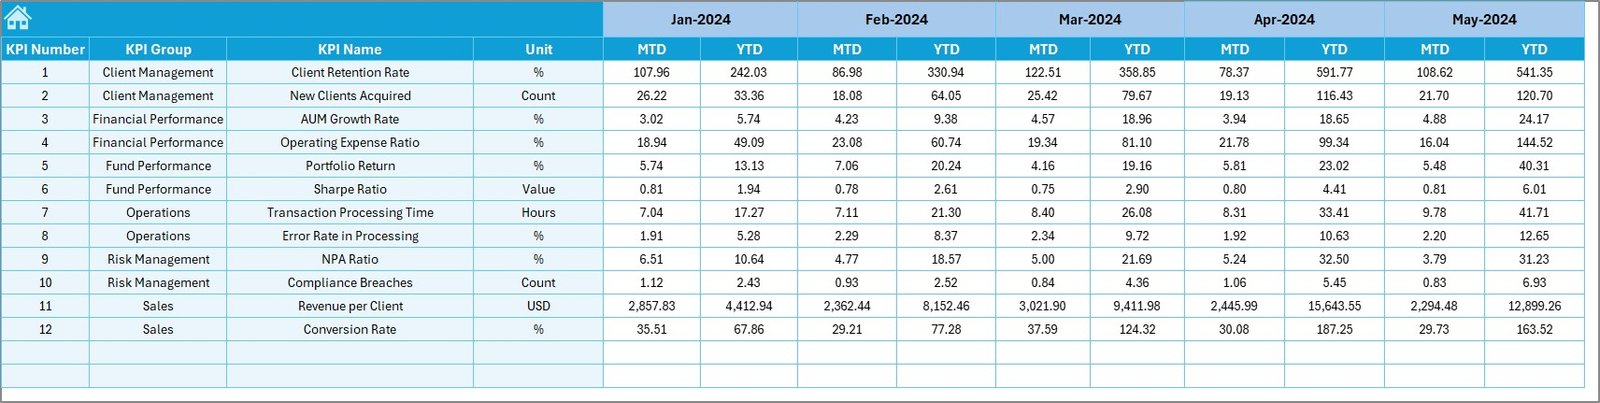
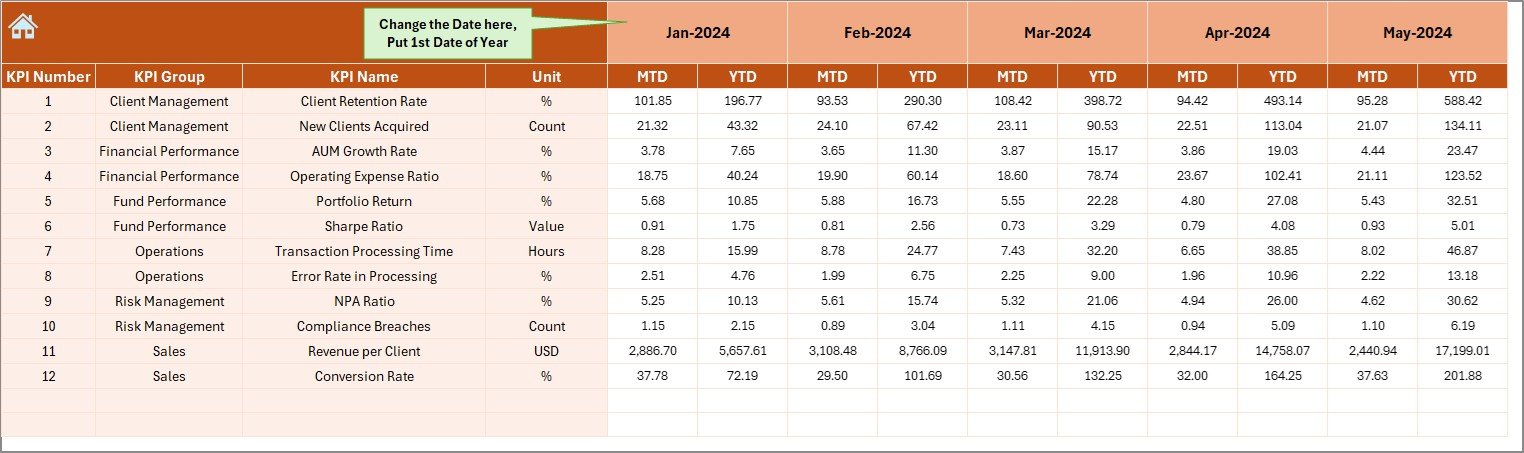
📝 Actual Numbers Sheet: Update monthly actual performance—simple structure for beginner-friendly usage.
-
🎯 Target Sheet: Enter monthly and yearly KPI targets for accurate comparisons.
-
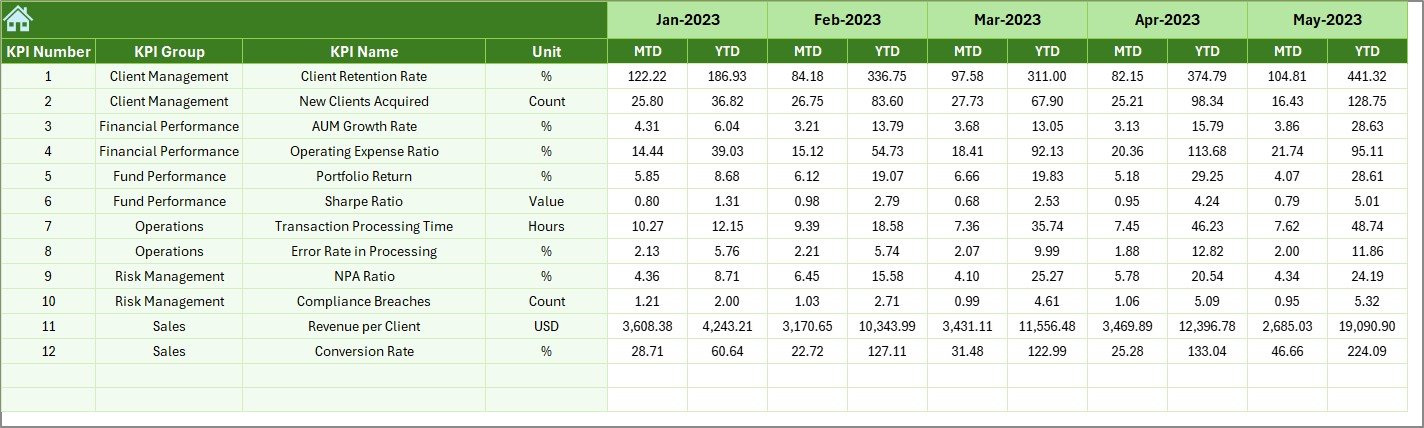
📘 Previous Year Sheet: Store historical MTD/YTD data for performance benchmarking.
-
📚 KPI Definition Sheet: Clear reference for KPI names, formulas, units, and type classification.
Everything is designed for quick review and accurate reporting—ideal for monthly meetings, portfolio reviews, strategy planning, and compliance evaluations.
🛠️ How to Use the Asset Management Companies KPI Dashboard in Excel
-
Enter Actual MTD/YTD Data into the Actual Numbers sheet every month.
-
Update Targets in the Target sheet to match organizational goals.
-
Review KPI Performance by selecting a month on the Dashboard Sheet.
-
Analyze Trends using the KPI Trend sheet to identify growth patterns or performance gaps.
-
Use KPI Definitions to help new users understand formulas and measurement methods.
-
Refresh Monthly Reports easily with automatic chart and table updates.
This workflow ensures your leadership team always receives accurate, up-to-date insights without manual effort.
👥 Who Can Benefit from This Asset Management KPI Dashboard
This dashboard is perfect for:
-
Investment Managers wanting a clear performance overview.
-
Portfolio Analysts analyzing returns, risk metrics, and operational quality.
-
Compliance Teams monitoring regulatory KPIs.
-
Financial Planning Teams reviewing revenue, cost, and growth indicators.
-
Operations Managers tracking timelines, process efficiency, and service metrics.
-
Leadership Teams requiring high-level insights for strategic decisions.
If your asset management company wants improved accuracy, faster decision-making, and full performance transparency, this dashboard is the ideal solution.


Reviews
There are no reviews yet.