


Running a successful aquatic pet store is more than just selling fish and accessories—it’s about managing sales, inventory, customer satisfaction, and profitability efficiently. Aquatic Pet Stores Dashboard in Excel in today’s competitive retail environment, relying on manual spreadsheets can slow you down and lead to missed opportunities.
Many store owners struggle to track performance, identify trends, and make informed decisions because their data is scattered across multiple files. But what if you could manage everything from one powerful dashboard? 🤔
Aquatic Pet Stores Dashboard in Excel That’s exactly where the Aquatic Pet Stores Dashboard in Excel becomes a game-changing solution! 🚀
This ready-to-use and fully interactive dashboard helps you monitor sales, analyze product performance, track customer behavior, and control costs—all in one place. Instead of dealing with complex spreadsheets, you get clear and visually engaging insights that help you make faster and smarter business decisions.
Whether you run a single store or manage multiple locations, this dashboard gives you complete visibility into your business operations. From understanding customer preferences to identifying your most profitable products, everything becomes easier and more efficient. ⚡
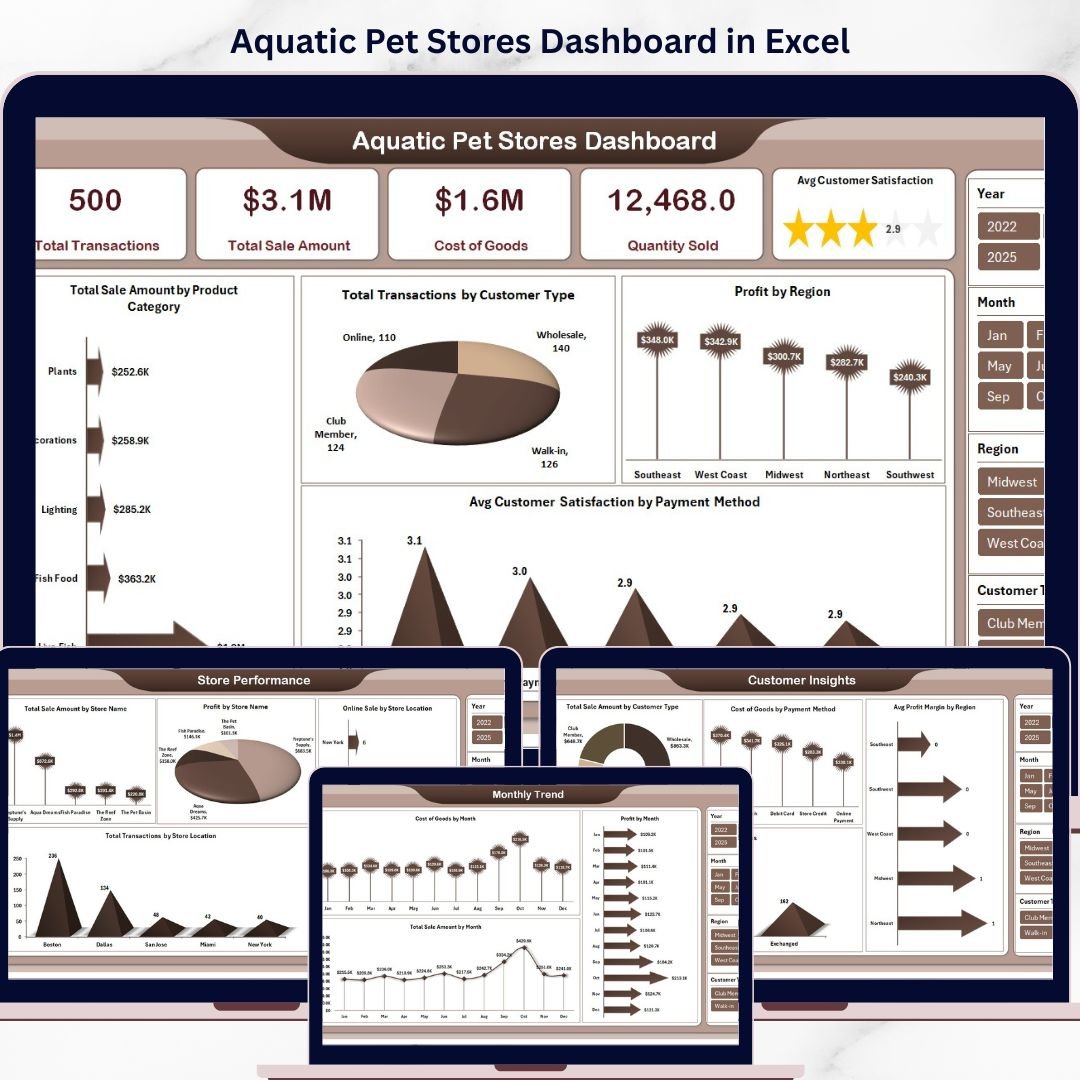
📊 Key Features of Aquatic Pet Stores Dashboard in Excel
✨ All-in-One Retail Dashboard – Manage sales, inventory, and customer insights in one place.
🛒 Sales Performance Tracking – Monitor total transactions, sales amount, and quantity sold.
💰 Profit & Cost Analysis – Track cost of goods and profit margins effectively.
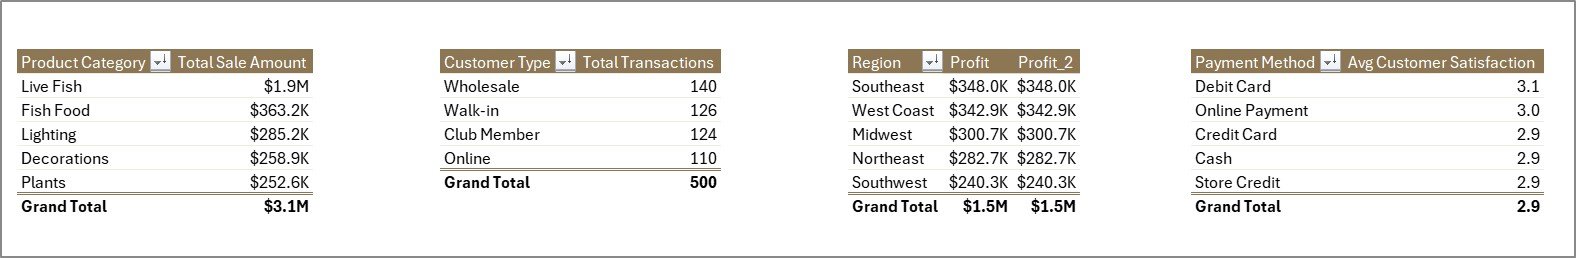
📦 Product Performance Insights – Identify best-selling and low-performing products.
🏬 Store-Level Analysis – Compare performance across multiple store locations.
👥 Customer Behavior Insights – Understand customer types, preferences, and satisfaction.
📍 Regional Analysis – Analyze sales and profit across regions.
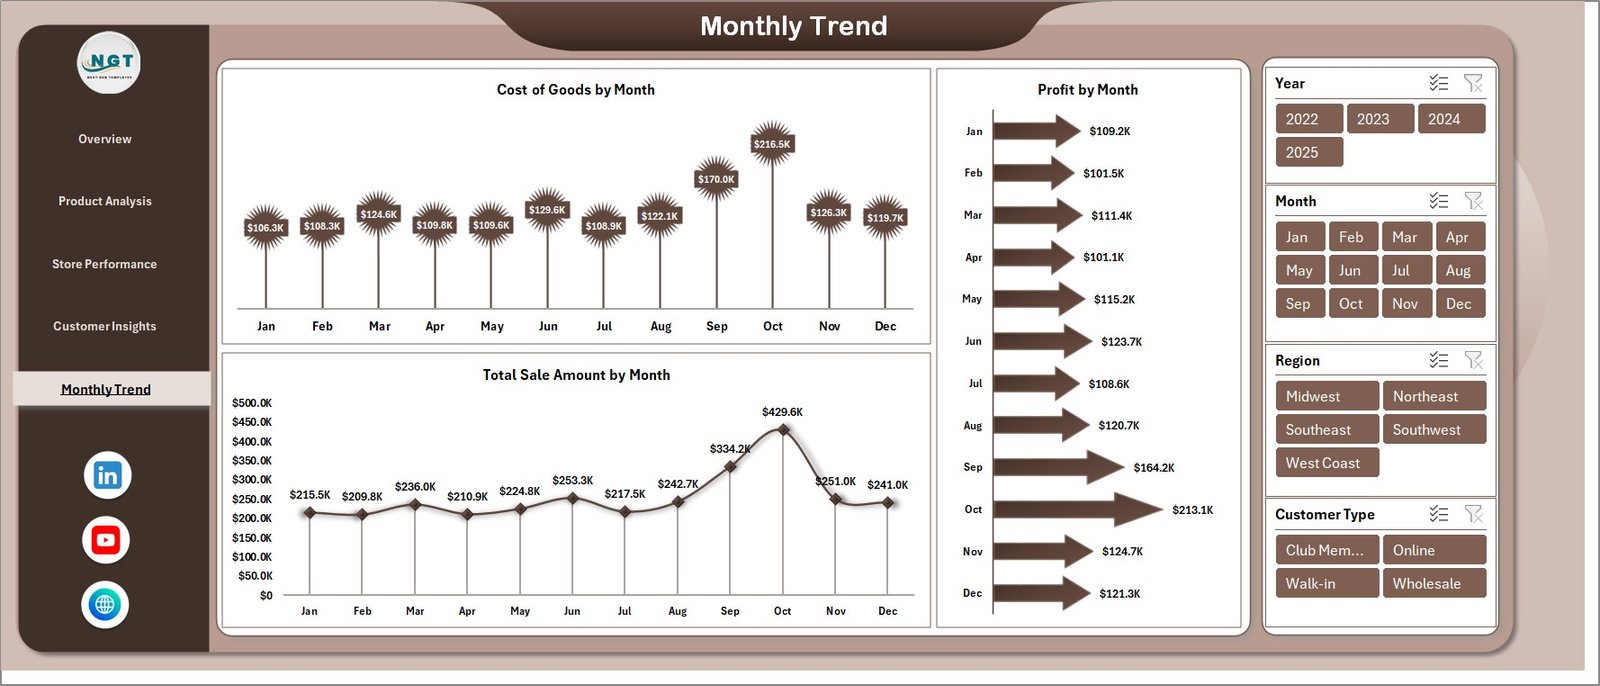
📅 Monthly Trends Tracking – Monitor growth patterns and seasonal trends.
⚡ Automated Updates – Dashboard updates automatically with new data inputs.
📂 What’s Inside the Aquatic Pet Stores Dashboard in Excel
This dashboard includes 5 powerful and interactive pages designed for deep analysis:

📊 Overview Page – Get a quick snapshot of KPIs and overall store performance.
📦 Product Analysis – Analyze product categories, profitability, and sales volume.
🏬 Store Performance – Compare store-level sales, profit, and transactions.
👥 Customer Insights – Understand customer behavior and improve retention.
📅 Monthly Trends – Track performance trends and identify growth opportunities.
Each page provides clear and actionable insights to help you optimize your business. 🔍
⚙️ How to Use the Aquatic Pet Stores Dashboard in Excel
Using this dashboard is simple and efficient:
📥 Enter Your Data – Input sales, product, and customer data into the data sheet.
🔄 Update Supporting Tables – Maintain categories like product type, region, and store.
🧭 Use Page Navigator – Switch between pages easily.
🎛️ Apply Filters (Slicers) – Analyze data by category, store, or region.
📊 Review KPI Cards – Monitor key metrics like sales and profit.
🔍 Analyze Charts – Identify trends and patterns quickly.
📈 Track Monthly Trends – Monitor growth and seasonal performance.
Within minutes, you can turn raw data into meaningful business insights! ⚡
👥 Who Can Benefit from This Aquatic Pet Stores Dashboard in Excel
This dashboard is ideal for:
🐠 Pet Store Owners – Track sales, profit, and inventory performance.
🏬 Retail Managers – Monitor store operations and optimize performance.
📊 Business Analysts – Gain insights using interactive data visualization.
📦 Inventory Managers – Track product performance and stock efficiency.
🌍 Franchise Owners – Compare performance across multiple locations.
If you manage an aquatic pet store, this dashboard is a must-have tool! 🏆
📖 Click hare to read the Detailed blog post
🎥 Visit our YouTube channel to learn step-by-step video tutorials
👉 https://www.youtube.com/@PKAnExcelExpert


