
Managing your app’s performance in today’s competitive marketplace requires real-time insights, smart metrics, and data-driven decisions. The App Store Optimization KPI Dashboard in Power BI gives you all of this in one place — a powerful, ready-to-use analytical dashboard designed to track, analyze, and optimize your app store performance effortlessly.
This dashboard is a must-have for app developers, marketers, and analysts who want to boost downloads, improve ratings, and enhance conversion rates — all through clear and dynamic Power BI visuals.App Store Optimization KPI Dashboard in Power BI
✨ Key Features of App Store Optimization KPI Dashboard in Power BI
📊 All-in-One ASO Analytics – Consolidate metrics like downloads, engagement, and ratings in a single Power BI view.
⚡ Interactive Summary Page – Use slicers for Month & KPI Group to explore results quickly and filter insights instantly.
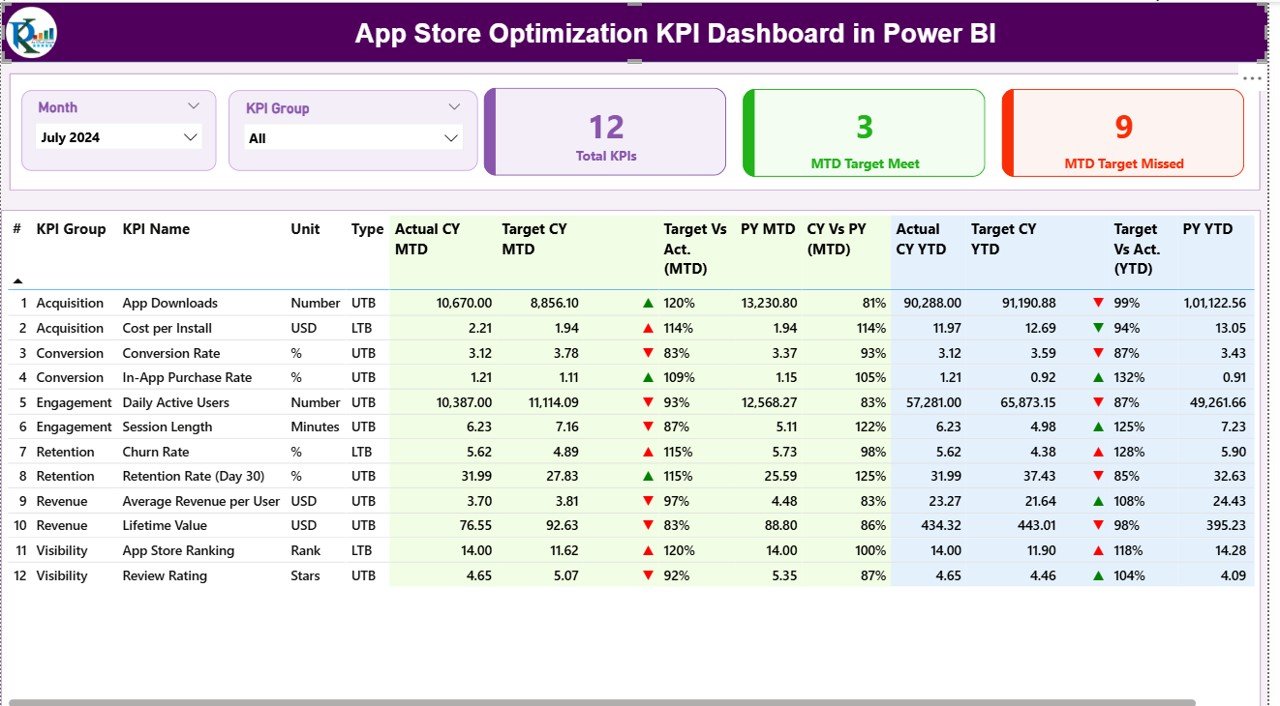
📈 Real-Time KPI Tracking – Monitor MTD and YTD actual vs target values with dynamic red/green icons that show success or failure.App Store Optimization KPI Dashboard in Power BI
📉 Performance Comparison – Compare current year vs previous year metrics to measure true progress and identify growth patterns.
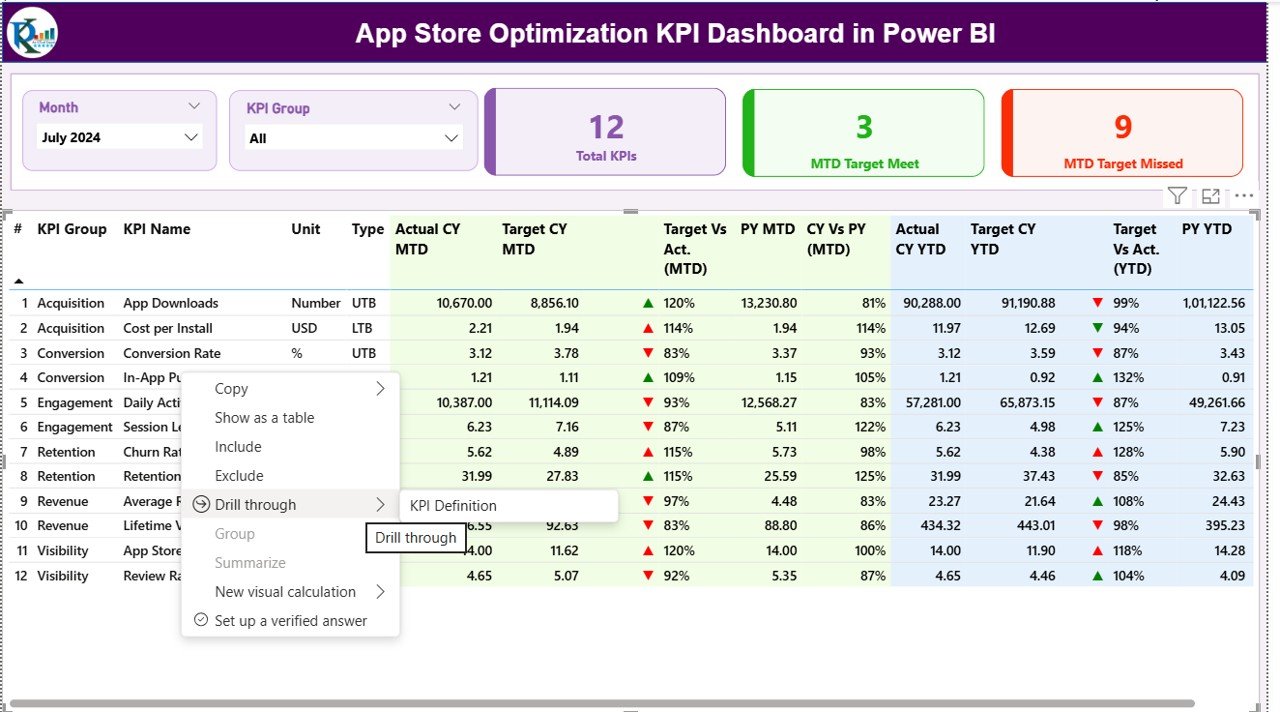
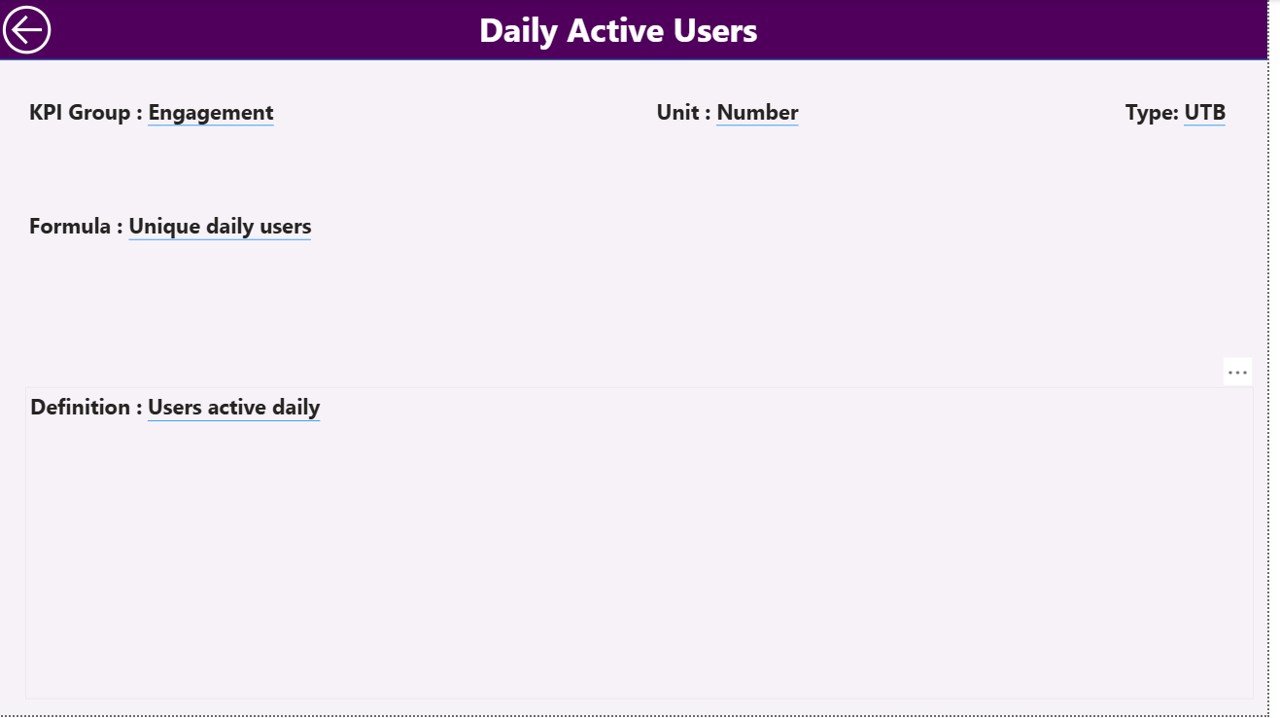
📚 KPI Definition Integration – Instantly view formula, unit, and type (UTB/LTB) for each KPI via a dedicated drill-through page.
🧩 Excel-Powered Data Source – Easily manage Actual, Target, and Definition data directly in Excel — no coding required.
🎯 Visual Clarity – Use cards, combo charts, and trend visuals that simplify complex performance data into understandable insights.
🔁 Automated Updates – Refresh the dashboard anytime to get the latest ASO data — no manual report building needed.
⚙️ Fully Customizable – Add your own KPIs, visuals, and colors to make it perfectly match your app’s data strategy.App Store Optimization KPI Dashboard in Power BI
🧠 Built for Decision-Makers – Empower marketing and product teams to make smart, data-backed optimization choices.
📦 What’s Inside the App Store Optimization KPI Dashboard in Power BI
This Power BI dashboard is divided into three key pages, each crafted for deeper app analysis:
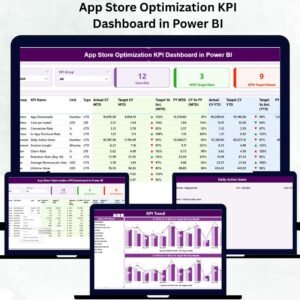
🟢 1. Summary Page
Your control center for tracking ASO performance.
-
View total KPI count, MTD targets achieved/missed, and overall performance status.
-
Access detailed KPI tables with indicators, comparisons, and quick insights.
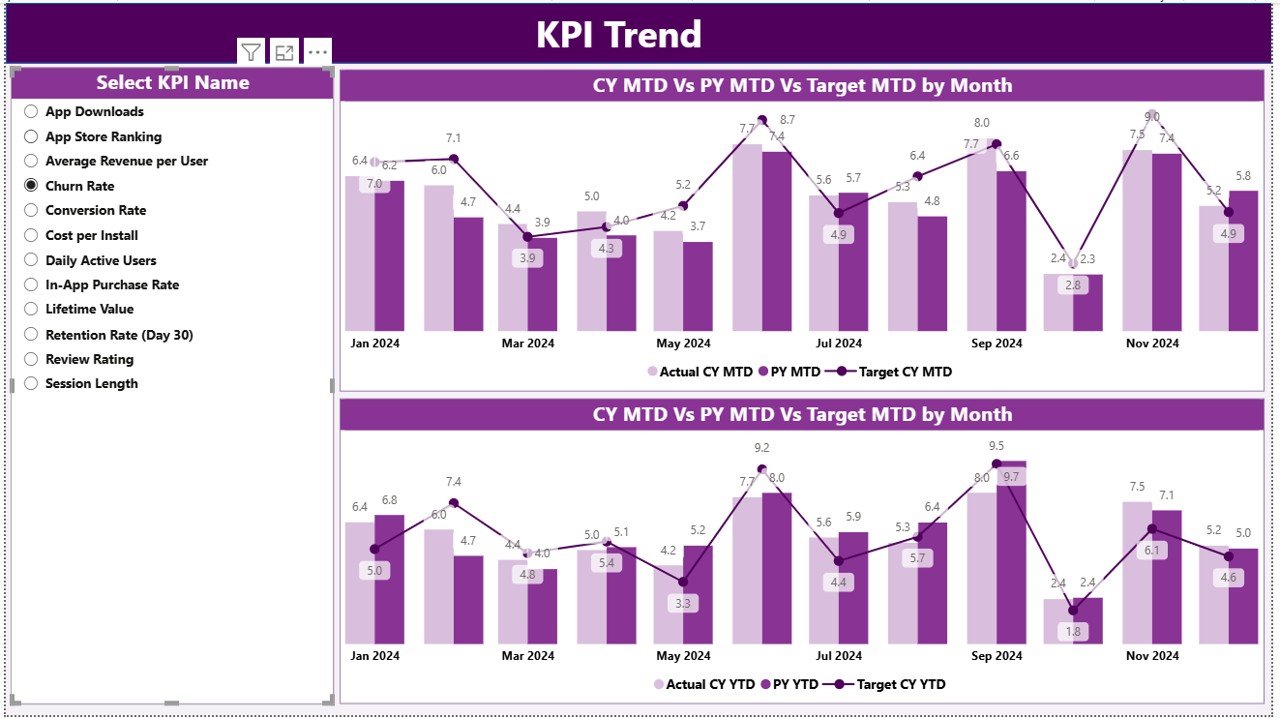
🔵 2. KPI Trend Page
Track how your KPIs evolve over time.
-
Use the KPI selector to focus on individual metrics.
-
Analyze combo charts comparing Actual vs Target vs Previous Year (MTD & YTD).
-
Identify seasonality, growth trends, and improvement opportunities.
🟣 3. KPI Definition Page
Drill down into KPI details.
-
Instantly check formulas, units, and performance types (UTB/LTB).
-
Easily return to the Summary page using a built-in back button.
Plus, the dashboard connects seamlessly with a linked Excel file containing:
-
Input_Actual Sheet – Record monthly actuals (MTD/YTD) for every KPI.
-
Input_Target Sheet – Enter target numbers for each KPI.
-
KPI_Definition Sheet – Maintain KPI name, group, formula, definition, and type.
🧭 How to Use the App Store Optimization KPI Dashboard in Power BI
1️⃣ Open the Power BI file (.pbix)
2️⃣ Connect the Excel data source (Actuals, Targets, and Definitions)
3️⃣ Select your month and KPI group from slicers
4️⃣ Review summary metrics to identify target achievements or gaps
5️⃣ Drill through any KPI to view its formula and definition
6️⃣ Compare trends using combo charts to spot performance patterns
7️⃣ Export visuals to PowerPoint or PDF for reporting or presentations
No technical skills required — simply refresh the data, and the dashboard updates automatically!
👥 Who Can Benefit from This App Store Optimization KPI Dashboard in Power BI
👨💻 App Developers – Track downloads, crashes, and ratings to refine app quality.
📱 ASO Specialists – Measure the effectiveness of keywords, descriptions, and visual assets.
📊 Marketing Teams – Understand conversion rates and optimize ad campaigns using factual data.
🏢 Product Managers – Compare actual vs target growth across different app stores.
💼 Agencies & Consultants – Deliver detailed ASO performance reports to multiple clients with ease.
💡 Business Analysts – Use insights for forecasting and predictive analysis.
Whether you’re launching a new app or managing an existing portfolio, this dashboard gives you everything you need to make informed, strategic decisions.


Reviews
There are no reviews yet.