The Antique Dealers Dashboard has always attracted collectors, historians, interior designers, and investors who value rare and historical items. From vintage furniture and antique jewelry to collectible artifacts and historical artwork, antique businesses manage products that hold both cultural and financial significance. However, running a successful antique dealership involves much more than buying and selling unique items.
Antique dealers must constantly monitor inventory turnover, evaluate sales performance, analyze dealer productivity, and understand buyer behavior. When businesses rely on scattered spreadsheets or manual reports, it becomes difficult to identify profitable categories, track high-value items, and understand market trends.
This is where the Antique Dealers Dashboard in Excel becomes an extremely powerful tool.
The Antique Dealers Dashboard in Excel is a ready-to-use analytical dashboard designed to help antique businesses monitor inventory performance, analyze sales trends, evaluate dealer productivity, and gain insights into buyer behavior. By transforming raw business data into visual charts and interactive insights, this dashboard helps dealers make faster and more informed decisions.
Instead of manually analyzing multiple reports, antique businesses can track their entire operation in one centralized Excel dashboard. With interactive charts, KPI indicators, and slicers, managers can instantly understand business performance.
Whether you run an antique store, vintage shop, auction house, estate sale business, or collectible marketplace, this dashboard provides a structured system for monitoring sales and improving profitability.
By converting complex business data into easy-to-understand visual insights, the dashboard helps antique dealers identify profitable product categories, manage inventory efficiently, and grow their business.
🚀 Key Feature of Antique Dealers Dashboard in Excel
📊 Interactive Antique Business Dashboard
Analyze antique sales, inventory performance, and profitability through dynamic Excel charts and KPI indicators.
📁 Multiple Analytical Pages
The dashboard contains multiple pages that analyze categories, dealers, buyers, and monthly trends.
🎛 Dynamic Slicers for Data Filtering
Filter dashboard data instantly by city, dealer name, category type, or buyer segment.
📈 Sales Performance Monitoring
Track total antique sales, revenue trends, and profit margins across different product categories.
💰 Profit Margin Analysis
Identify which antique eras, categories, and items generate the highest profit margins.
🏺 Inventory Performance Tracking
Monitor how long antique items remain in inventory before they are sold.
👨💼 Dealer Productivity Analysis
Evaluate which dealers generate the most sales and profit for the business.
🛍 Buyer Behavior Insights
Analyze customer segments, payment methods, and delivery preferences.
📊 Dynamic Pivot Chart Visualizations
Pivot charts automatically update when the dataset changes.
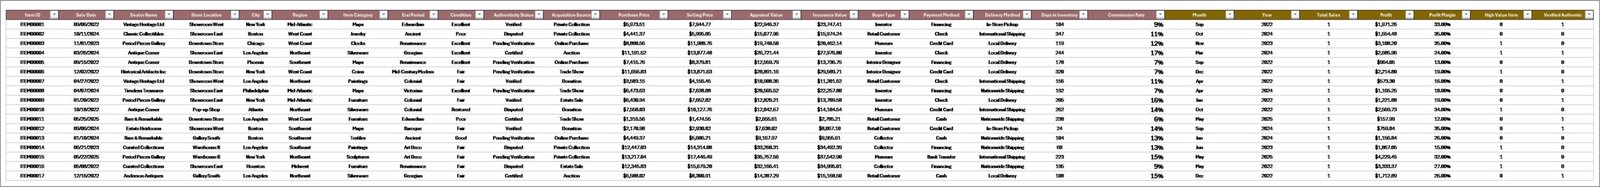
📂 Centralized Data Management
All antique transaction data is stored in a structured data sheet that powers the entire dashboard.
📊 What’s Inside the Antique Dealers Dashboard in Excel
This Excel dashboard includes five analytical pages, each designed to analyze a different aspect of the antique business.
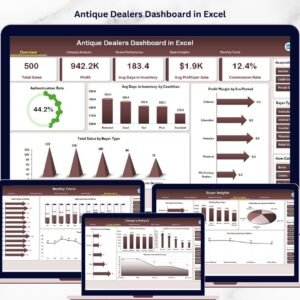
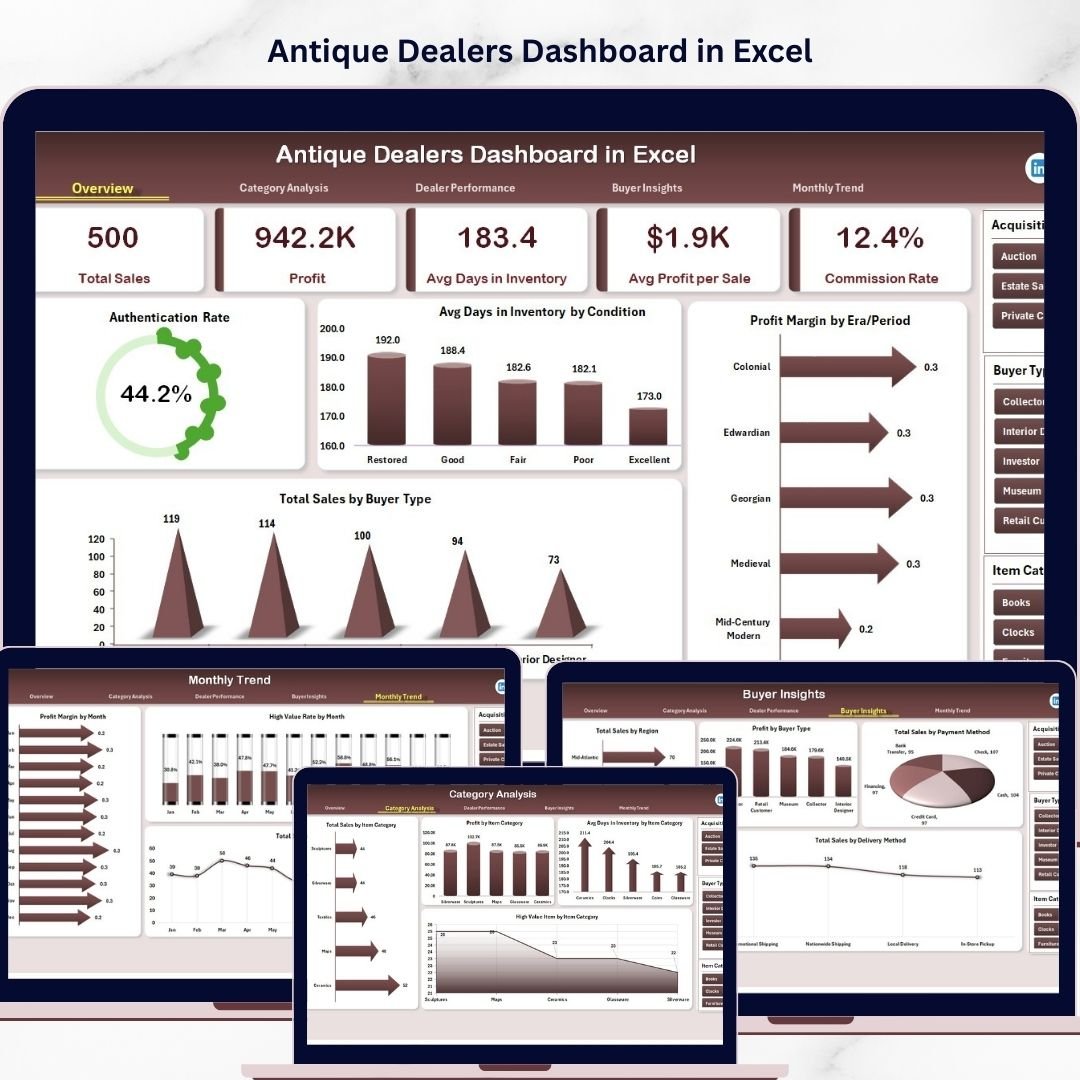
🏠 Overview Page – Business Performance Snapshot
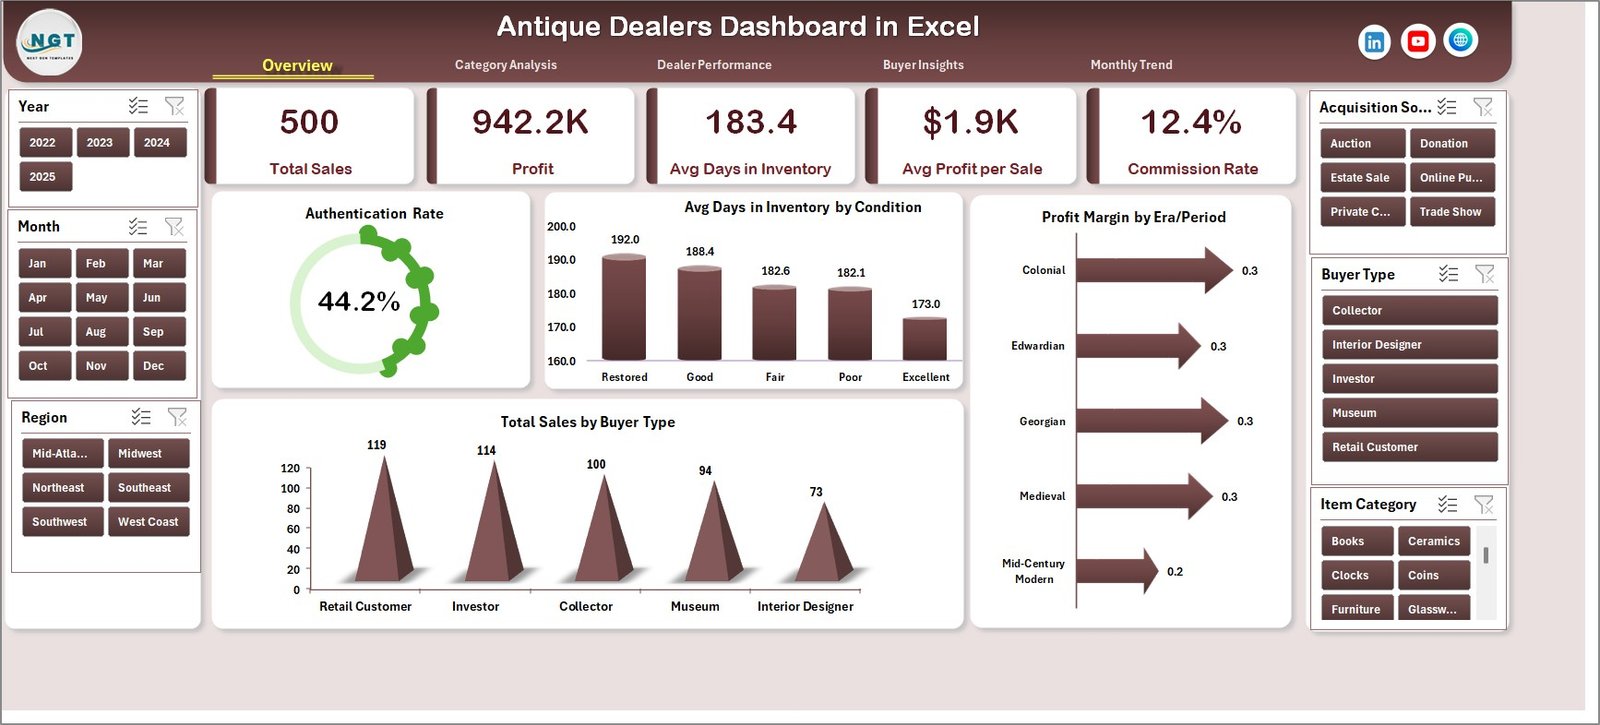
The Overview Page acts as the main dashboard and provides a quick summary of business performance.
It includes four important visual metrics:
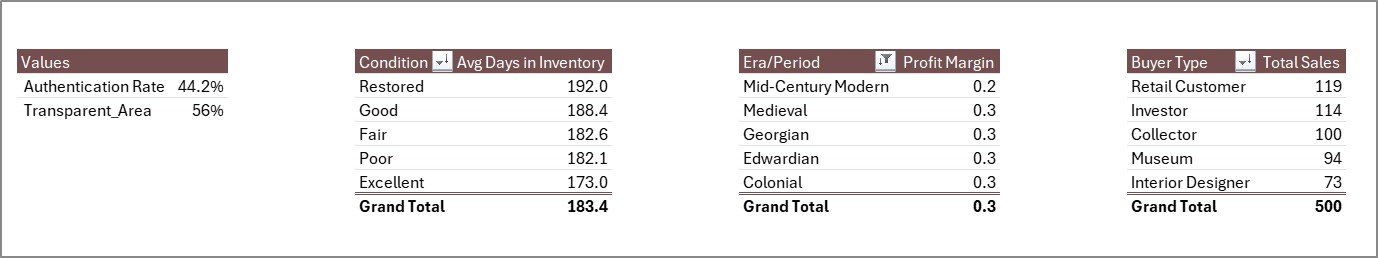
• Authentication Rate %
• Average Days in Inventory by Condition
• Profit Margin by Era Period
• Total Sales by Buyer Type
These indicators allow managers to instantly evaluate business health.
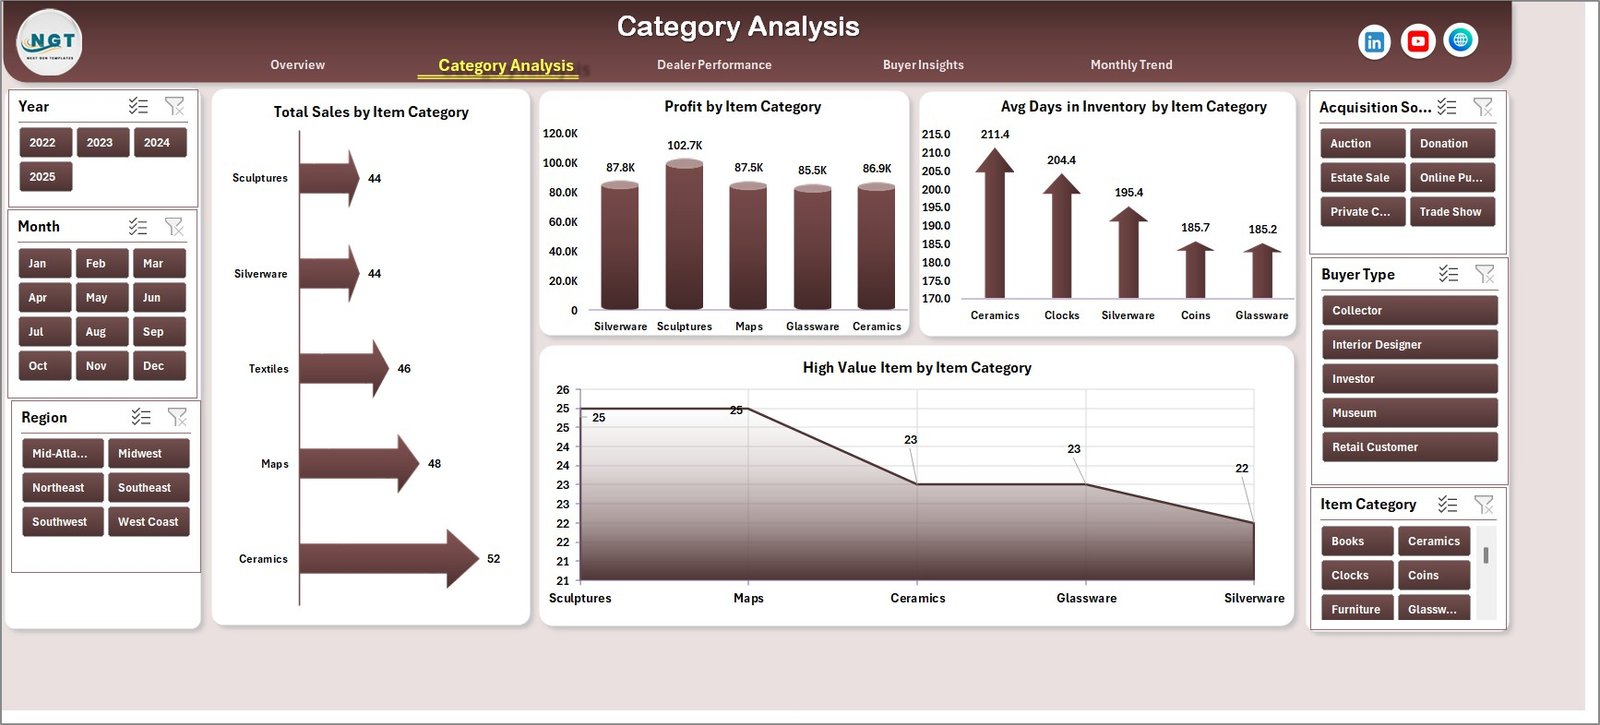
🏺 Category Analysis Page
Different antique categories often generate different sales and profit levels.
This page analyzes category performance through charts such as:
• Total Net Revenue vs Gross Sales by City
• Total Net Revenue by Category Type
• Average Revenue per Sale by Category
• Total Net Revenue by Month
This analysis helps antique businesses focus on high-performing product categories.
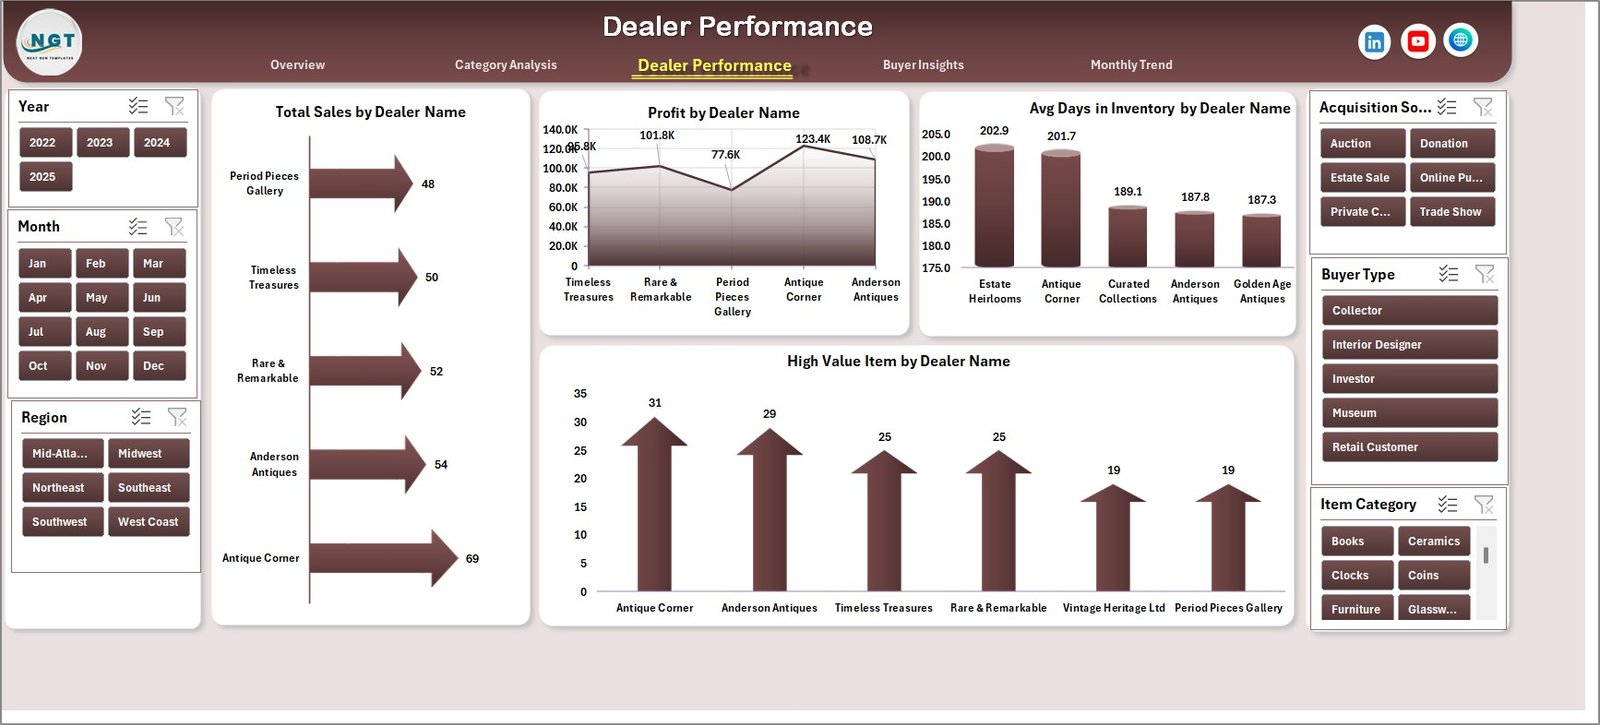
👨💼 Dealer Performance Page
Many antique businesses work with multiple dealers, agents, or collectors.
The Dealer Performance page evaluates individual dealer productivity using charts such as:
• Total Sales by Dealer Name
• Profit by Dealer Name
• Average Days in Inventory by Dealer
• High-Value Item Sales by Dealer
Managers can identify top-performing dealers and optimize team performance.
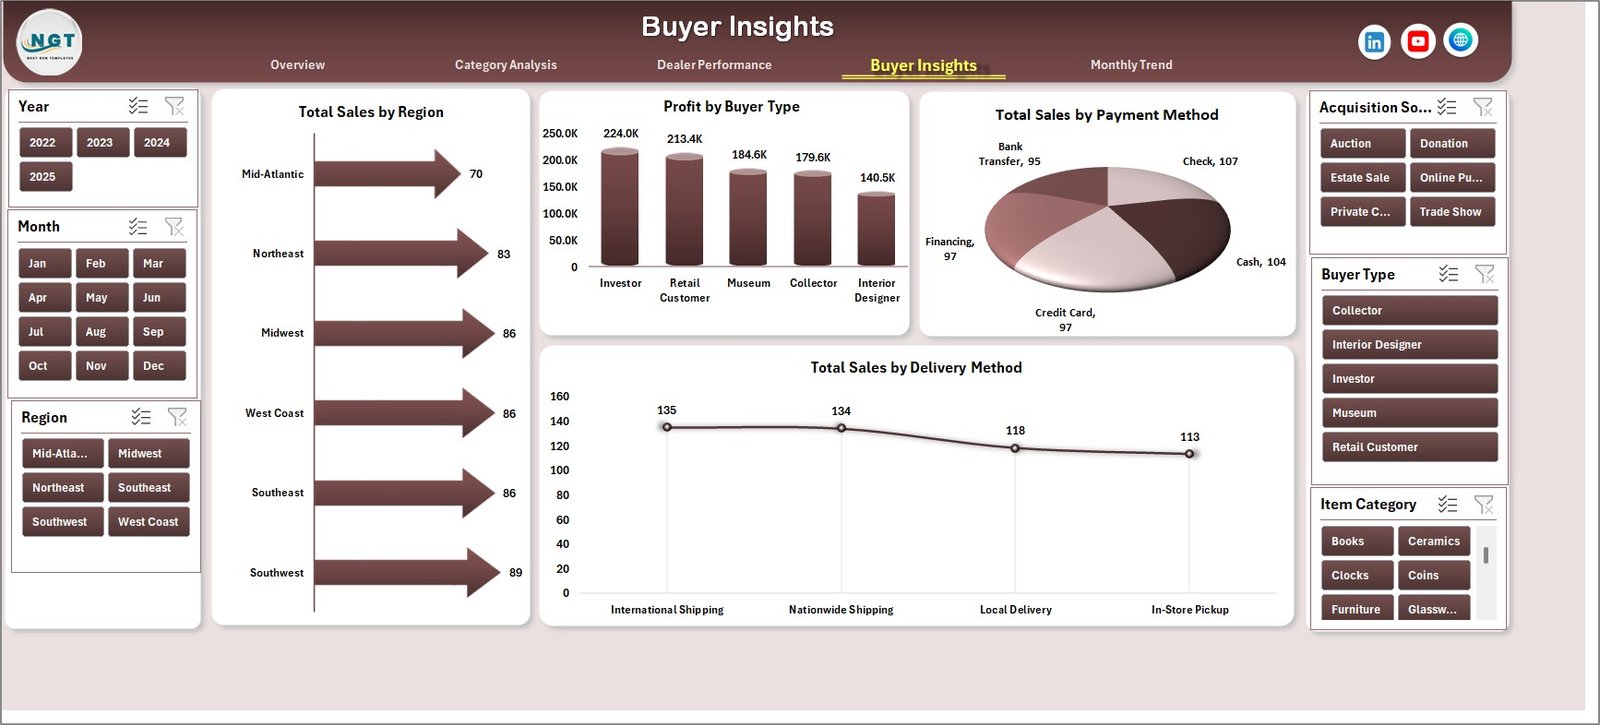
🛍 Buyer Insights Page
Understanding customer behavior is essential for improving sales strategies.
This page analyzes buyer segments and purchasing patterns using charts such as:
• Total Sales by Region
• Profit by Buyer Type
• Total Sales by Payment Method
• Total Sales by Delivery Method
These insights help businesses develop better marketing strategies and customer engagement plans.
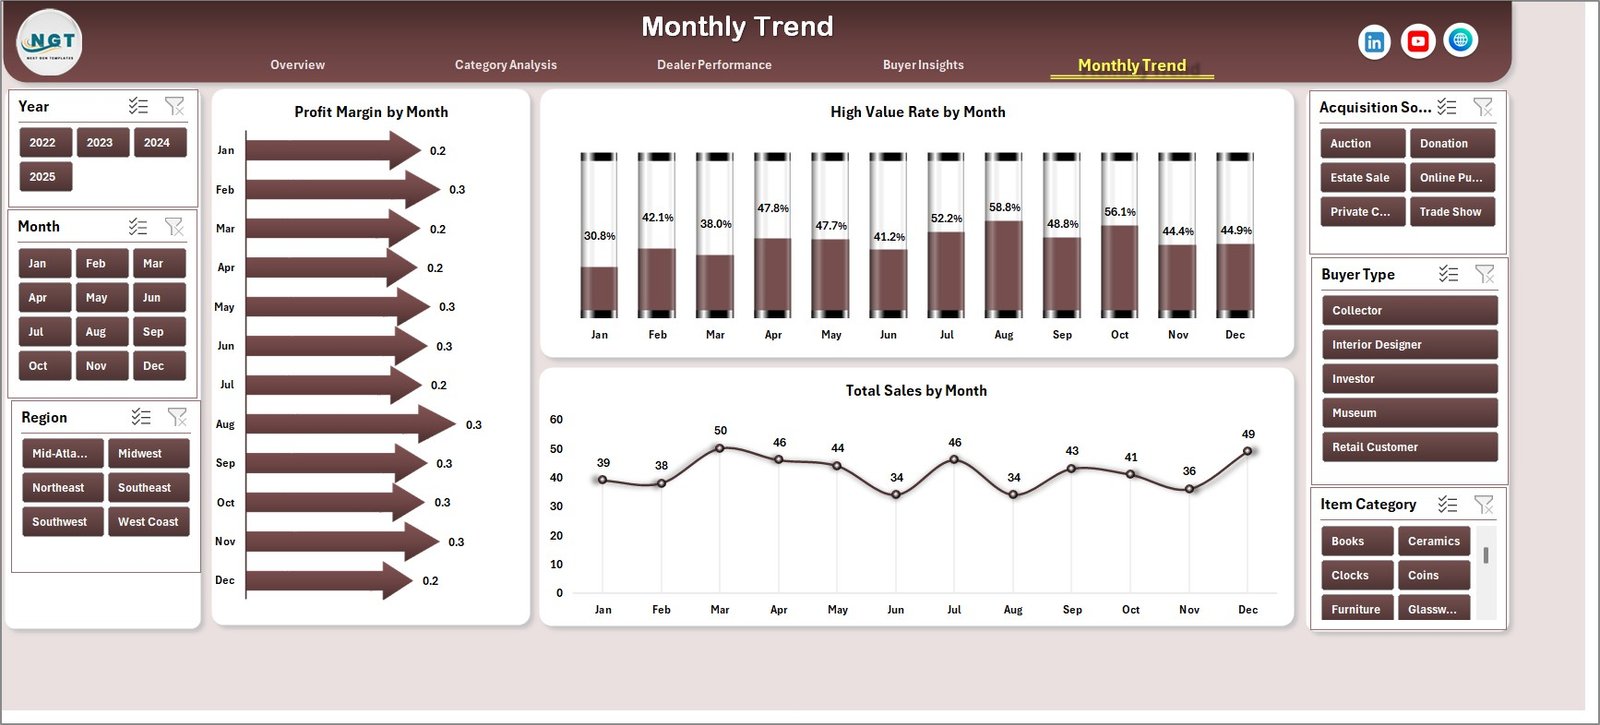
📅 Month Analysis Page
Sales performance often varies throughout the year.
This page tracks time-based trends through charts such as:
• Profit Margin % by Month
• High-Value Item Rate by Month
• Total Sales by Month
Managers can analyze seasonal trends and plan inventory purchases accordingly.
⚙️ How to Use the Antique Dealers Dashboard in Excel
Using the dashboard is simple and requires only basic Excel knowledge.
1️⃣ Enter transaction data in the Data Sheet including item name, category, dealer, buyer type, and sales amount.
2️⃣ Ensure data follows a structured format for pivot tables.
3️⃣ Refresh pivot tables to update charts and KPIs.
4️⃣ Use slicers to filter the dashboard by category, dealer, city, or buyer segment.
5️⃣ Analyze insights across different dashboard pages.
Within minutes, businesses can convert raw antique sales data into powerful analytical insights.
👨💼 Who Can Benefit from This Antique Dealers Dashboard in Excel
This dashboard is valuable for professionals across the antique and collectible industry.
🏺 Antique Dealers – Monitor inventory performance and sales trends.
🏢 Auction Houses – Track auction sales and dealer performance.
🛍 Vintage Store Owners – Analyze product category performance.
📊 Collectors & Investors – Evaluate profitability of collectible items.
🎨 Art Galleries & Estate Sale Managers – Monitor antique sales and inventory turnover.
📈 Business Analysts – Study market trends and buyer behavior.
Organizations that use this dashboard gain better operational visibility, improved inventory management, and stronger profitability insights.
Click hare to read the Detailed blog post
Visit our YouTube channel to learn step-by-step video tutorials
https://youtube.com/@PKAnExcelExpert