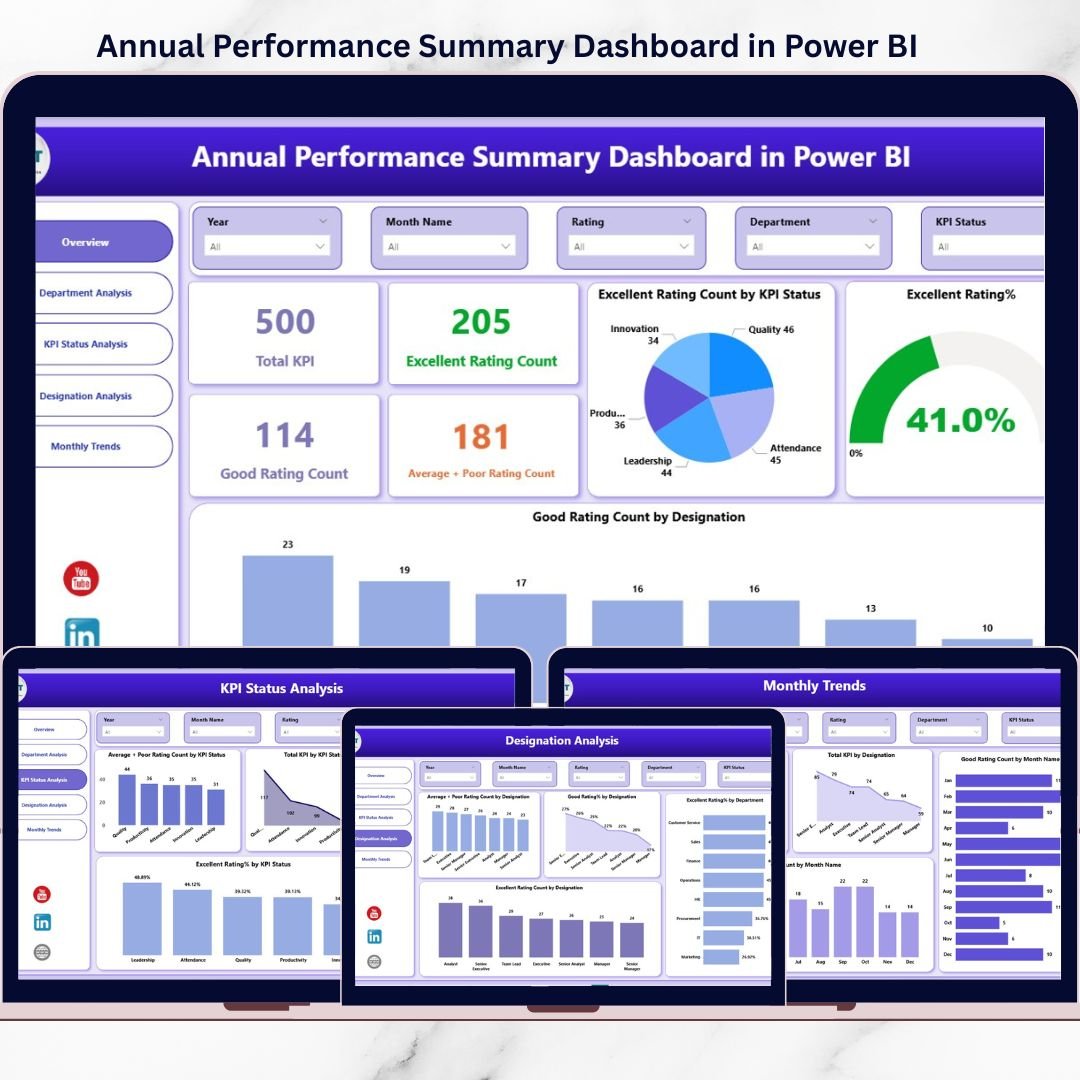
In today’s competitive business environment, tracking annual performance using scattered spreadsheets and static reports is no longer effective. Leaders need clarity, speed, and actionable insights to evaluate how departments, roles, and KPIs perform throughout the year. That is exactly where the Annual Performance Summary Dashboard in Power BI becomes a powerful decision-making tool.
This ready-to-use Power BI dashboard transforms raw annual performance data into interactive visuals, KPI summaries, and trend analysis. Instead of spending hours compiling reports, decision-makers can instantly see what is working, what needs improvement, and where strategic action is required. With dynamic slicers and visual storytelling, this dashboard delivers a complete annual performance snapshot in just a few clicks.
Designed for management, HR teams, and business leaders, this dashboard ensures transparent, data-driven performance evaluation across the organization.
## 🚀 Key Features of the Annual Performance Summary Dashboard in Power BI
📊 Five Interactive Dashboard Pages
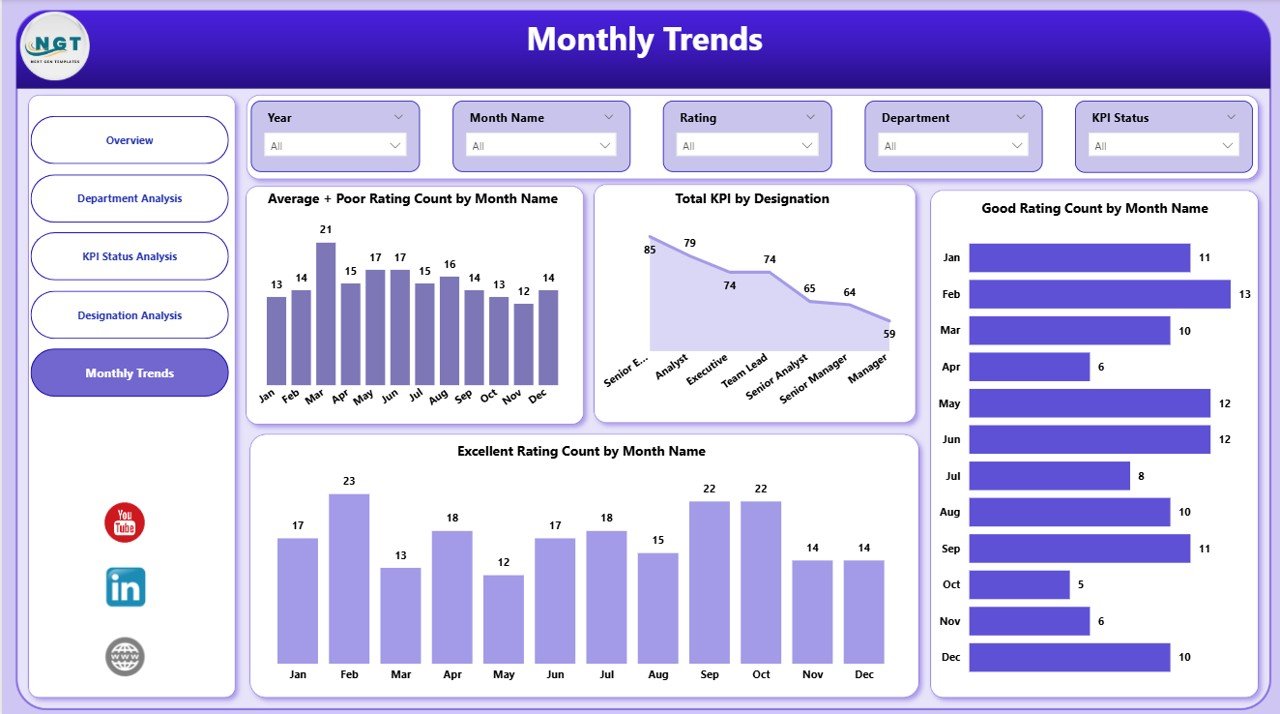
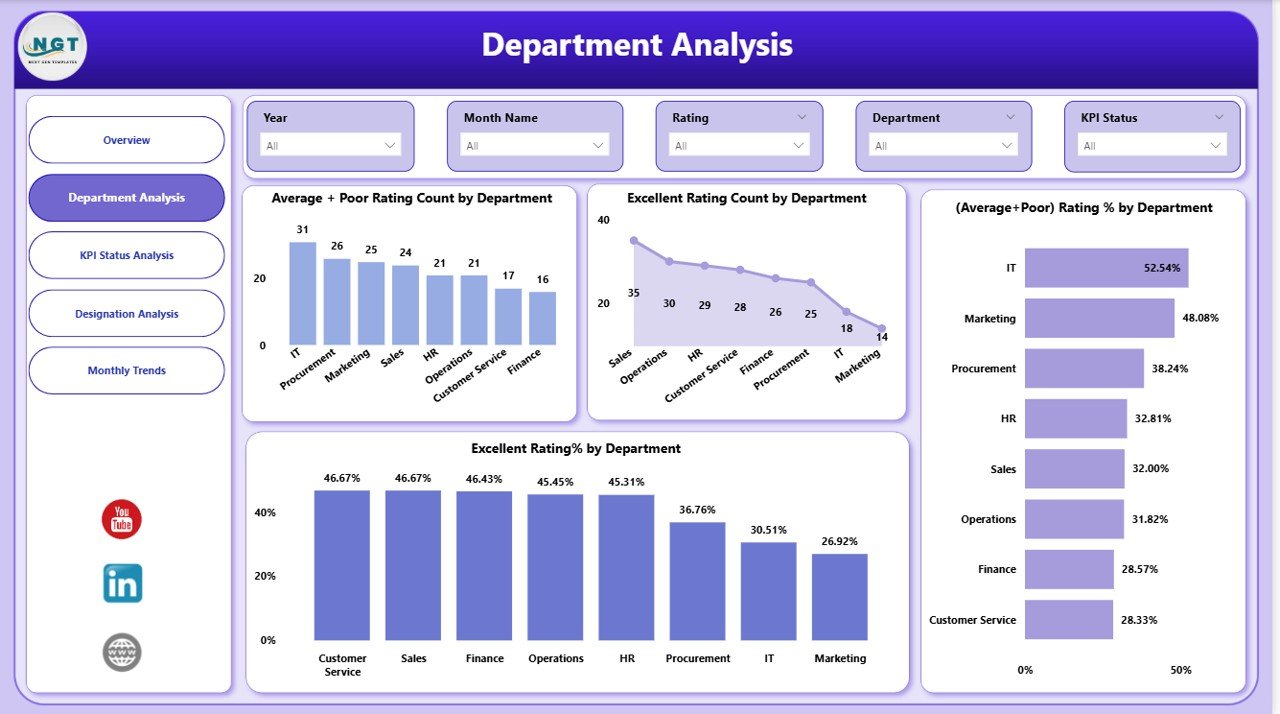
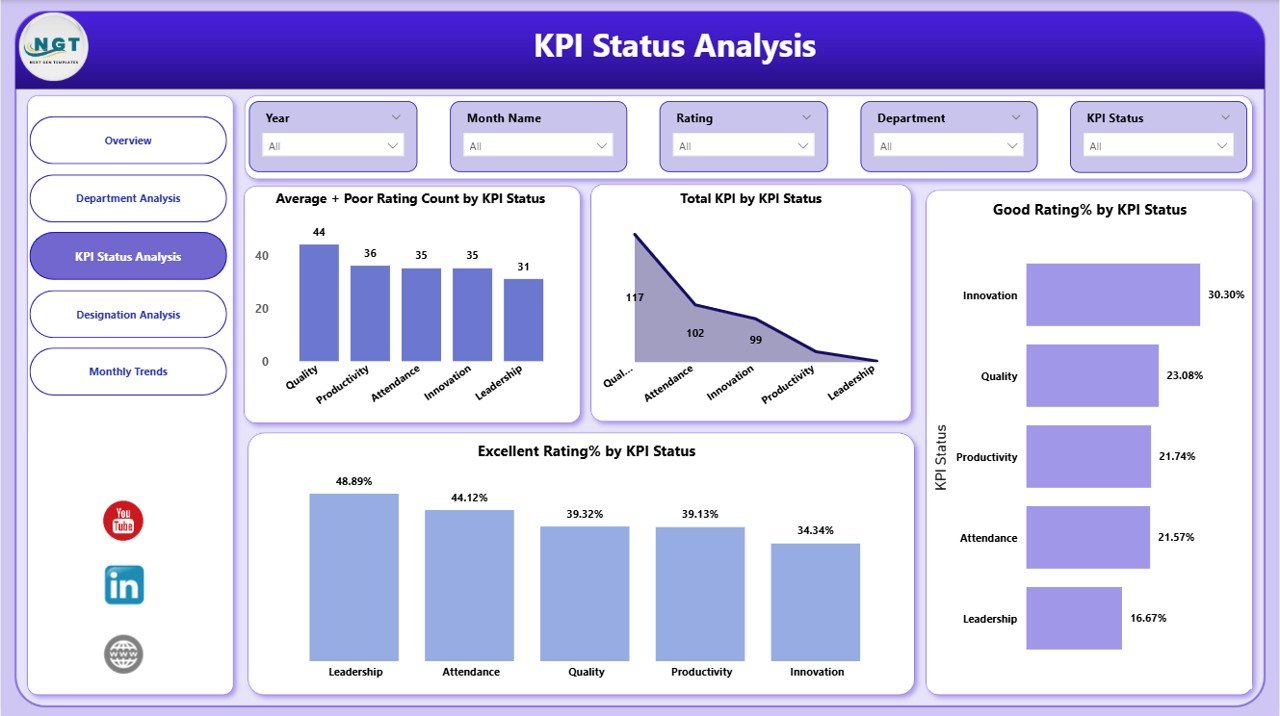
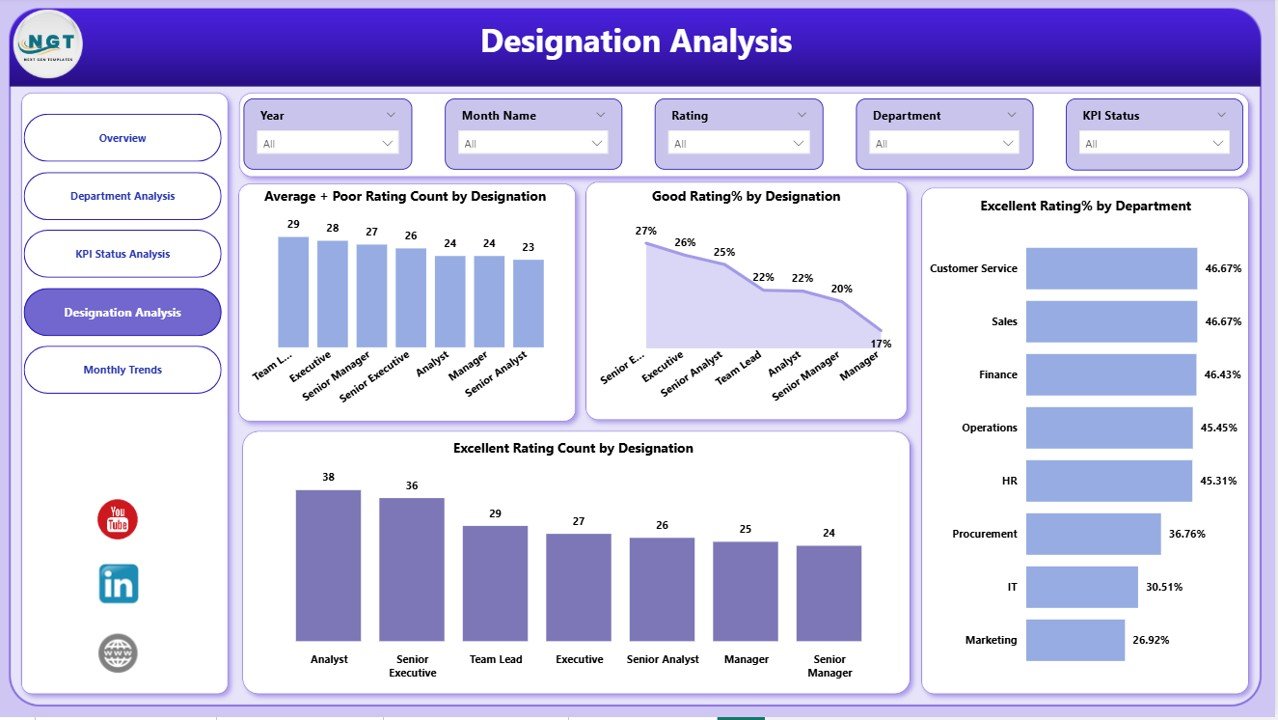
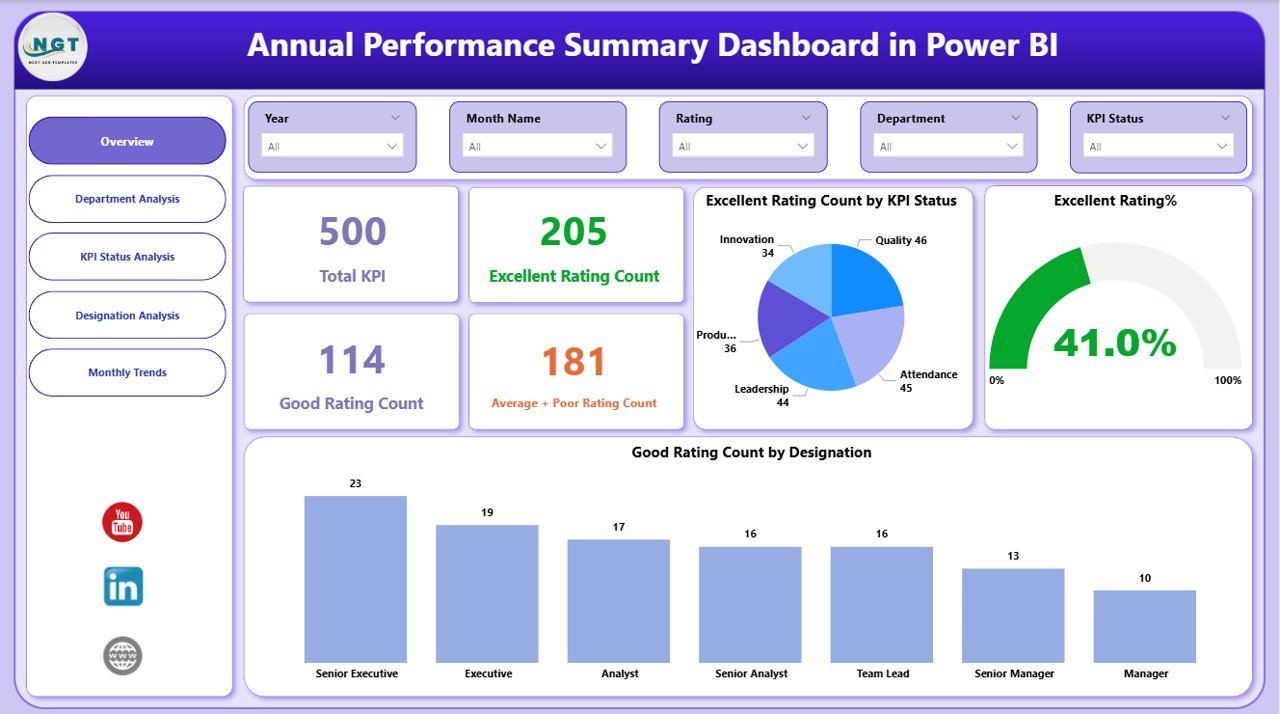
The dashboard includes Overview, Department Analysis, KPI Status Analysis, Designation Analysis, and Monthly Trends pages for complete coverage.
🎯 Smart KPI & Rating Cards
Instantly view Total KPIs, Excellent, Good, Average, and Poor ratings using dynamic KPI cards.
🎛 Advanced Slicers for Quick Analysis
Filter data by department, designation, KPI status, or time period without manual calculations.
📈 Visual Performance Comparisons
Compare performance across departments, roles, and months using charts and distributions.
⚡ Real-Time Insights
Visuals update instantly when slicers change, helping leaders react faster.
🧠 Decision-Ready Analytics
Identify high performers, underperforming areas, and improvement opportunities at a glance.
## 📦 What’s Inside the Annual Performance Summary Dashboard in Power BI
✔ Overview page with KPI cards and performance distributions
✔ Department-wise performance comparison visuals
✔ KPI Status Analysis to track KPI effectiveness
✔ Designation-based performance insights
✔ Monthly trend analysis to track performance changes
✔ Clean, professional Power BI layout
✔ Ready-to-connect data model (Excel or database)
Everything is structured to help users analyze annual performance without technical complexity.
## 🛠 How to Use the Annual Performance Summary Dashboard in Power BI
1️⃣ Connect your annual performance data (Excel or database) to Power BI
2️⃣ Load the data into the provided dashboard structure
3️⃣ Use slicers to filter by department, designation, KPI status, or month
4️⃣ Analyze ratings, trends, and distributions instantly
5️⃣ Use insights for reviews, appraisals, planning, and strategy meetings
No advanced Power BI skills are required — the dashboard is user-friendly and intuitive.
## 👥 Who Can Benefit from This Annual Performance Summary Dashboard in Power BI
🏢 Business Owners & Founders
👔 Senior Management & Leadership Teams
👩💼 HR Managers & HR Analysts
🏬 Department Heads
📊 Performance & Strategy Analysts
📈 Organizations tracking annual KPIs
Any business that evaluates yearly performance metrics will gain immediate value from this dashboard.
Click here to read the Detailed Blog Post
Watch the step-by-step video tutorial:


Reviews
There are no reviews yet.