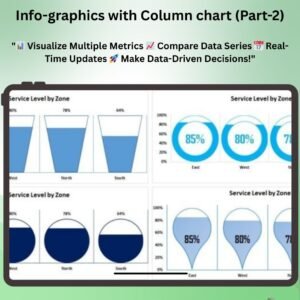
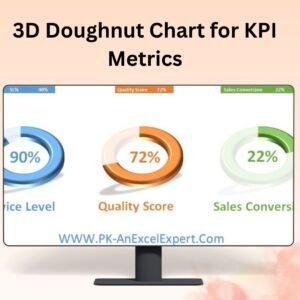
The Animated Progress Circle Chart in Excel is a dynamic and visually engaging way to track progress, performance, or goals. Unlike traditional bar or line charts, this animated chart uses a circular progress bar that fills up as data is entered, creating an eye-catching, real-time update to show the completion status of any metric.
This chart is perfect for showcasing KPIs, project progress, sales targets, or any other performance data. The customizable features allow you to adapt it to various applications, whether you’re presenting team goals, tracking milestones, or measuring individual performance. The animation adds a unique, professional touch to your reports and presentations, ensuring your data stands out and makes an impact.

Key Features of the Animated Progress Circle Chart in Excel
📌 Dynamic Animation
The animated progress circle updates in real-time as new data is entered. The chart’s circular design fills up as the progress reaches the set target, making it visually appealing and easy to understand.
🛠 Customizable Data and Labels
Easily customize the chart to track various metrics, such as project completion, sales progress, or goals. Adjust the data, labels, and thresholds to suit your specific needs.
💡 Visual Feedback
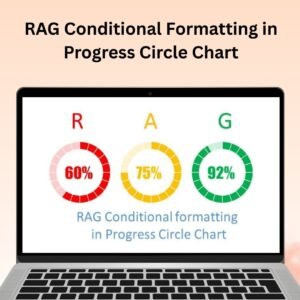
The chart not only shows how much progress has been made, but it also provides visual feedback, with different colors or sections that change as the percentage increases. This makes it easier to see and present how close you are to reaching your targets.
🔢 Real-Time Updates
As you modify or update the data, the progress circle automatically adjusts to reflect the new percentage. This feature ensures your chart is always up-to-date, whether you’re tracking daily progress or long-term goals.
🚀 Multiple Use Cases
This chart is perfect for a wide range of applications, including tracking business KPIs, monitoring project timelines, displaying personal goals, or tracking any metric that requires a visual progress indicator.
📊 Professional Design
The animated progress circle chart gives your data a professional and polished look. It’s ideal for reports, presentations, and meetings, where you want to engage your audience with visually compelling data visualizations.
⚙ User-Friendly Setup
Despite its dynamic nature, this template is simple to set up and use. You don’t need any advanced Excel skills to implement or customize the chart—just follow the clear instructions and you’re ready to go.
🚀 Why You’ll Love the Animated Progress Circle Chart
✅ Visually Engaging – The animated circle chart is a dynamic and eye-catching way to display progress. ✅ Real-Time Data Updates – Automatically adjusts as data changes, keeping your progress tracking up-to-date. ✅ Customizable – Tailor the chart to track any metric or goal with customizable labels and data. ✅ Simple Setup – Easy to implement with clear instructions, no advanced skills needed. ✅ Professional and Impactful – Perfect for presentations and reports to engage your audience and showcase your data in style.
📂 What’s Inside the Animated Progress Circle Chart in Excel?
- Animated Circle Design: A visually dynamic circular chart that tracks progress.
- Customizable Data and Labels: Adjust the chart to match any data or metric.
- Real-Time Data Updates: Automatically updates as new data is entered.
- Professional Design: Use the chart in reports, presentations, or meetings for an engaging data visualization.
- Clear Setup Instructions: Simple steps to set up and implement the chart.
🔍 How to Use the Animated Progress Circle Chart
1️⃣ Download the Template – Instant access to the Excel file upon purchase. 2️⃣ Input Your Data – Enter your data, and the chart will automatically generate. 3️⃣ Customize the Chart – Adjust labels, colors, and thresholds to match your tracking needs. 4️⃣ Track Progress – Watch the progress circle fill in real-time as the data updates. 5️⃣ Present and Share – Use the animated chart in meetings, reports, and presentations to engage your audience.
🎯 Who Can Benefit from the Animated Progress Circle Chart? 🔹 Project Managers 🔹 Business Analysts 🔹 Sales Teams 🔹 Marketing Professionals 🔹 HR and Operations Teams 🔹 Anyone tracking goals, KPIs, or performance metrics
Enhance your presentations and reports with the Animated Progress Circle Chart in Excel. Track progress, monitor goals, and display performance data in a visually engaging and professional way.
Click here to read the Detailed blog post
https://www.pk-anexcelexpert.com/animated-progress-circle-chart/
Visit our YouTube channel to learn step-by-step video tutorials
Watch the step-by-step video tutorial:









Reviews
There are no reviews yet.