Alternative medicine clinics and wellness centers are growing faster than ever. However, growth without visibility leads to confusion, inefficiencies, and missed opportunities. Many alternative healthcare organizations still depend on manual Excel reports, scattered data files, and delayed summaries. As a result, leaders struggle to understand performance clearly.
That is exactly why the Alternative Medicine KPI Dashboard in Power BI becomes a game-changing performance management solution.
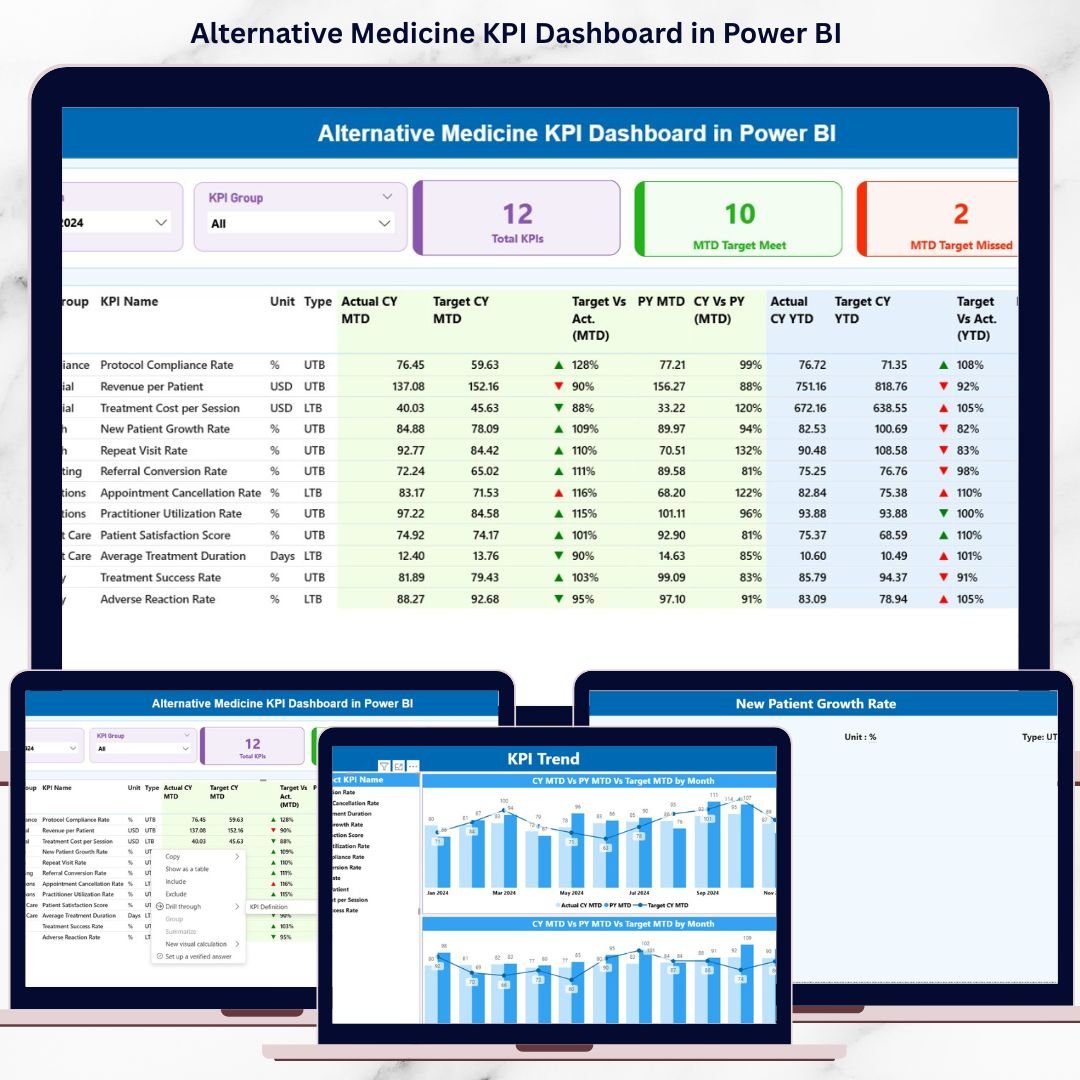
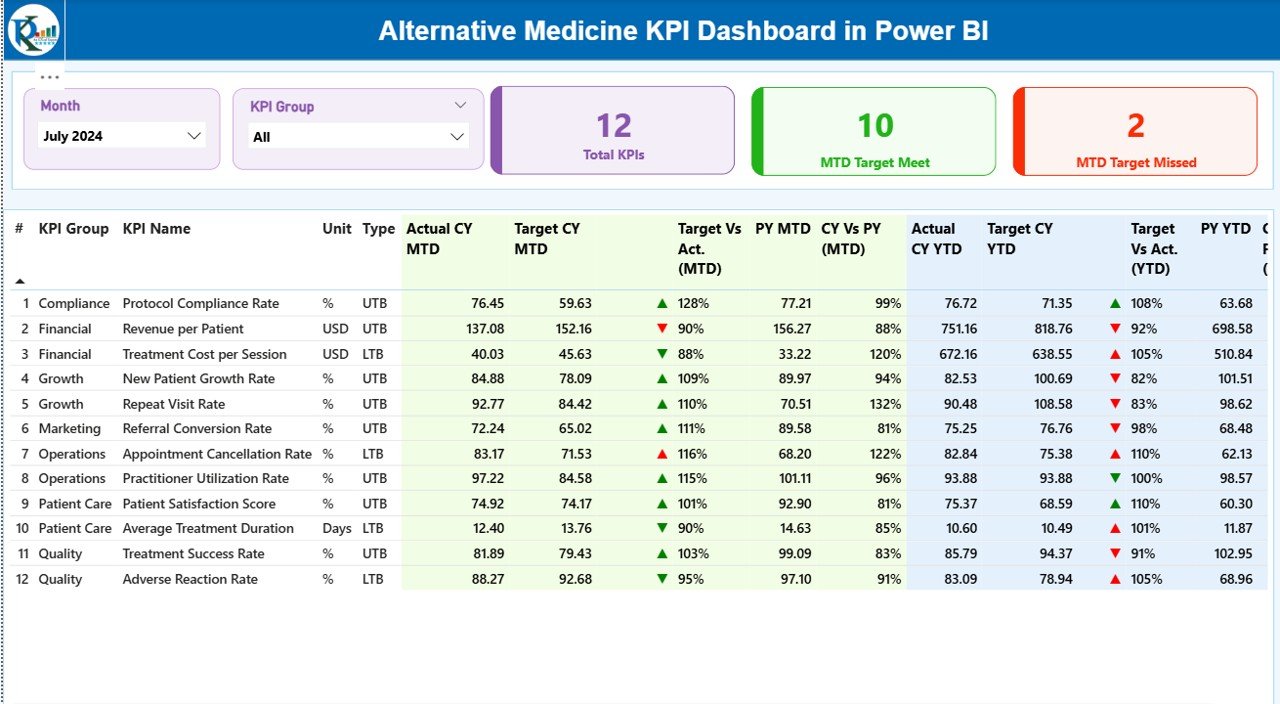
This ready-to-use dashboard transforms raw operational and clinical data into clear, interactive, and actionable insights. Instead of switching between spreadsheets, you get a centralized Power BI dashboard powered by Excel data. Moreover, it helps you monitor Month-to-Date (MTD) and Year-to-Date (YTD) performance with confidence.
Whether you manage a holistic clinic, wellness center, or alternative healthcare practice, this dashboard gives you clarity, control, and faster decision-making.
🔑 Key Features of Alternative Medicine KPI Dashboard in Power BI
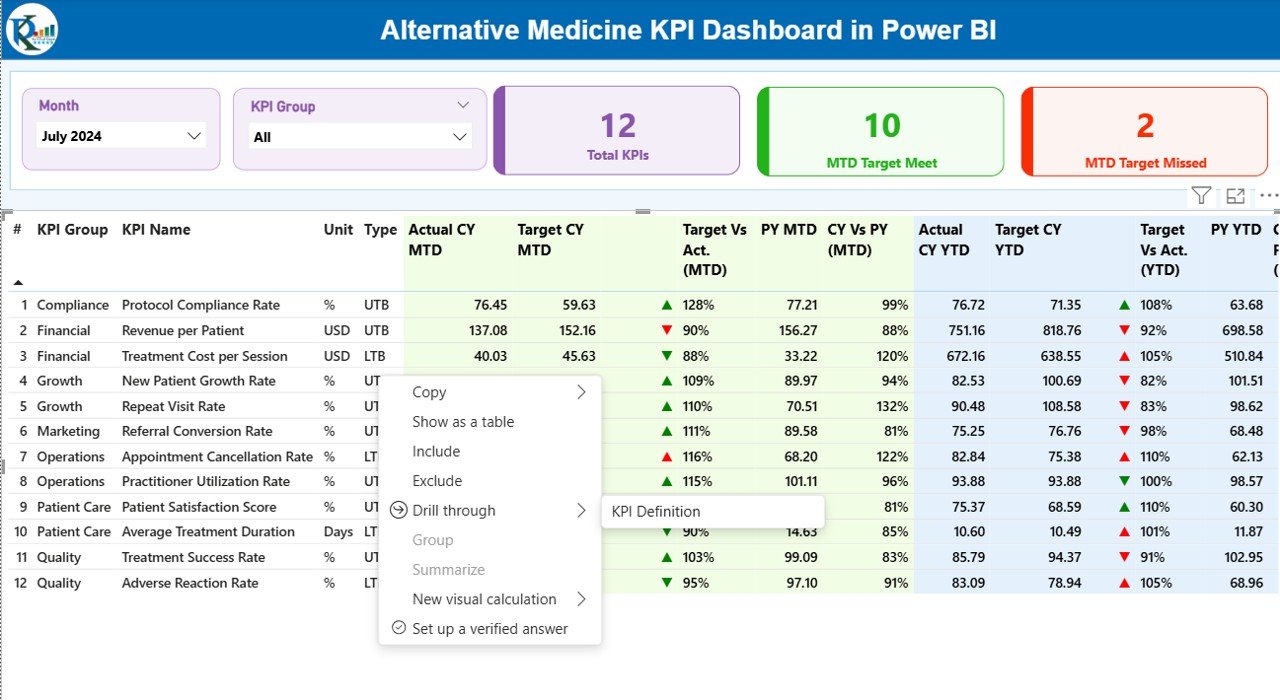
✨ Executive Summary View – Instantly track Total KPIs, MTD Target Met, and MTD Target Missed from one screen.
📊 Interactive Slicers – Filter data by Month and KPI Group for focused analysis.
📈 MTD & YTD Performance Tracking – Monitor Actual vs Target and CY vs PY comparisons.
🟢🔴 Visual Performance Indicators – Green and red icons instantly highlight success or gaps.
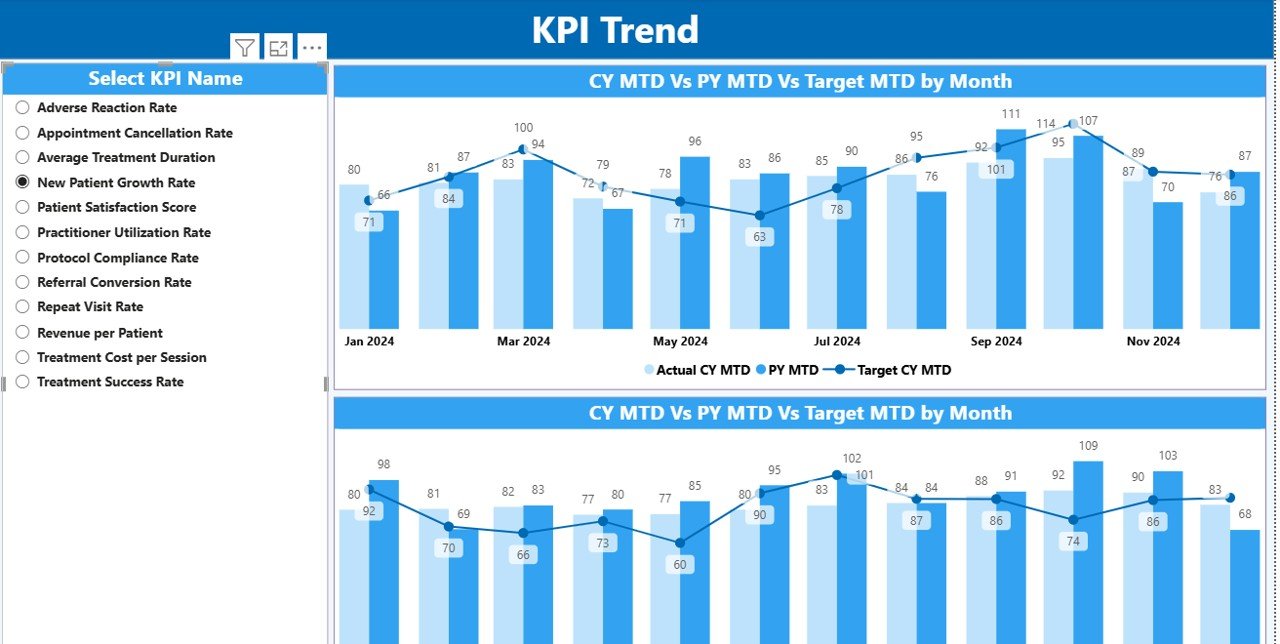
📉 KPI Trend Analysis – Analyze trends using combo charts for Current Year, Previous Year, and Targets.
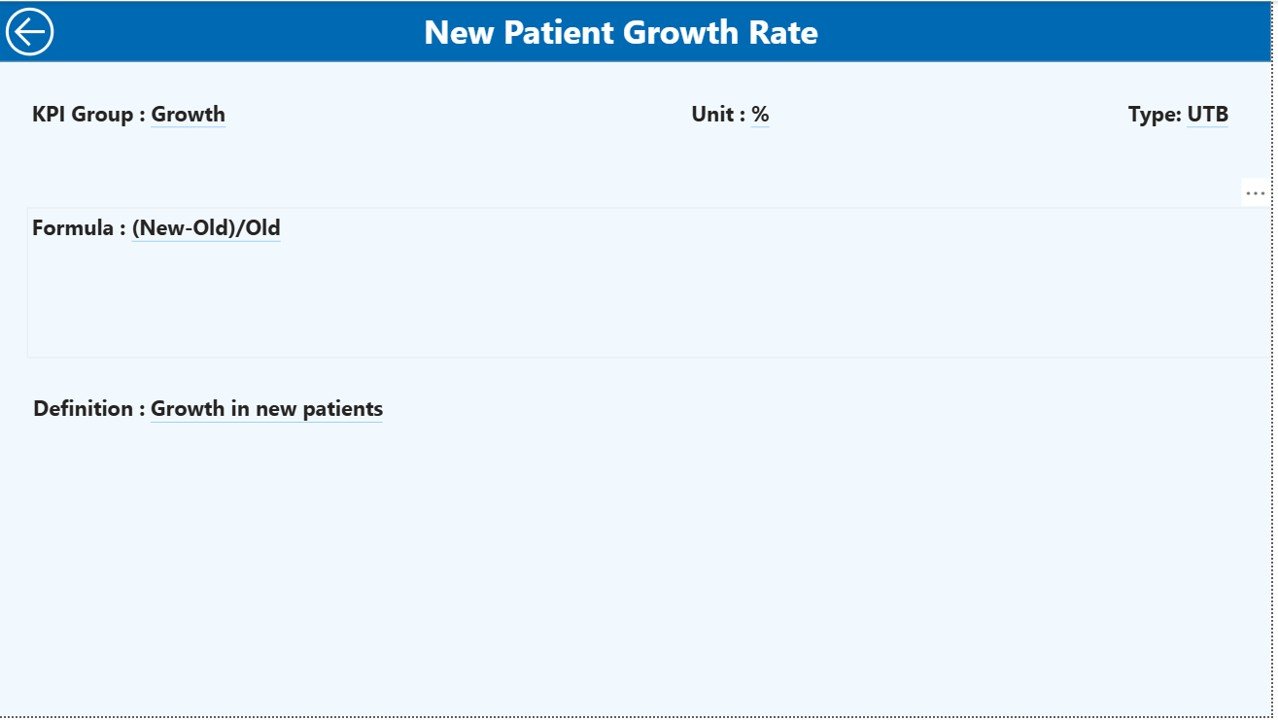
📘 KPI Definition Drill-Through – View formulas, definitions, units, and KPI types in one click.
⚡ Excel-Driven Automation – Update Excel once and auto-refresh all Power BI visuals.
🔄 Scalable & Flexible Design – Easily add or modify KPIs as your clinic grows.
📦 What’s Inside the Alternative Medicine KPI Dashboard
📁 Power BI Desktop File (.pbix) with 3 professionally designed pages
📄 Excel Data Source File with structured input sheets
📊 Summary Page – High-level KPI overview with detailed KPI table
📉 KPI Trend Page – MTD & YTD trend analysis with interactive charts
📘 KPI Definition Page – Central reference for KPI governance
🧩 Prebuilt Calculations – Target vs Actual %, CY vs PY %, icons, and indicators
🎯 Ready-to-Use Layout – No design work required
🛠️ How to Use the Alternative Medicine KPI Dashboard
1️⃣ Enter Actual KPI values in the Input_Actual Excel sheet
2️⃣ Enter Target KPI values in the Input_Target Excel sheet
3️⃣ Maintain KPI structure in the KPI Definition sheet
4️⃣ Open the Power BI file and click Refresh
5️⃣ Use slicers to analyze performance by Month and KPI Group
6️⃣ Drill through KPIs to view definitions and formulas
7️⃣ Review trends and take data-driven actions
No advanced technical skills are required. If you can update Excel, you can run this dashboard.
🎯 Who Can Benefit from This Alternative Medicine KPI Dashboard?
🏥 Alternative Medicine Clinic Owners – Gain clear visibility into operational performance
🌿 Wellness Center Managers – Track targets, trends, and improvement areas
📋 Healthcare Administrators – Improve accountability and KPI governance
📊 Operations & Quality Teams – Identify gaps and optimize processes
📈 Consultants & Analysts – Customize and deploy dashboards for clients
This dashboard works perfectly for small clinics, multi-location wellness centers, and growing healthcare organizations.
Click here to read the Detailed blog post
Watch the step-by-step video tutorial:


Reviews
There are no reviews yet.