Airports Dashboard in one of the most complex environments in the world. Every day, thousands of flights, airlines, passengers, baggage movements, and ground operations must work in perfect coordination. However, when airport data remains locked inside static reports or scattered systems, even small issues quickly turn into major delays, operational losses, and passenger dissatisfaction.
That is exactly where the Airports Dashboard in Power BI becomes a game-changing solution ✈️📊.
This ready-to-use Power BI dashboard converts raw aviation and airport operations data into interactive, visual, and real-time insights. Instead of waiting for end-of-day summaries or manually analyzing Excel files, airport authorities and airline teams can instantly monitor flight schedules, delays, baggage issues, airline performance, airport codes, regional trends, and monthly patterns.
Built using Power BI, this dashboard enables dynamic filtering, fast drill-downs, and clear storytelling with data. As a result, operations teams move from reactive problem-solving to proactive, data-driven airport management.
## ✨ Key Features of Airports Dashboard in Power BI
This dashboard is designed specifically for airport and aviation operations.
✈️ Centralized Airport Operations Monitoring
Track all critical airport KPIs in one interactive dashboard.
📊 Power BI Interactive Visuals
Slice, filter, and drill down without manual reporting.
🧭 Multi-Dimensional Analysis
Analyze data by airline, airport code, region, flight type, and month.
🧳 Baggage Issue Tracking
Identify baggage handling problems instantly.
⏱️ Delay & Cancellation Visibility
Spot delay patterns before they escalate.
📈 Time-Based Trend Analysis
Understand seasonal and monthly flight behavior.
⚡ Real-Time & Refreshable Data
Always work with the latest available information.
🛠️ Scalable & Customizable Design
Easily add KPIs, filters, or new data sources.
## 📂 What’s Inside the Airports Dashboard in Power BI
The dashboard contains five powerful analytical pages, each built to answer critical airport management questions.
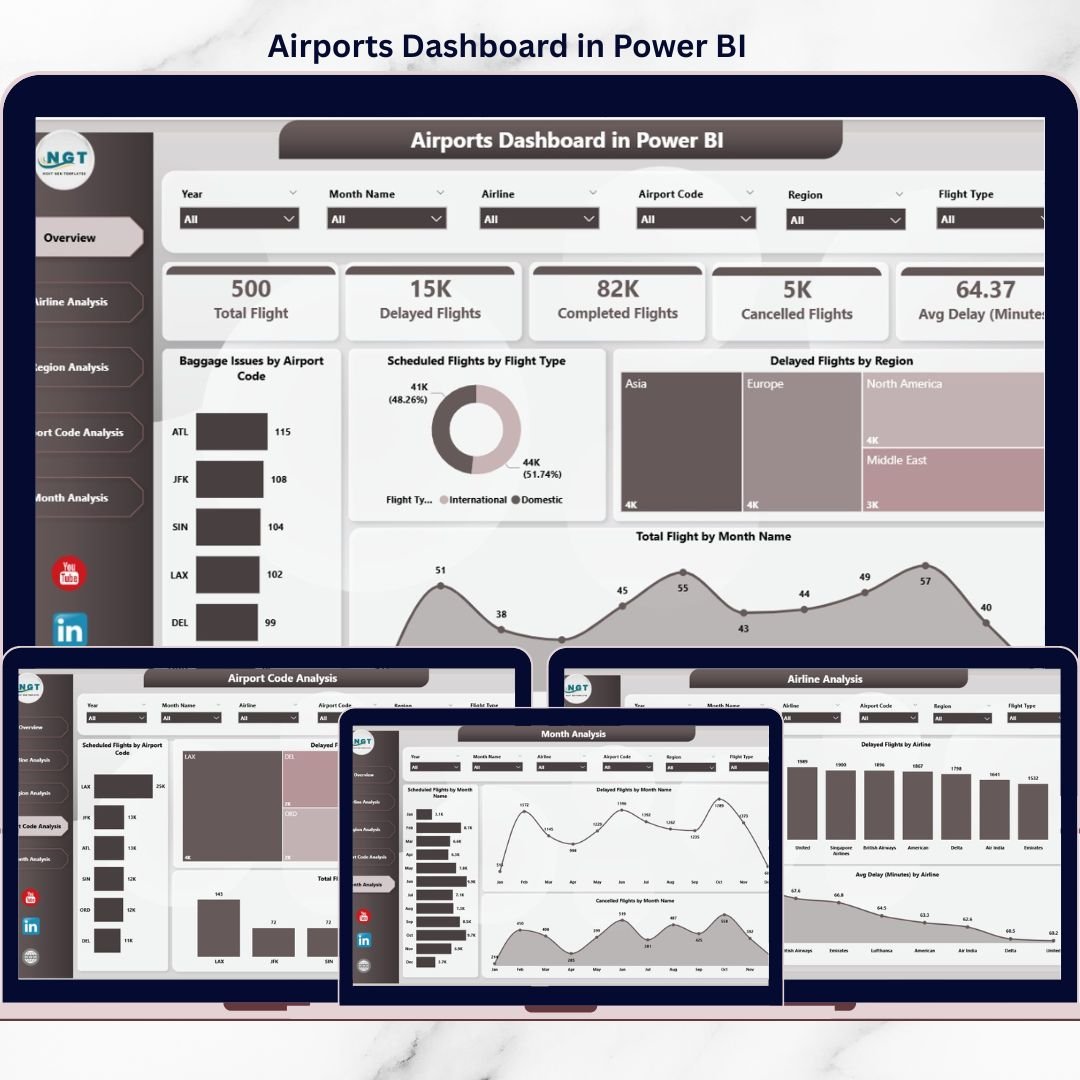
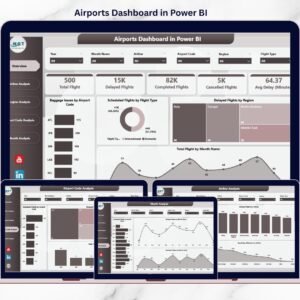
🟦 Overview Page
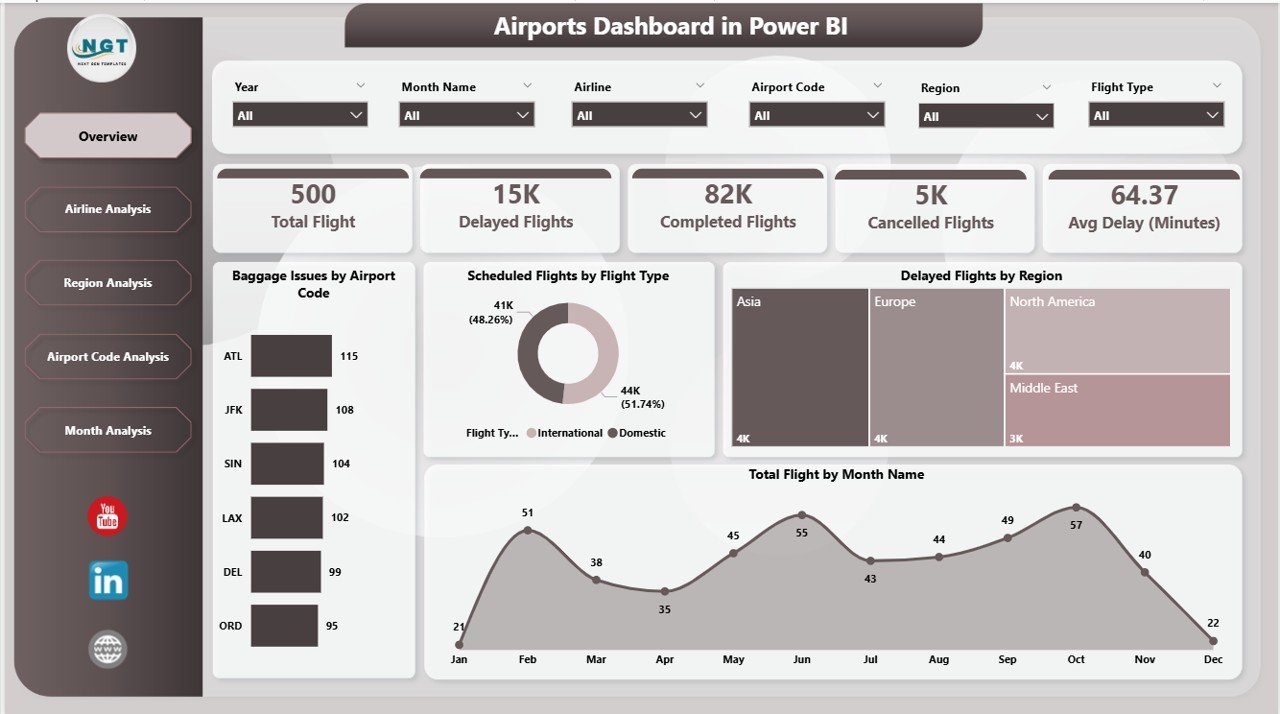
The central control panel showing:
-
Baggage Issues by Airport Code
-
Scheduled Flights by Flight Type
-
Delayed Flights by Region
-
Total Flights by Month Name
This page gives leadership an instant operational snapshot.
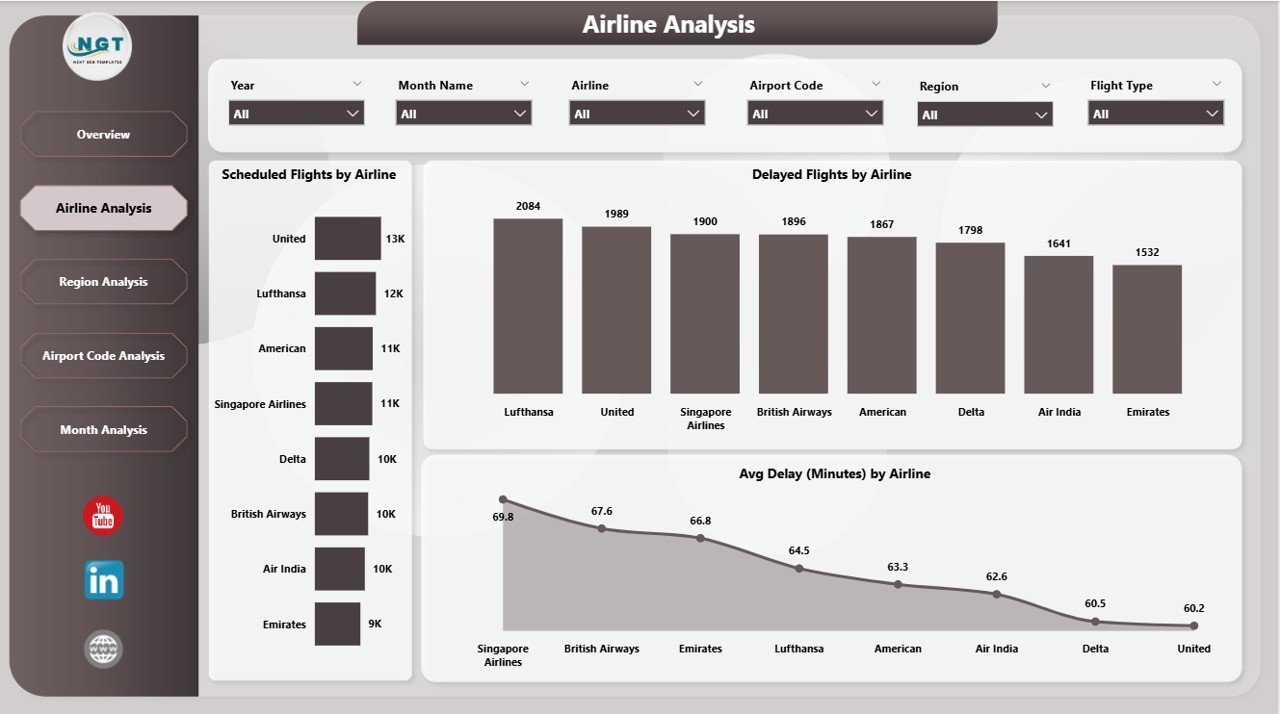
🟦 Airline Analysis Page
Focuses on airline performance using:
-
Scheduled Flights by Airline
-
Delayed Flights by Airline
-
Average Delay by Airline
Perfect for airline performance reviews and service improvement discussions.
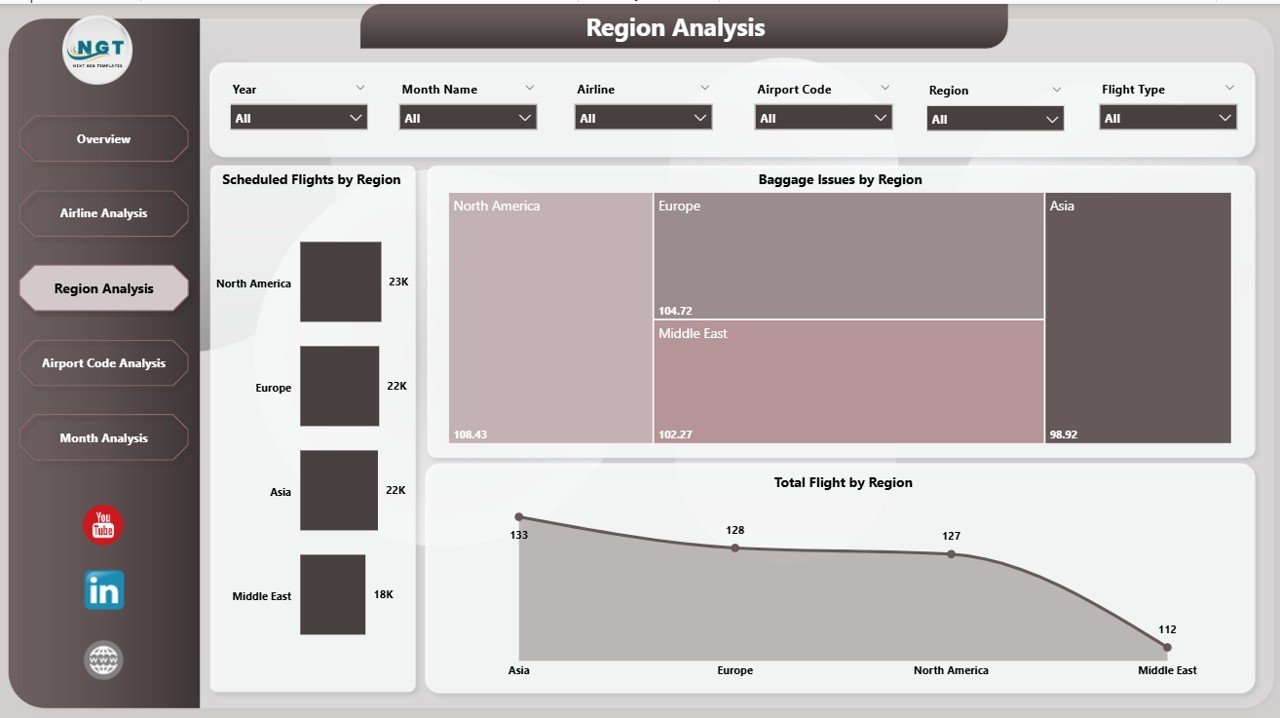
🟦 Region Analysis Page
Provides geographical insights with:
-
Scheduled Flights by Region
-
Baggage Issues by Region
-
Total Flights by Region
Helps allocate resources and improve regional efficiency.
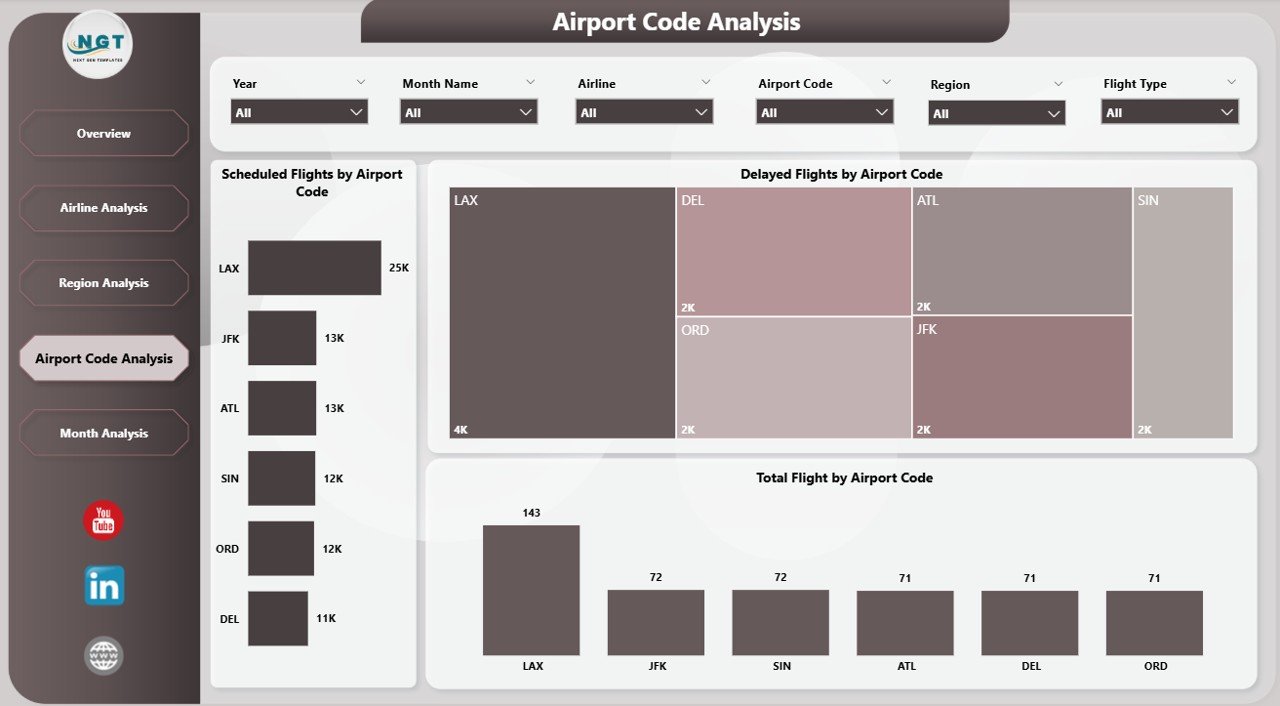
🟦 Airport Code Analysis Page
Delivers airport-level insights through:
-
Scheduled Flights by Airport Code
-
Delayed Flights by Airport Code
-
Total Flights by Airport Code
Ideal for identifying underperforming airports quickly.
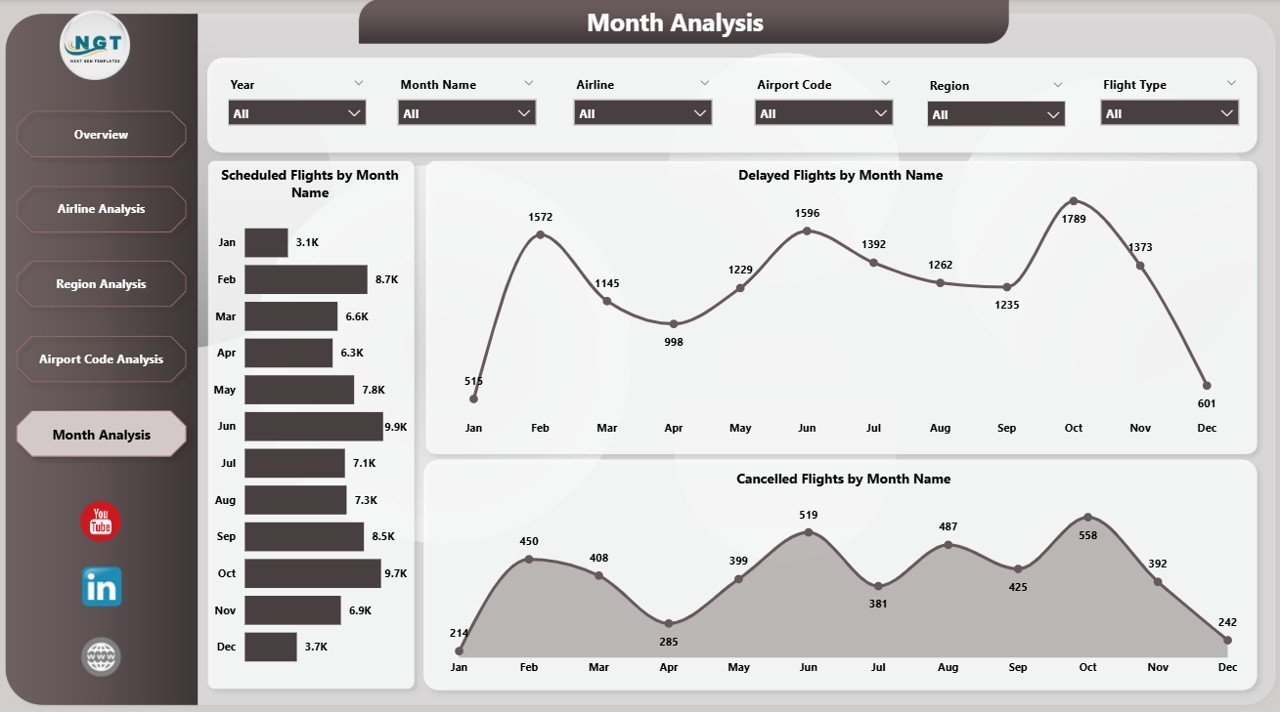
🟦 Month Analysis Page
Tracks time-based trends using:
-
Scheduled Flights by Month
-
Delayed Flights by Month
-
Cancelled Flights by Month
Supports forecasting, seasonal planning, and peak-traffic preparation.
Together, these pages deliver a complete 360-degree view of airport operations.
## 🧩 How to Use the Airports Dashboard in Power BI
Using this dashboard is simple and intuitive:
1️⃣ Connect or refresh your flight and airport data
2️⃣ Open the dashboard in Power BI
3️⃣ Use slicers to filter by airline, region, airport code, or month
4️⃣ Review delays, baggage issues, and trends instantly
5️⃣ Drill down into problem areas
6️⃣ Take proactive operational actions
No advanced Power BI skills are required to use the dashboard—only basic familiarity.
## 👥 Who Can Benefit from This Airports Dashboard in Power BI
This dashboard is ideal for:
✔️ Airport Operations Managers
✔️ Airport Authorities
✔️ Airline Operations Teams
✔️ Ground Handling Teams
✔️ Baggage Management Teams
✔️ Aviation Analysts
✔️ Senior Leadership & Strategy Teams
Both technical and non-technical users can extract insights confidently.
### Click here to read the Detailed blog post
Visit our YouTube channel to learn step-by-step video tutorials
👉 https://youtube.com/@PKAnExcelExpert


Reviews
There are no reviews yet.