
The short-term rental industry has experienced tremendous growth over the last decade. Platforms like Airbnb, Vrbo, and Booking.com have transformed how travelers book accommodations and how property owners generate income. Today, hosts and property managers operate multiple apartments, vacation homes, and rental properties across various cities and regions.
However, managing rental performance without proper analytics can quickly become complicated. Property managers must track bookings, occupancy rates, revenue trends, cancellations, host performance, and guest activity. When this data is spread across multiple spreadsheets, identifying trends and making strategic decisions becomes difficult.
This is where the Airbnb-style Rentals Dashboard in Excel becomes a powerful solution.
The Airbnb-style Rentals Dashboard in Excel is a ready-to-use analytical dashboard designed to help hosts and property managers monitor bookings, track occupancy performance, analyze revenue trends, and evaluate rental performance across different cities and properties.
Instead of manually analyzing hundreds of rows of booking data, this dashboard converts raw rental data into interactive charts, KPI cards, and visual insights. As a result, property managers can instantly identify trends, monitor performance metrics, and improve business outcomes.
Whether you manage Airbnb properties, vacation rentals, serviced apartments, or short-term rental portfolios, this Excel dashboard provides a centralized system for tracking performance and making smarter decisions.
By transforming complex booking data into meaningful insights, the dashboard helps property managers optimize pricing strategies, improve occupancy rates, and maximize rental revenue.
🚀 Key Feature of Airbnb-style Rentals Dashboard in Excel
📊 Interactive Rental Performance Dashboard
Monitor bookings, occupancy rates, and revenue using dynamic charts and KPI indicators.
📅 Multiple Analytical Pages
Analyze rental data from different perspectives including revenue, host performance, booking trends, and monthly activity.
🎛 Dynamic Slicers for Data Filtering
Filter rental data instantly by city, host type, booking status, or property type.
📈 Booking Performance Tracking
Track total bookings, guest volume, and reservation trends across multiple properties.
💰 Revenue Analysis Dashboard
Monitor gross booking value, net revenue, and revenue performance across cities and hosts.
🏠 Host Property Performance Insights
Evaluate performance by property type, bedroom count, and host category.
⚠️ Cancellation Trend Analysis
Identify cancellation patterns and evaluate the impact of different cancellation policies.
🌍 City-wise Performance Monitoring
Compare booking demand and revenue across different cities.
📊 Pivot Chart-Based Visualizations
Dynamic pivot charts automatically update when booking data is refreshed.
📁 Centralized Data Management
All booking records are stored in a structured data sheet that powers the entire dashboard.
📊 What’s Inside the Airbnb-style Rentals Dashboard in Excel
This Excel dashboard includes five analytical pages, each designed to provide insights into different aspects of rental performance.
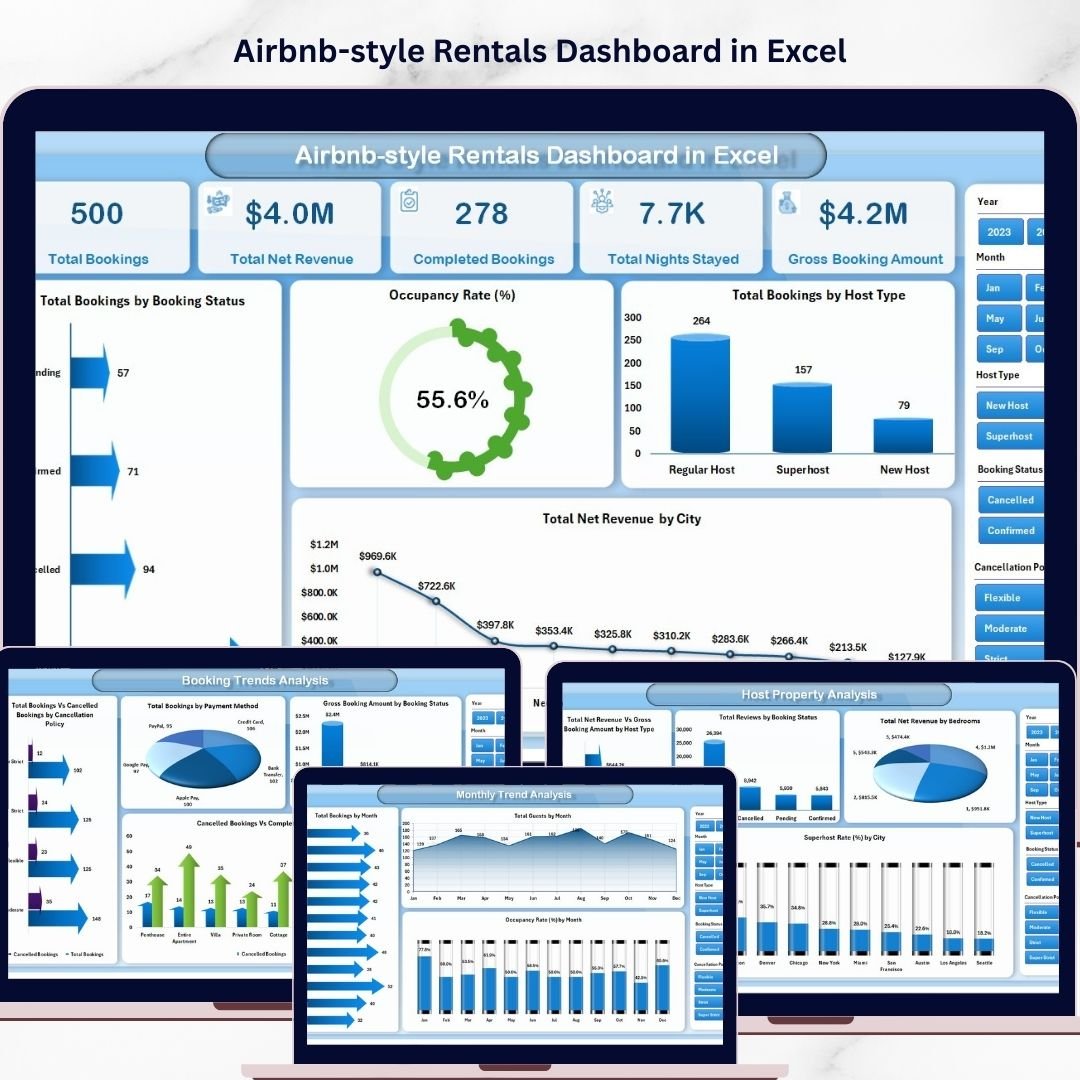
🏠 Overview Page – Rental Business Snapshot
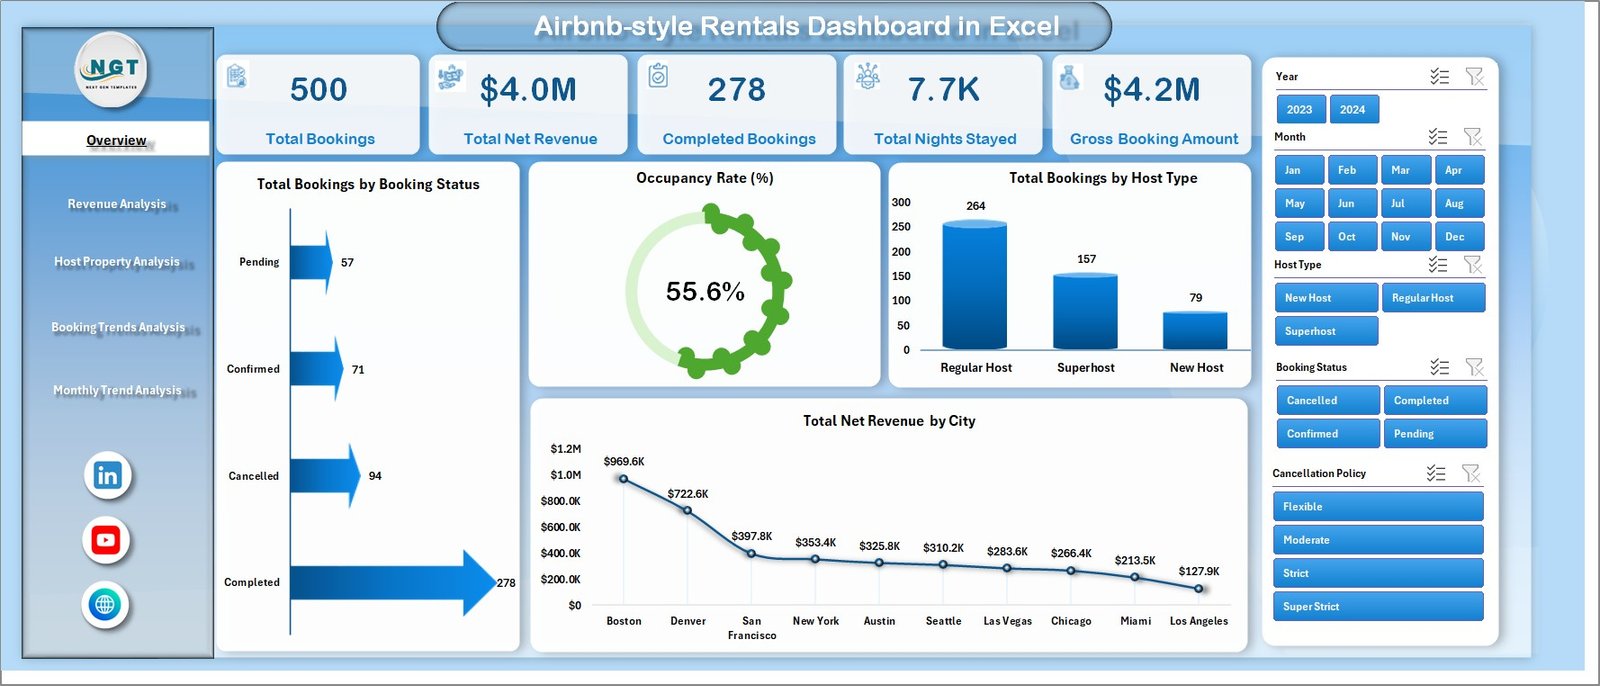
The Overview Page acts as the main dashboard and provides a quick summary of rental performance.
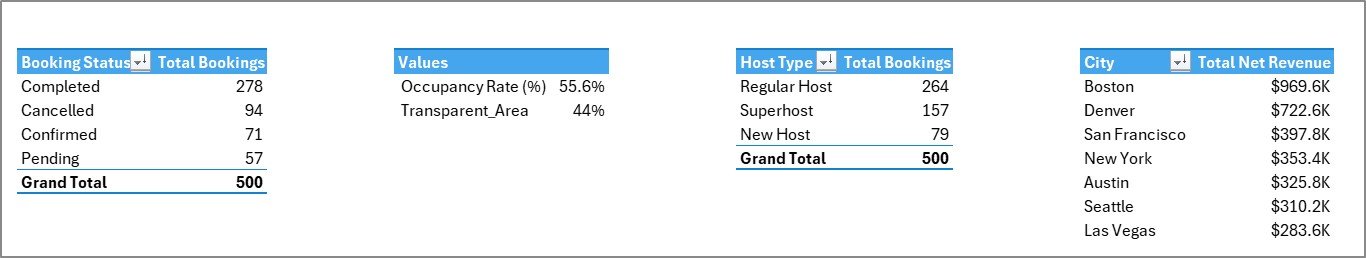
This page includes four KPI cards:
• Total Bookings
• Occupancy Rate %
• Total Guests
• Total Net Revenue
These KPIs help property managers evaluate performance instantly.
The page also includes visual charts such as:
• Total Booking by Booking Status
• Occupancy Rate %
• Total Booking by City
• Total Net Revenue by City
These insights help managers understand demand patterns and revenue distribution.
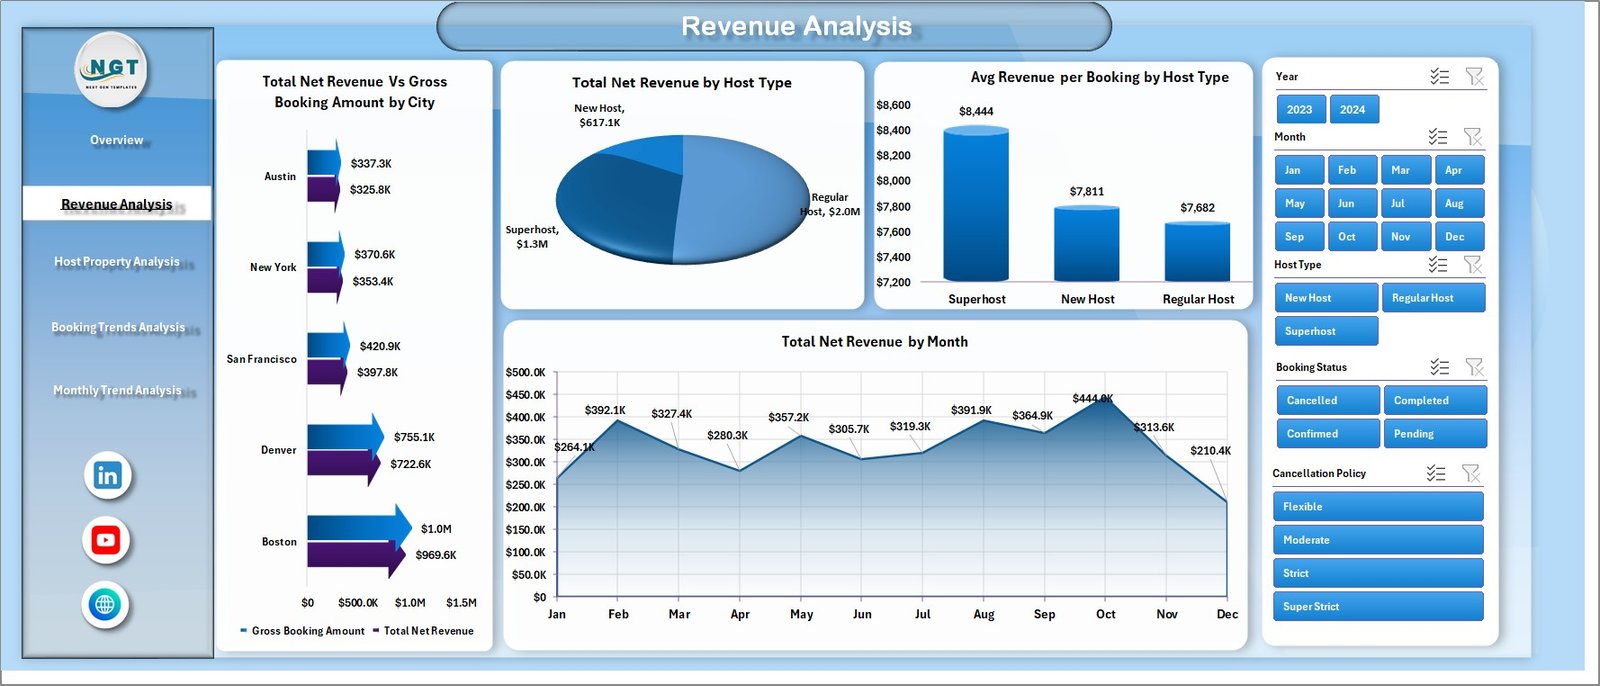
💰 Revenue Analysis Page
Revenue plays a critical role in rental success. This page focuses on income performance and financial trends.
Charts on this page include:
• Total Net Revenue vs Gross Booking Amount by City
• Total Net Revenue by Host Type
• Average Revenue per Booking by Host Type
• Total Net Revenue by Month
This analysis helps property managers optimize pricing and identify high-performing hosts.
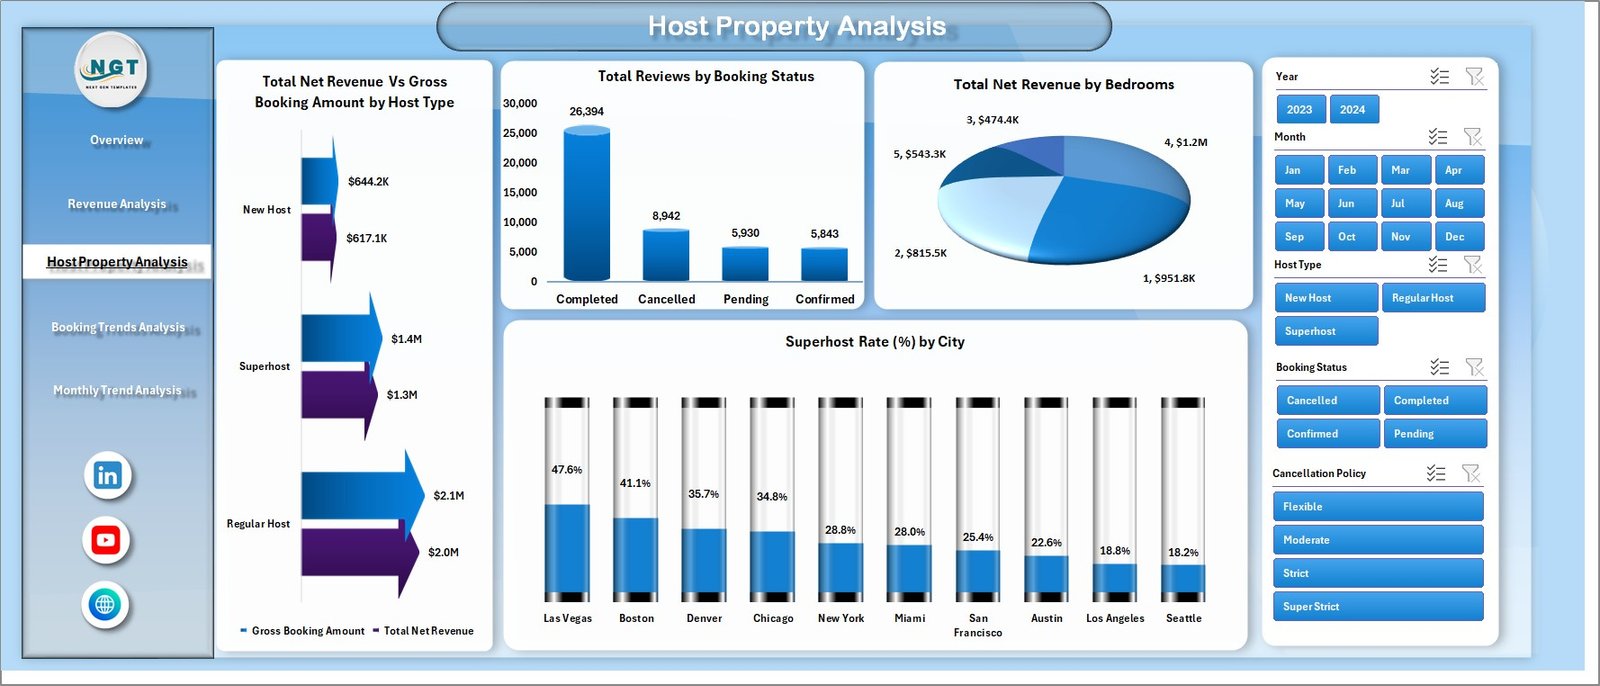
🏢 Host Property Analysis Page
Different property types and hosts contribute differently to rental performance.
This page analyzes host and property performance through charts such as:
• Total Net Revenue vs Gross Booking Amount by Host Type
• Total Net Revenue by Booking Status
• Total Net Revenue by Bedrooms
• Superhost Rate % by City
These insights help identify the most profitable property types and host categories.
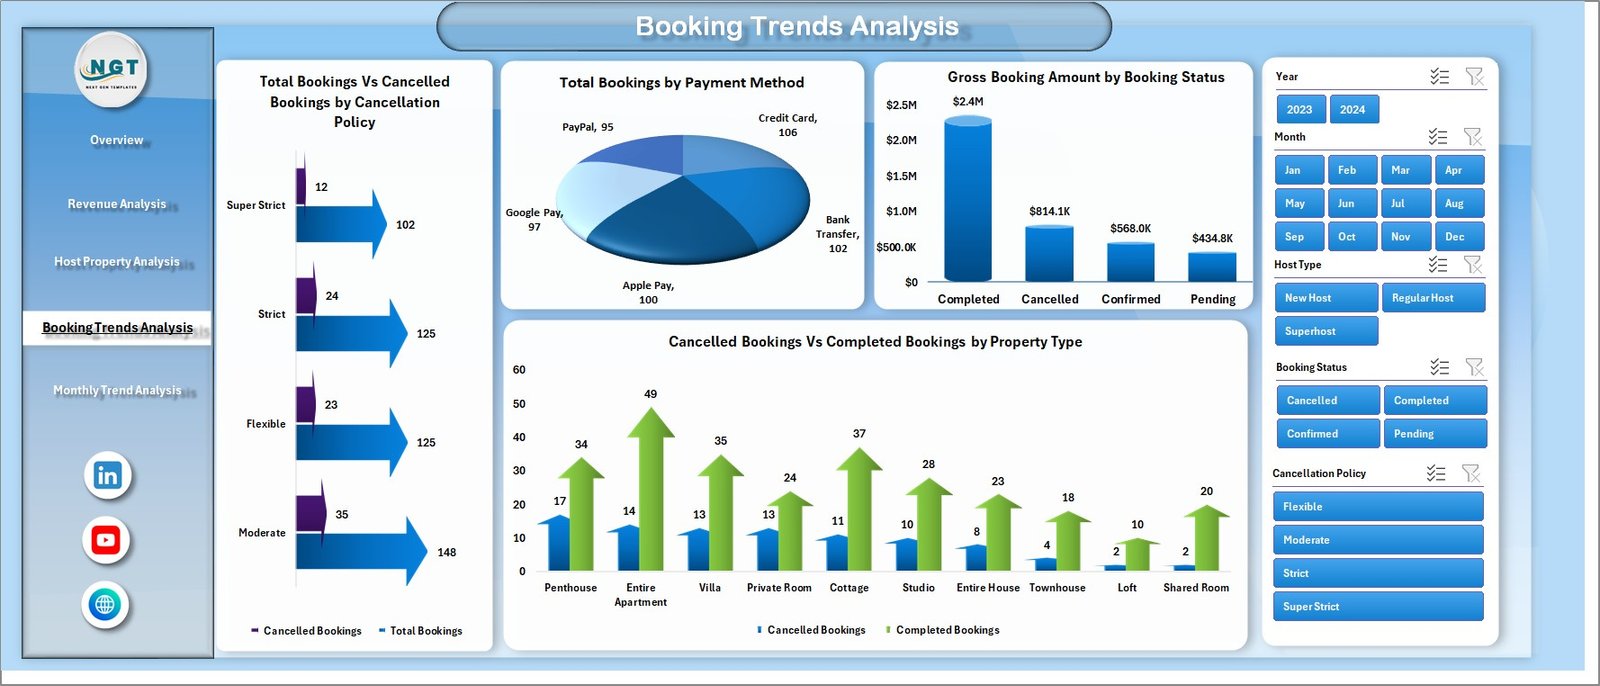
📊 Booking Trends Analysis Page
Understanding booking patterns helps property managers forecast demand and improve policies.
Charts on this page include:
• Total Bookings vs Cancelled Bookings by Cancellation Policy
• Total Booking by Payment Method
• Gross Booking Amount by Booking Status
• Cancelled vs Completed Booking by Property Type
This analysis helps hosts reduce cancellations and improve booking strategies.
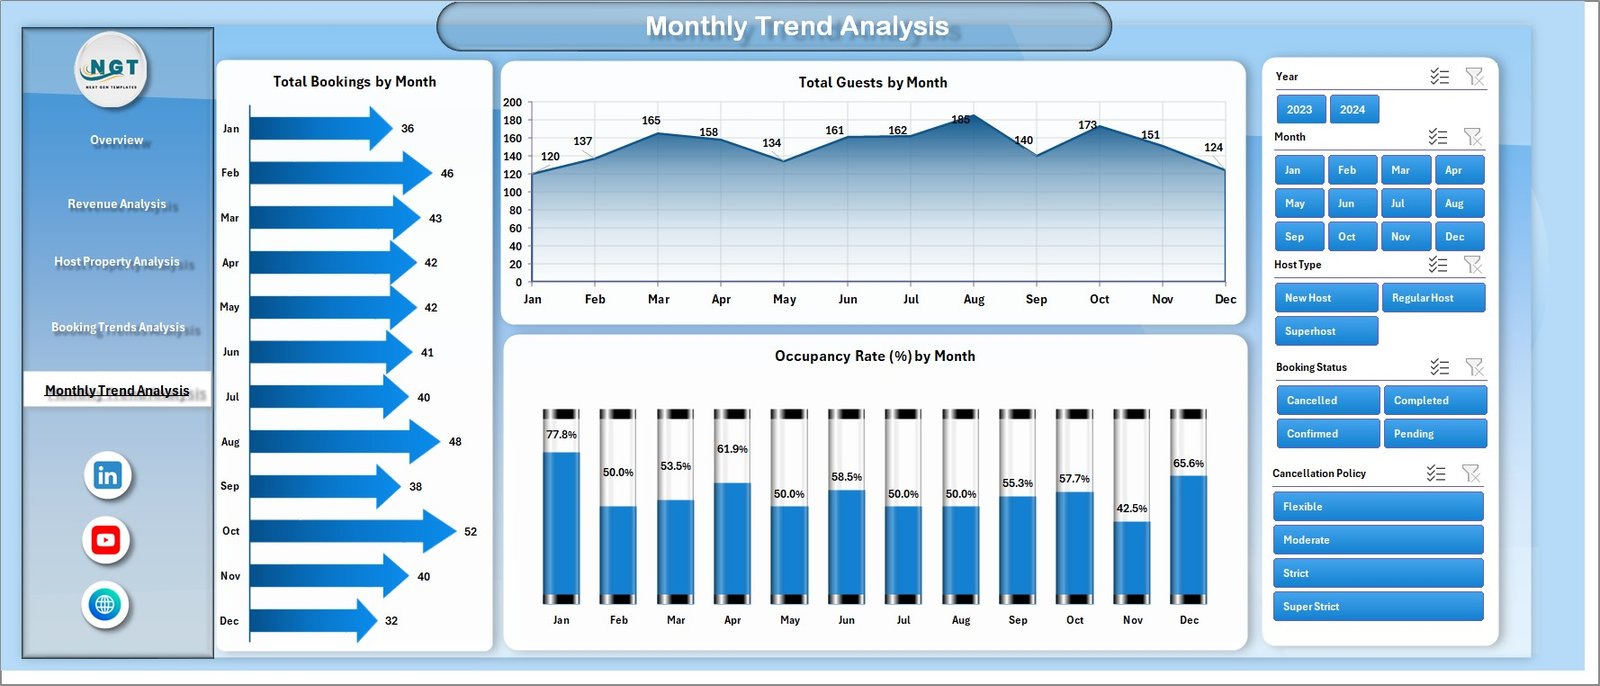
📅 Month Analysis Page
Short-term rental demand often fluctuates throughout the year.
This page focuses on seasonal performance trends using charts such as:
• Total Bookings by Month
• Total Guests by Month
• Occupancy Rate % by Month
These insights help hosts adjust pricing strategies and plan for high-demand seasons.
⚙️ How to Use the Airbnb-style Rentals Dashboard in Excel
Using the dashboard is simple and requires only basic Excel knowledge.
1️⃣ Enter booking data in the Data Sheet, including property details, city, guest count, booking status, and revenue.
2️⃣ Ensure data follows the structured format used by pivot tables.
3️⃣ Refresh pivot tables to update charts and KPI indicators.
4️⃣ Use slicers to filter rental data by city, host type, or booking status.
5️⃣ Explore insights across different dashboard pages.
With just a few steps, property managers can convert raw booking data into powerful rental analytics.
👨💼 Who Can Benefit from This Airbnb-style Rentals Dashboard in Excel
This dashboard is ideal for professionals managing short-term rental properties.
🏠 Airbnb Hosts – Track booking performance and revenue trends.
🏢 Property Managers – Analyze rental portfolios across multiple cities.
📊 Rental Agencies – Monitor property and host performance.
📈 Hospitality Analysts – Study booking patterns and market demand.
💼 Vacation Rental Businesses – Evaluate operational performance and revenue growth.
🎓 Students & Data Analysts – Learn short-term rental analytics and Excel dashboards.
Organizations using this dashboard gain better performance visibility, improved revenue monitoring, and smarter decision-making capabilities.
Click hare to read the Detailed blog post
Visit our YouTube channel to learn step-by-step video tutorials
https://youtube.com/@PKAnExcelExpert