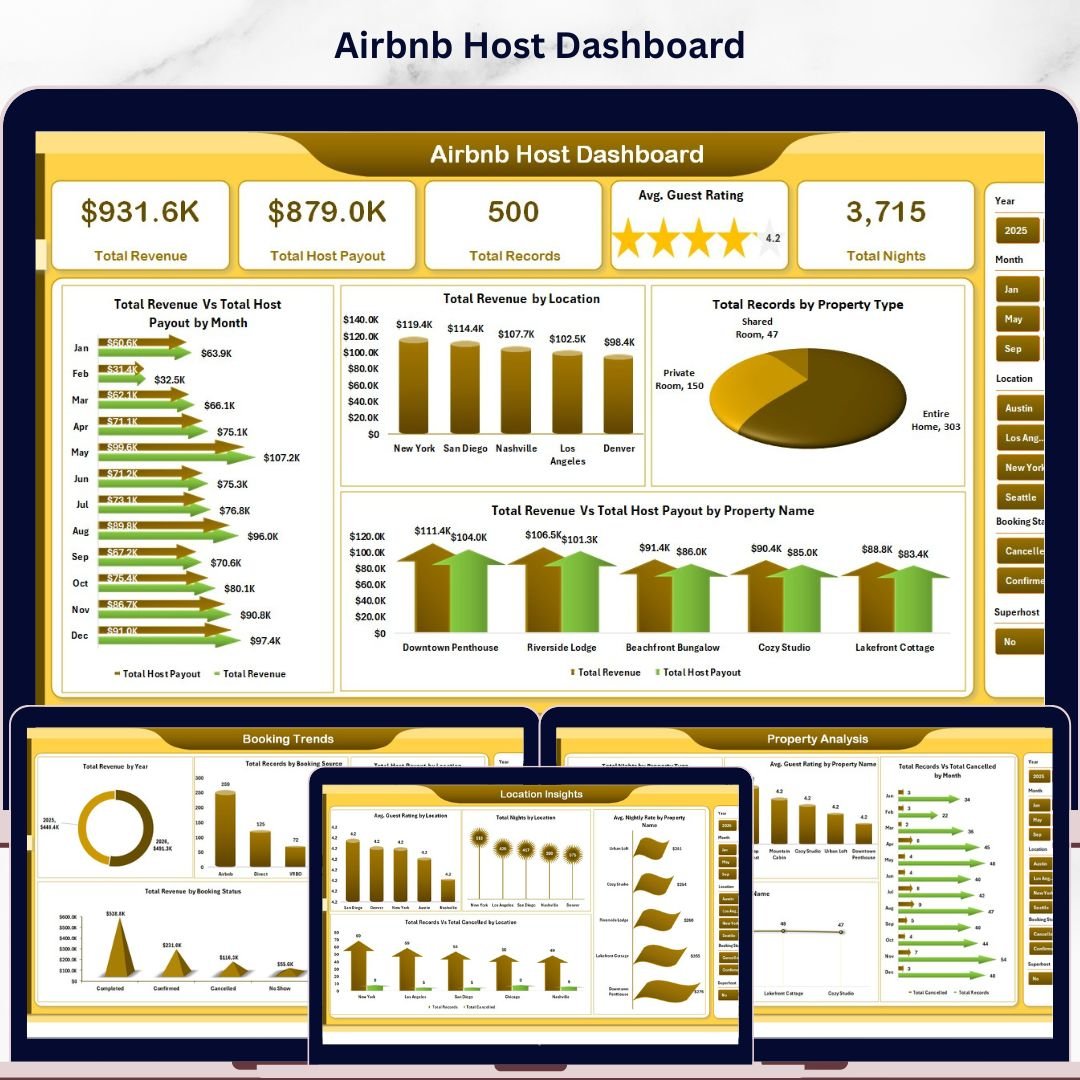
Airbnb Host Dashboard in Excel is a powerful ready-to-use analytical tool designed specifically for Airbnb hosts and property managers who want to monitor their rental business performance using interactive charts, KPI cards, and dynamic slicers. Whether you manage a single property or multiple listings across various locations, this dashboard transforms your raw booking and revenue data into clear, actionable visual insights that help you make smarter hosting decisions.
Managing an Airbnb hosting business involves tracking dozens of metrics including total revenue, host payouts, guest ratings, booking trends, cancellation rates, and property-level performance. Without a centralized analytics tool, hosts often struggle to understand which properties generate the most revenue, which locations perform best, and how booking trends change over time. The Airbnb Host Dashboard in Excel solves this challenge by consolidating all your hosting data into one interactive reporting system.
This dashboard includes 5 interactive analytical pages covering Overview, Property Analysis, Booking Trends, Location Insights, and Revenue Analysis. It also includes a structured Data Sheet for easy data entry and a Support Sheet containing pivot tables that power the entire dashboard dynamically. Simply update your data and click Refresh All to see every chart and KPI update automatically.
🔑 Key Features of Airbnb Host Dashboard in Excel
📊 Interactive Multi-Page Dashboard — Analyze Airbnb hosting performance across 5 dedicated analytical pages covering revenue, property metrics, booking sources, location insights, and more.
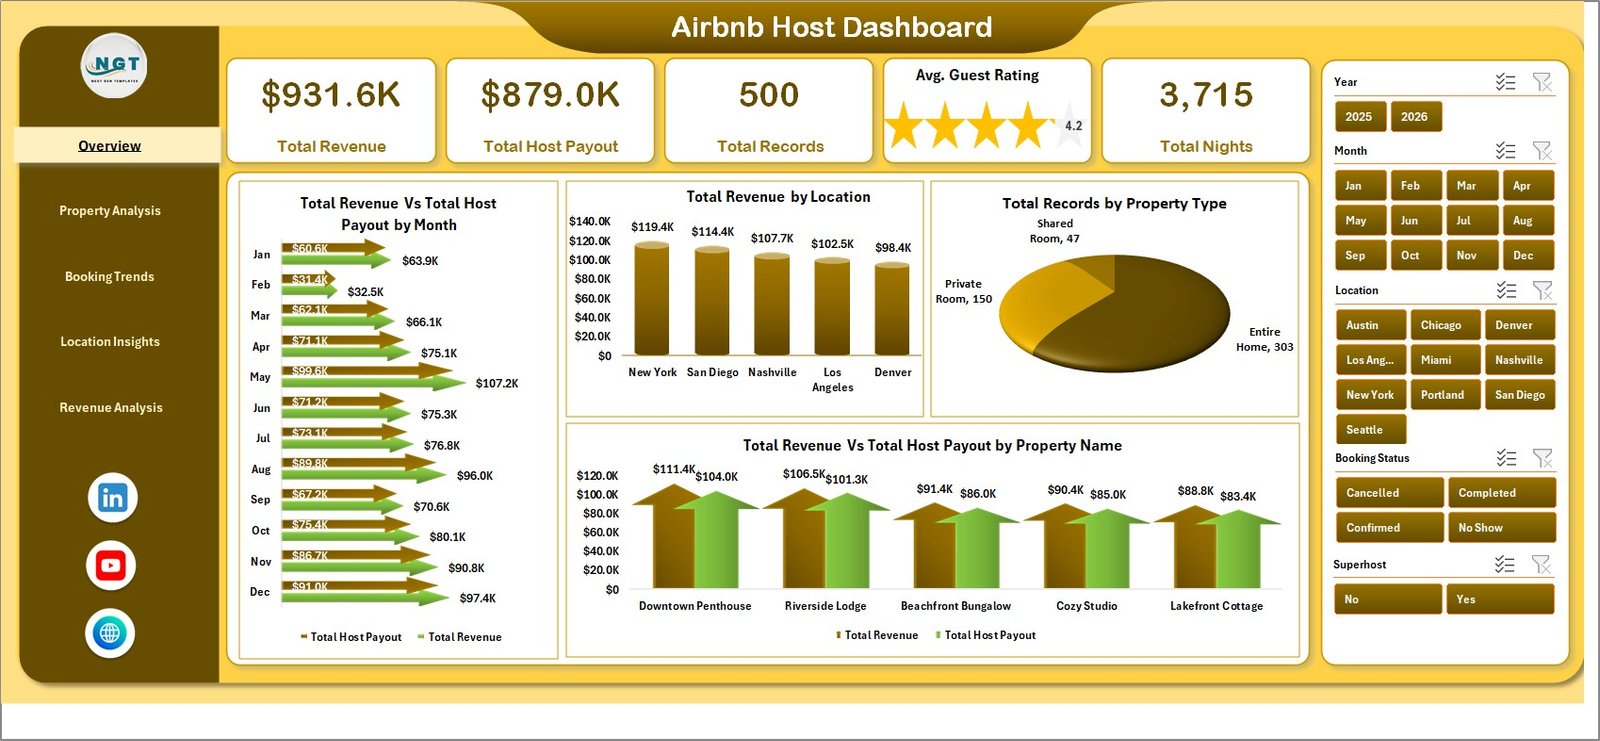
📈 Dynamic KPI Cards — Track Total Revenue, Total Host Payout, Total Records, Avg. Guest Rating, and Total Nights at a glance on the Overview page.
🎛 Interactive Slicers and Filters — Filter dashboard data instantly by property type, location, booking source, month, year, and superhost status to analyze specific segments of your Airbnb business.
🏠 Property-Level Analysis — Identify top-performing properties by revenue and guest ratings, monitor cancellation rates, and compare property type performance.
📍 Location-Based Insights — Compare Avg. Guest Rating, Total Nights, Nightly Rates, and cancellation trends across all your Airbnb locations.
💰 Revenue Breakdown — Analyze revenue by superhost status, service fees by booking source, and booking distribution by instant book availability.
🔄 Auto-Refreshing Pivot Charts — All charts are powered by pivot tables in the Support Sheet. Simply refresh data and every visualization updates automatically.
📋 Structured Data Sheet — Enter your Airbnb booking data in a clean, organized format that feeds all dashboard calculations and charts.
📦 What’s Inside the Airbnb Host Dashboard in Excel
The dashboard contains 5 analytical pages, a Data Sheet, and a Support Sheet — 7 sheets total.
🏠 Overview Page — Main Airbnb Analytics Dashboard
 Airbnb Host Dashboard
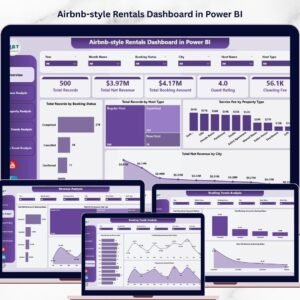
The Overview Page provides a high-level snapshot of your entire Airbnb hosting business. It displays 5 KPI cards: Total Revenue, Total Host Payout, Total Records, Avg. Guest Rating, and Total Nights. The page also includes interactive charts showing Total Revenue Vs Total Host Payout by Month, Total Revenue by Location, Total Records by Property Type, and Total Revenue Vs Total Host Payout by Property Name. Multiple slicers allow you to filter the entire dashboard instantly.
📊 Property Analysis Page
 Property Analysis
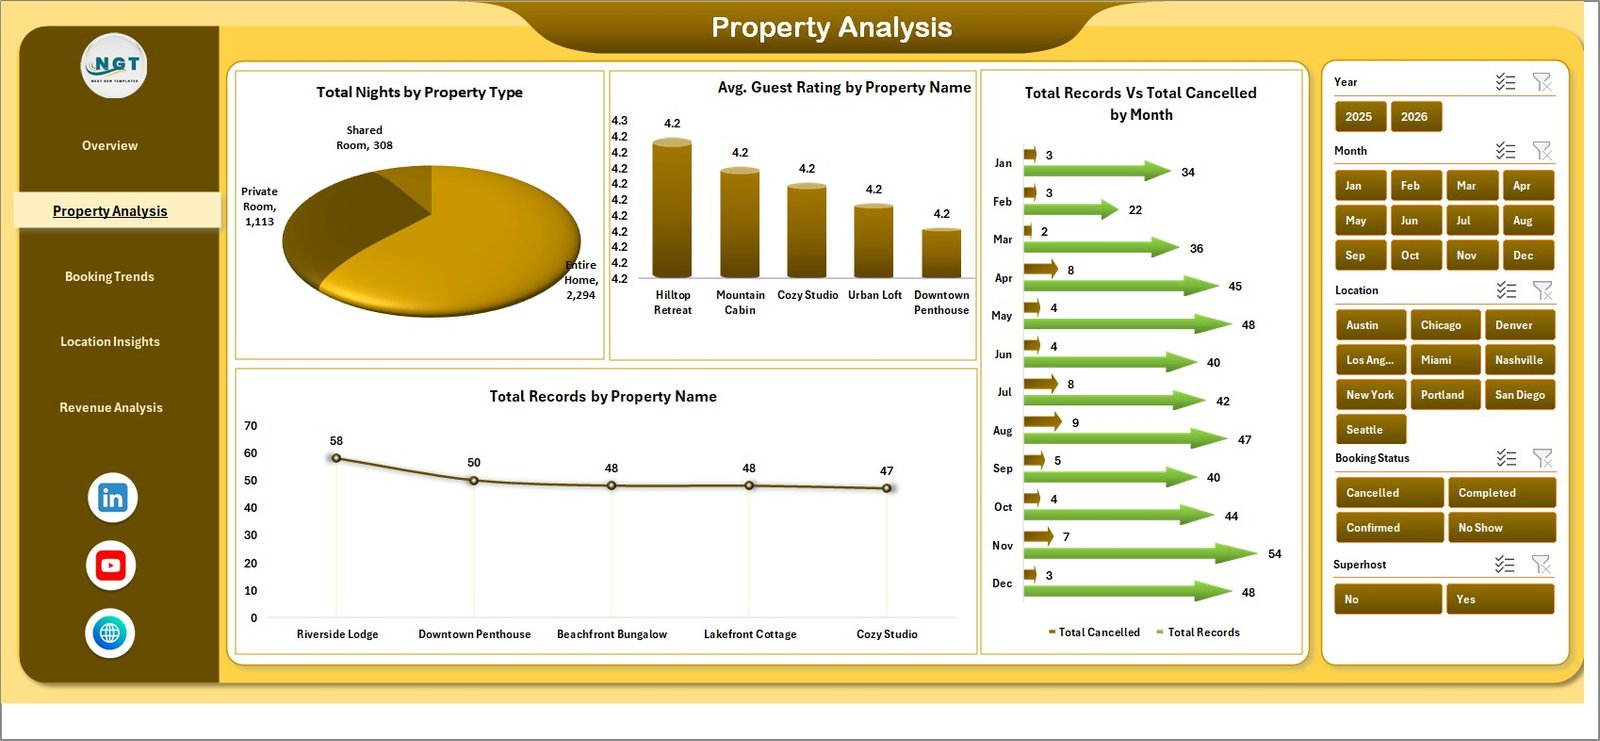
This page focuses on property-level performance with charts analyzing Total Nights by Property Type, Avg. Guest Rating by Property Name, Total Records Vs Total Cancelled by Month, and Total Records by Property Name.
📈 Booking Trends Page
 Booking Trends
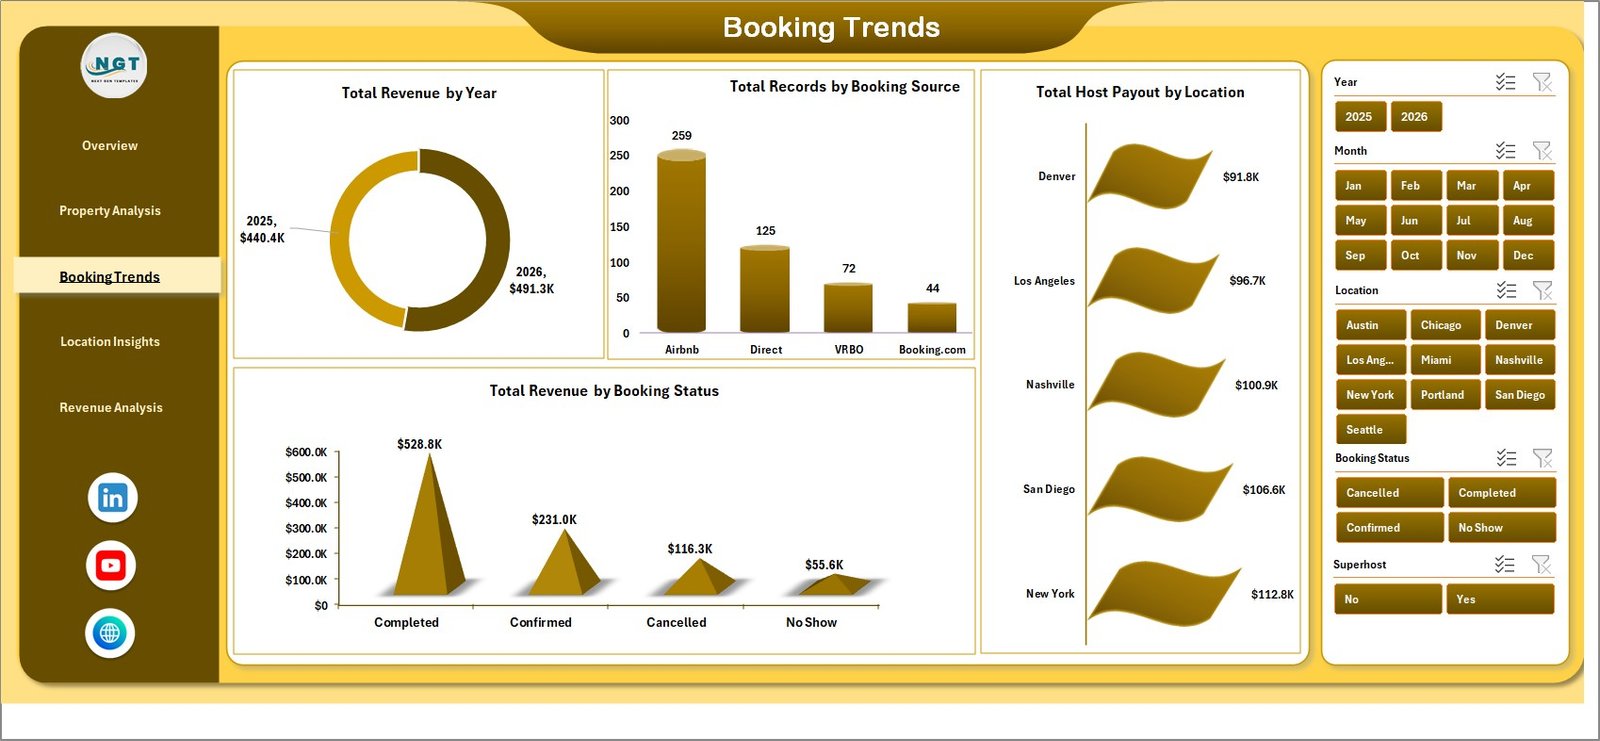
The Booking Trends page analyzes Total Revenue by Year, Total Records by Booking Source, Total Host Payout by Location, and Total Revenue by Booking Status.
📍 Location Insights Page
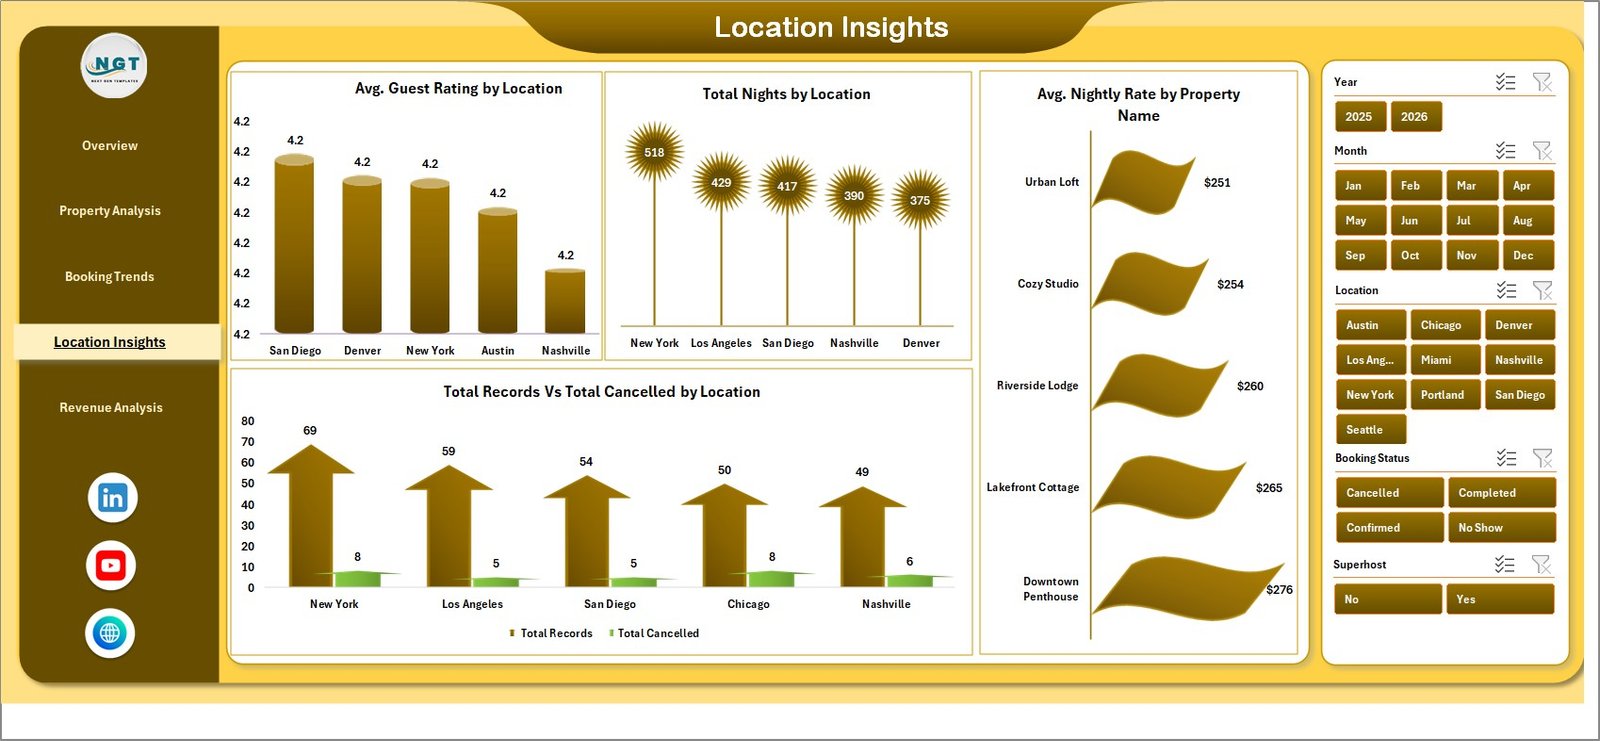 Location Insights
This page provides location-specific analytics including Avg. Guest Rating by Location, Total Nights by Location, Avg. Nightly Rate by Property Name, and Total Records Vs Total Cancelled by Location.
💰 Revenue Analysis Page
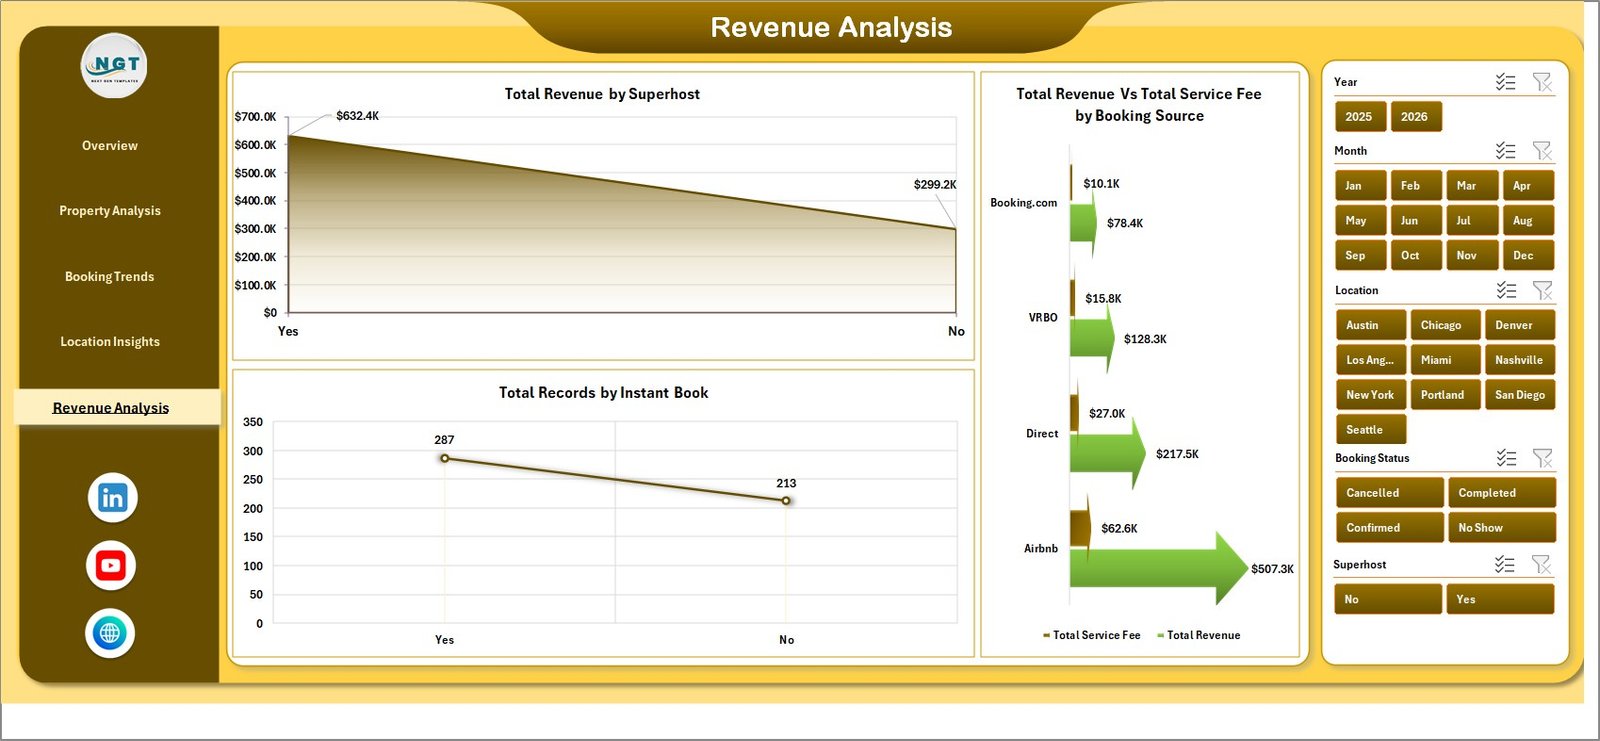 Revenue Analysis
The Revenue Analysis page breaks down financial performance with charts showing Total Revenue by Superhost, Total Revenue Vs Total Service Fee by Booking Source, and Total Records by Instant Book.
📋 Data Sheet
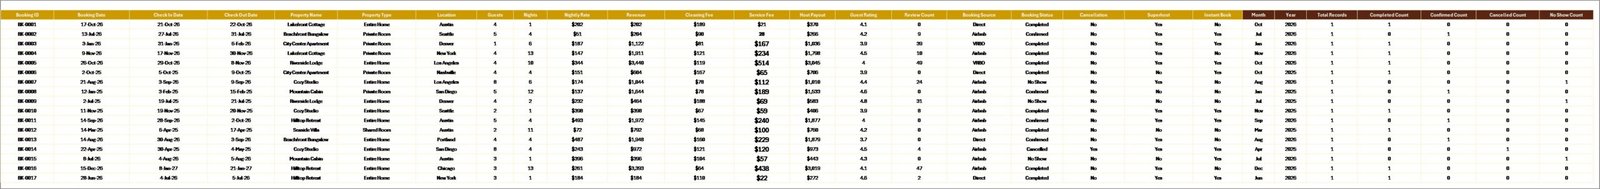 Data Sheet Tab
The Data Sheet is where you enter your Airbnb booking records. Simply add your data in the same structured format and all dashboard pages will update after refreshing pivot tables.
⚙️ Support Sheet
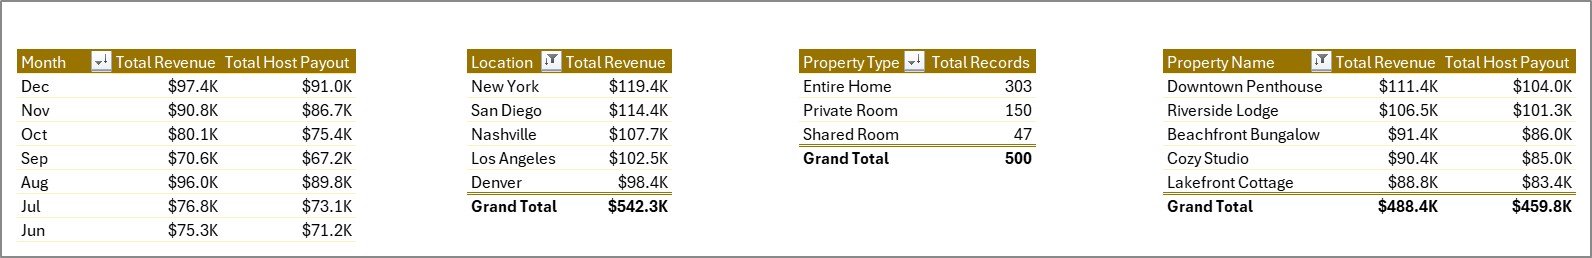 Support Sheet Tab
The Support Sheet contains multiple pivot tables that power the entire dashboard dynamically. Go to the Data tab in the Excel Ribbon and click Refresh All after updating data.
⚙️ How to Use the Airbnb Host Dashboard in Excel
1️⃣ Open the Excel file and navigate to the Data Sheet.
2️⃣ Replace the sample data with your own Airbnb booking records in the same format.
3️⃣ Go to the Data tab in the Excel Ribbon and click Refresh All.
4️⃣ Use slicers on each dashboard page to filter data by property type, location, or time period.
5️⃣ Explore all 5 analytical pages to gain complete insights into your Airbnb hosting business.
👥 Who Can Benefit from This Airbnb Host Dashboard in Excel
🏠 Airbnb Hosts — Track revenue, guest ratings, and property performance across all listings.
🏢 Property Managers — Monitor multi-property portfolios and identify top performers.
📊 Rental Business Analysts — Study booking trends, cancellation patterns, and revenue distribution.
💼 Vacation Rental Owners — Optimize nightly rates and superhost strategies based on data.
📈 Hospitality Consultants — Deliver professional hosting analytics reports to clients.
🎓 Students and Data Enthusiasts — Learn Excel dashboard building with a real-world Airbnb dataset.
❓ Frequently Asked Questions
What KPIs does the Airbnb Host Dashboard in Excel track?
The Airbnb Host Dashboard in Excel tracks 5 key performance indicators including Total Revenue, Total Host Payout, Total Records, Average Guest Rating, and Total Nights. These KPIs provide a complete snapshot of your Airbnb hosting business performance.
Do I need advanced Excel skills to use this dashboard?
No. Simply replace the sample data in the Data Sheet with your own Airbnb records and click Refresh All in the Data tab. All charts and KPI cards update automatically without any manual formula work.
Can I track multiple Airbnb properties with this dashboard?
Yes. The dashboard is designed to analyze multiple properties across different locations. Use the built-in slicers to filter by property name, property type, or location to compare performance across your entire portfolio.
How is this different from the Airbnb-style Rentals Dashboard?
The Airbnb Host Dashboard focuses specifically on host-centric metrics like host payouts, superhost performance, and nightly rate analysis. The Airbnb-style Rentals Dashboard in Excel focuses more on booking and occupancy analytics for rental portfolio managers.
What data format do I need to enter in the Data Sheet?
The Data Sheet includes sample records showing the exact column format needed. Your data should include fields like property name, property type, location, booking source, revenue, host payout, guest rating, nights, booking status, and dates.
Can I use this dashboard for Vrbo or other rental platforms?
Absolutely. While the dashboard is designed with Airbnb hosting terminology, the data structure works perfectly for any short-term rental platform including Vrbo, Booking.com, and similar services.
🔗 Explore Related Templates
🏠 Airbnb-style Rentals Dashboard in Excel — Comprehensive booking and occupancy analytics for rental portfolios.
📊 Airbnb-style Rentals Dashboard in Power BI — Advanced Power BI version with dynamic visuals and DAX-powered calculations.
📈 Vacation Rentals KPI Dashboard in Power BI — KPI scorecard with MTD, YTD, Target vs Actual tracking for rental businesses.
Browse our complete collection of Excel Dashboard Templates and Hospitality & Tourism Templates.
📖 Click here to read the Detailed Blog Post
🎥 Visit our YouTube channel to learn step-by-step video tutorials
👉 YouTube.com/@NextGenTemplates


Reviews
There are no reviews yet.