
Agriculture today is no longer driven only by experience and intuition. Rising input costs, changing weather patterns, and tight profit margins demand accurate data, fast insights, and better planning. That is exactly where the Agriculture Dashboard in Excel becomes a game-changing digital product for farmers and agribusiness professionals.
This ready-to-use Excel dashboard transforms raw agricultural data into clear, visual, and actionable insights. Instead of managing scattered spreadsheets for crops, soil types, regions, fertilizers, seasons, and costs, you get one centralized dashboard that tells you what is working, what is not, and where profits can be improved.
Designed using pivot tables, pivot charts, and slicers, this dashboard allows you to analyze production, yield, costs, and revenue dynamically—without any complex software or technical skills. Whether you manage a small farm or a large agribusiness, this dashboard helps you take faster and smarter decisions with confidence.
🚀 Key Features of the Agriculture Dashboard in Excel
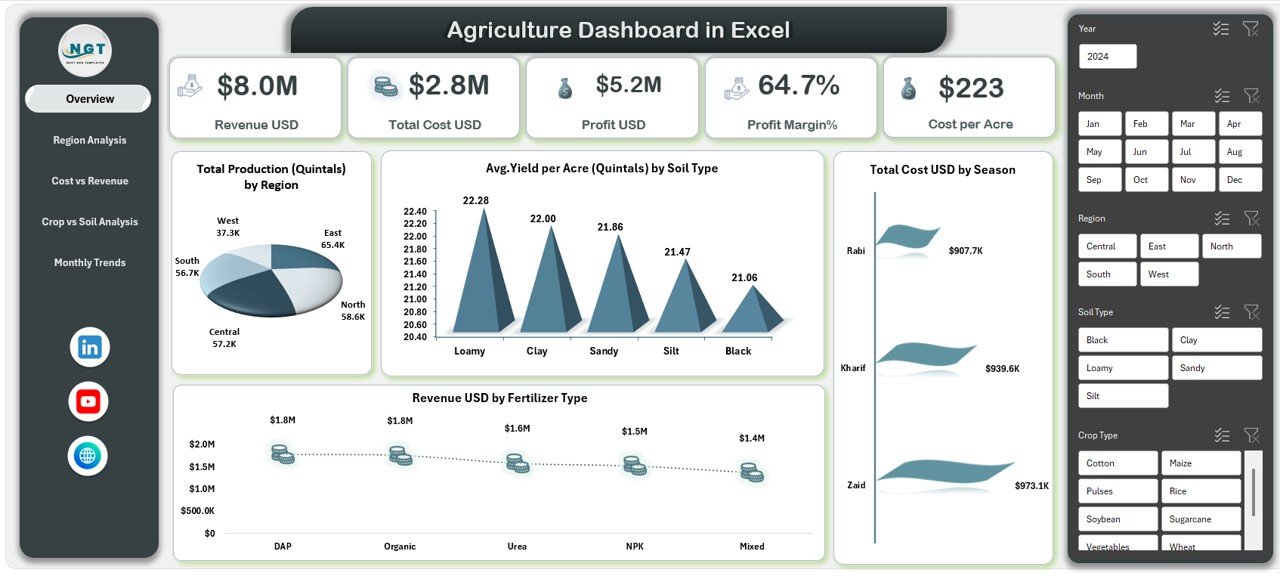
🌱 Interactive KPI Cards to track Revenue, Total Cost, Profit, Profit Margin, and Cost per Acre
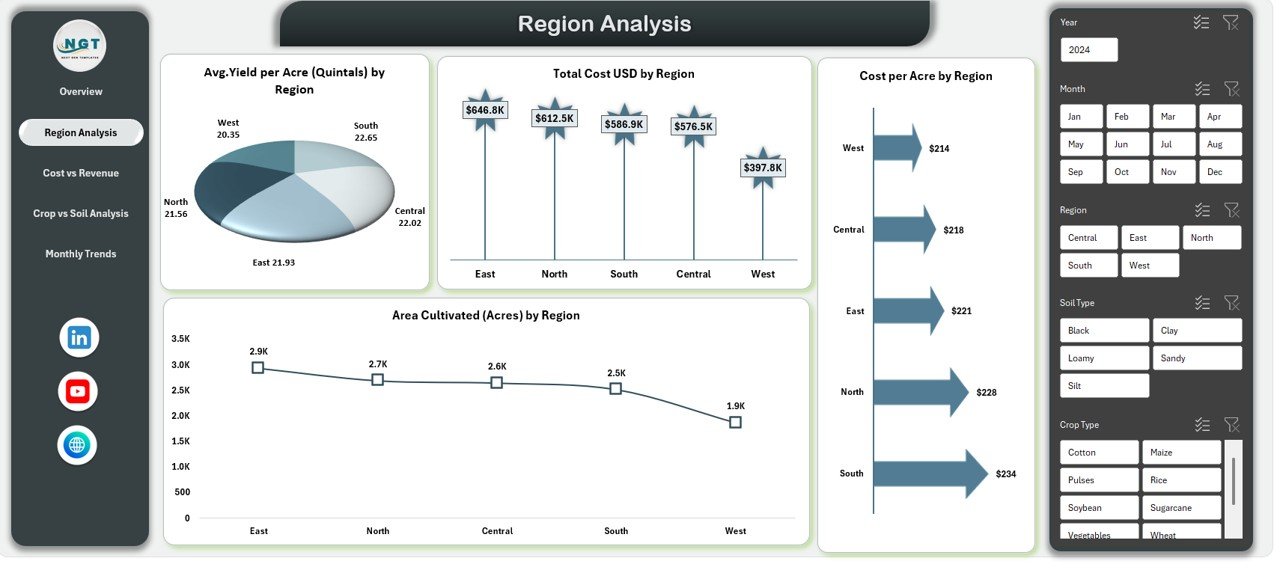
📊 Region-wise Performance Analysis to compare yield, cost, and cultivated area
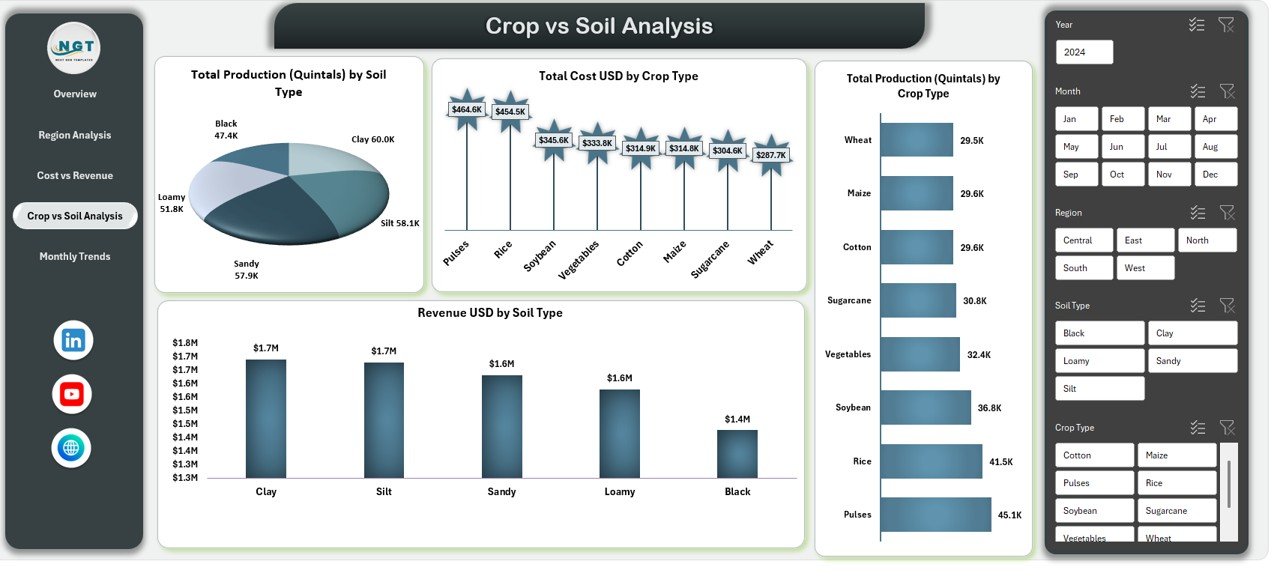
🌾 Crop & Soil Insights to identify the best-performing combinations
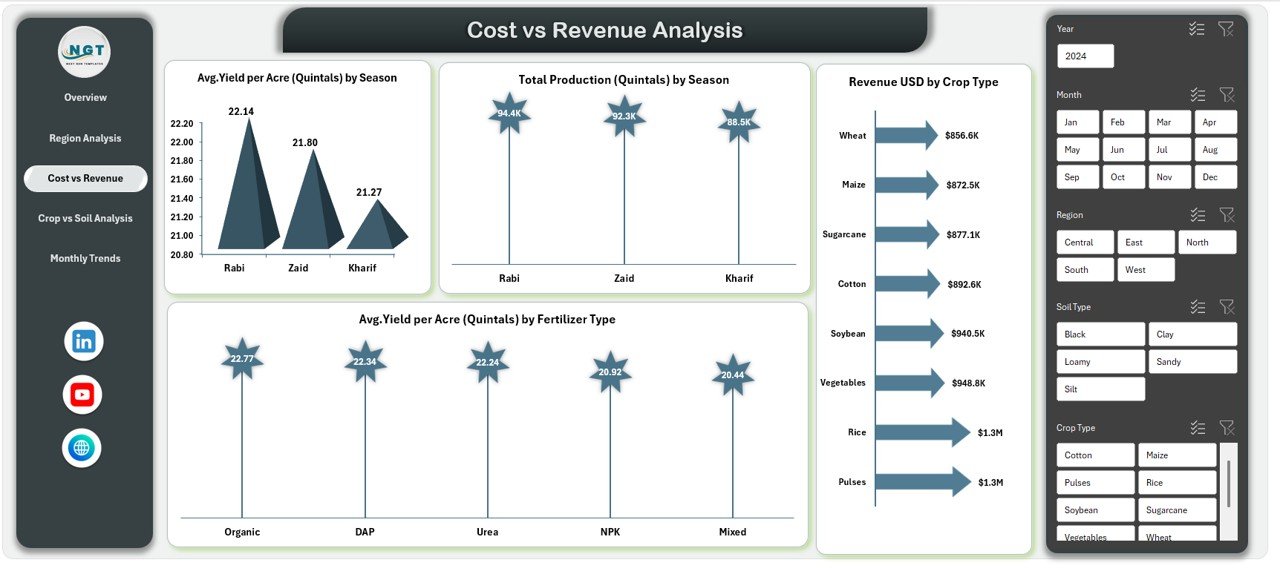
💰 Cost vs Revenue Analysis to understand profitability drivers
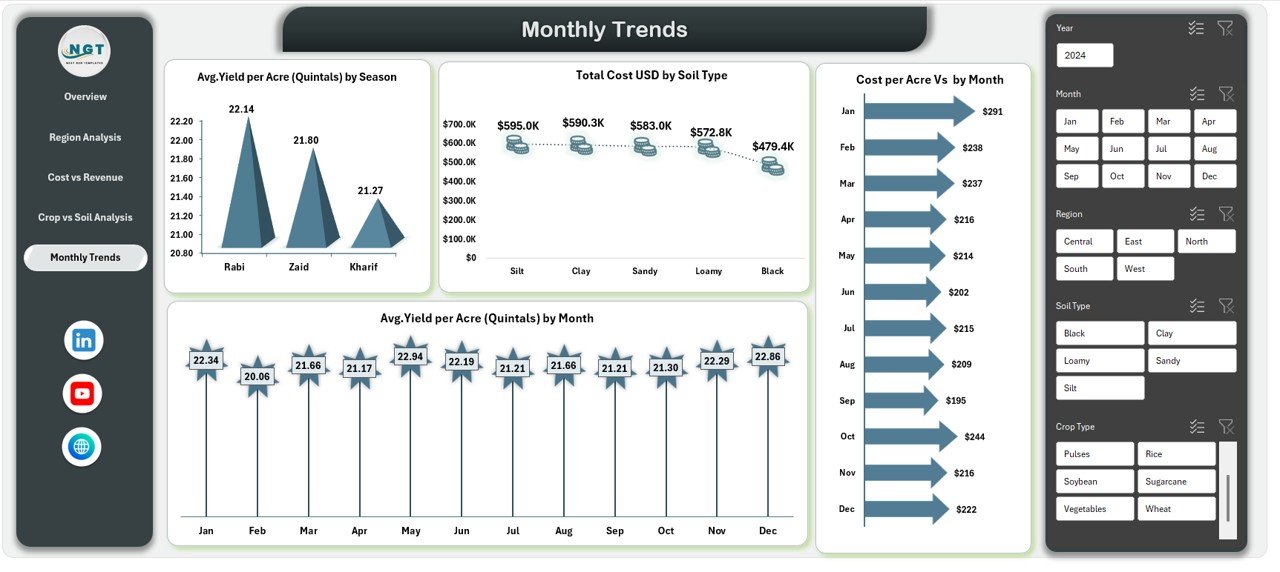
📅 Seasonal & Monthly Trends to plan farming cycles effectively
🎯 Dynamic Slicers for instant filtering by region, crop, soil type, fertilizer, and season
📈 Pivot-Based Design for fast refresh and flexible analysis
🧠 Business-Ready Layout suitable for reporting, planning, and presentations
📦 What’s Inside the Agriculture Dashboard in Excel
This digital product includes multiple analytical sheets, each built for a specific purpose:
📌 Overview Dashboard – High-level summary with KPIs and key charts
📌 Region Analysis Sheet – Yield, cost, cultivated area, and efficiency by region
📌 Cost vs Revenue Analysis Sheet – Understand returns by season, crop, and fertilizer
📌 Crop vs Soil Analysis Sheet – Identify optimal crop-soil combinations
📌 Monthly Trends Sheet – Track yield and cost changes over time
Each sheet works together to provide a complete 360-degree view of agricultural performance.
⚙️ How to Use the Agriculture Dashboard in Excel
Using this dashboard is simple and practical:
1️⃣ Enter or paste your agricultural data into the structured data sheet
2️⃣ Refresh the pivot tables with one click
3️⃣ Use slicers to filter by crop, region, soil type, season, or month
4️⃣ Review KPIs, charts, and trends instantly
5️⃣ Use insights to optimize costs, improve yield, and increase profitability
No macros. No coding. Just pure Excel intelligence.
👥 Who Can Benefit from This Agriculture Dashboard
👨🌾 Individual Farmers – Track yield, costs, and profits easily
🏭 Farm Managers – Monitor performance across regions and seasons
📊 Agricultural Consultants – Deliver professional insights to clients
🏢 Agribusiness Owners – Improve cost control and strategic planning
🤝 Cooperative Societies – Compare member farm performance
🎓 Students & Researchers – Learn practical agricultural analytics
If you use Excel and work with agricultural data, this dashboard is built for you.
Click here to read the Detailed Blog Post
Watch the step-by-step video tutorial:
Visit our YouTube channel to learn step-by-step video tutorials:
YouTube.com/@PKAnExcelExpert


Reviews
There are no reviews yet.