Managing agricultural machinery without clear performance tracking is risky and expensive. Tractors, harvesters, planters, and sprayers represent heavy investments, yet many farms and agribusinesses still rely on scattered logs, notebooks, or unstructured Excel files. As a result, downtime increases, maintenance costs rise, and productivity suffers.
The Agricultural Machinery KPI Dashboard in Excel solves this problem by giving you complete visibility and control over machinery performance in one centralized dashboard 📊.
This ready-to-use Excel solution converts raw equipment data into clear KPIs, smart comparisons, and trend-based insights, helping you reduce breakdowns, plan maintenance better, and maximize machine utilization.
Built entirely in Excel, this dashboard requires no complex BI tools, making it practical, scalable, and easy to adopt for farms, agribusiness companies, and machinery managers.
🔑 Key Features of Agricultural Machinery KPI Dashboard in Excel
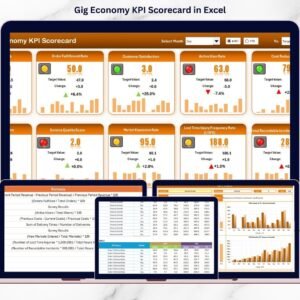
📊 Centralized Machinery KPI Tracking
Monitor utilization, maintenance efficiency, productivity, and performance KPIs in one dashboard.
📅 Dynamic Month Selection
Select any month from a drop-down and instantly view updated MTD and YTD performance.
🎯 Target vs Actual Comparison
Identify performance gaps clearly using automated percentages and indicators.
📈 MTD & YTD Performance Monitoring
Track short-term results while keeping long-term machinery efficiency in focus.
🔁 Current Year vs Previous Year Analysis
Understand growth, decline, and seasonal usage patterns easily.
📉 KPI-Wise Trend Analysis
Analyze machinery trends using MTD and YTD charts for each KPI.
📘 LTB & UTB KPI Logic
Ensure correct evaluation with Lower-the-Better and Upper-the-Better KPI rules.
⚡ 100% Excel-Based & Business-Ready
Easy to maintain, easy to update, and ideal for daily operational use.
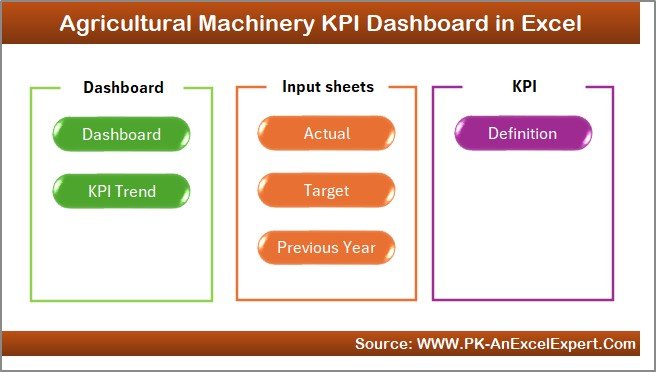
📂 What’s Inside the Agricultural Machinery KPI Dashboard in Excel
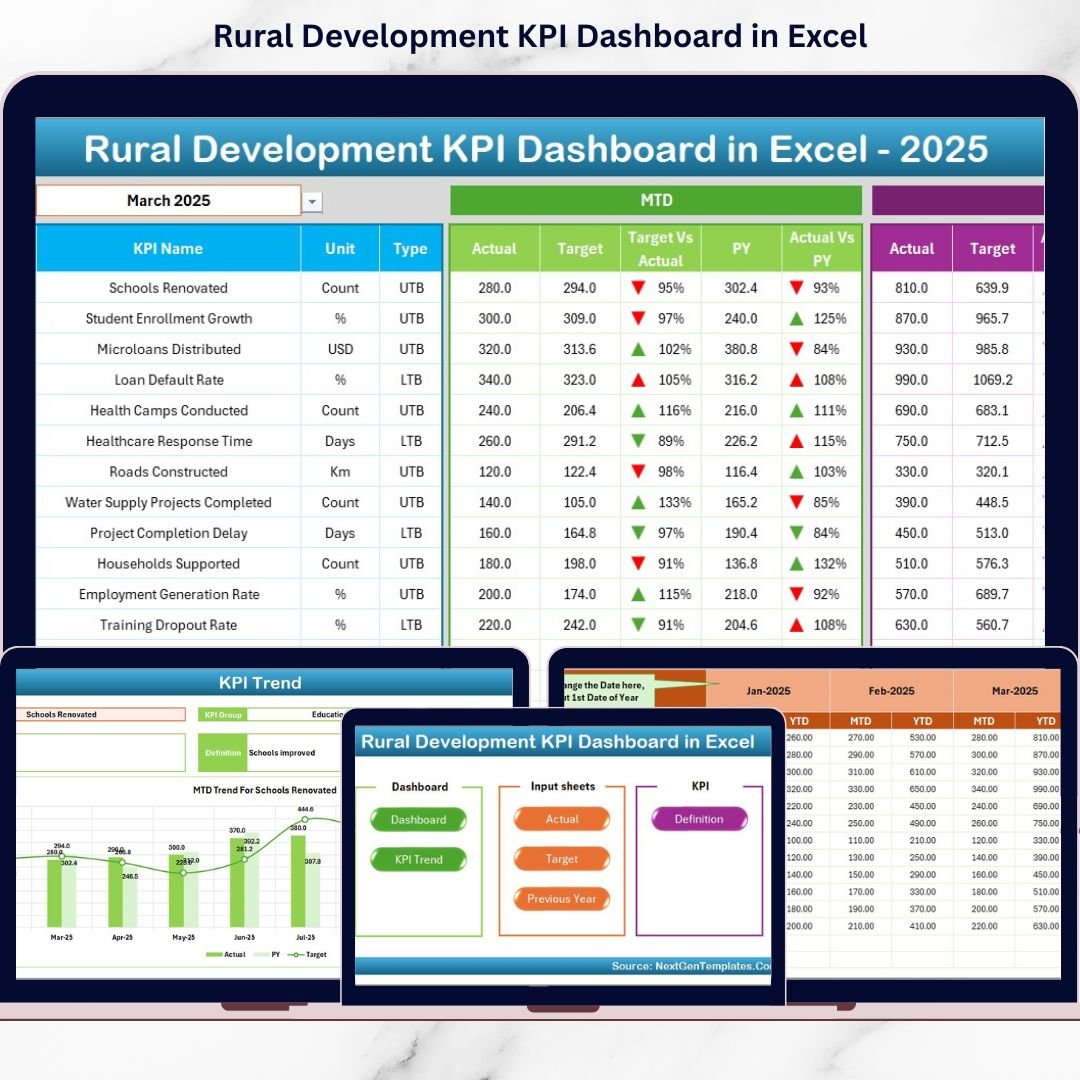
🏠 Home Sheet
An index page with navigation buttons for quick, one-click access to all worksheets.
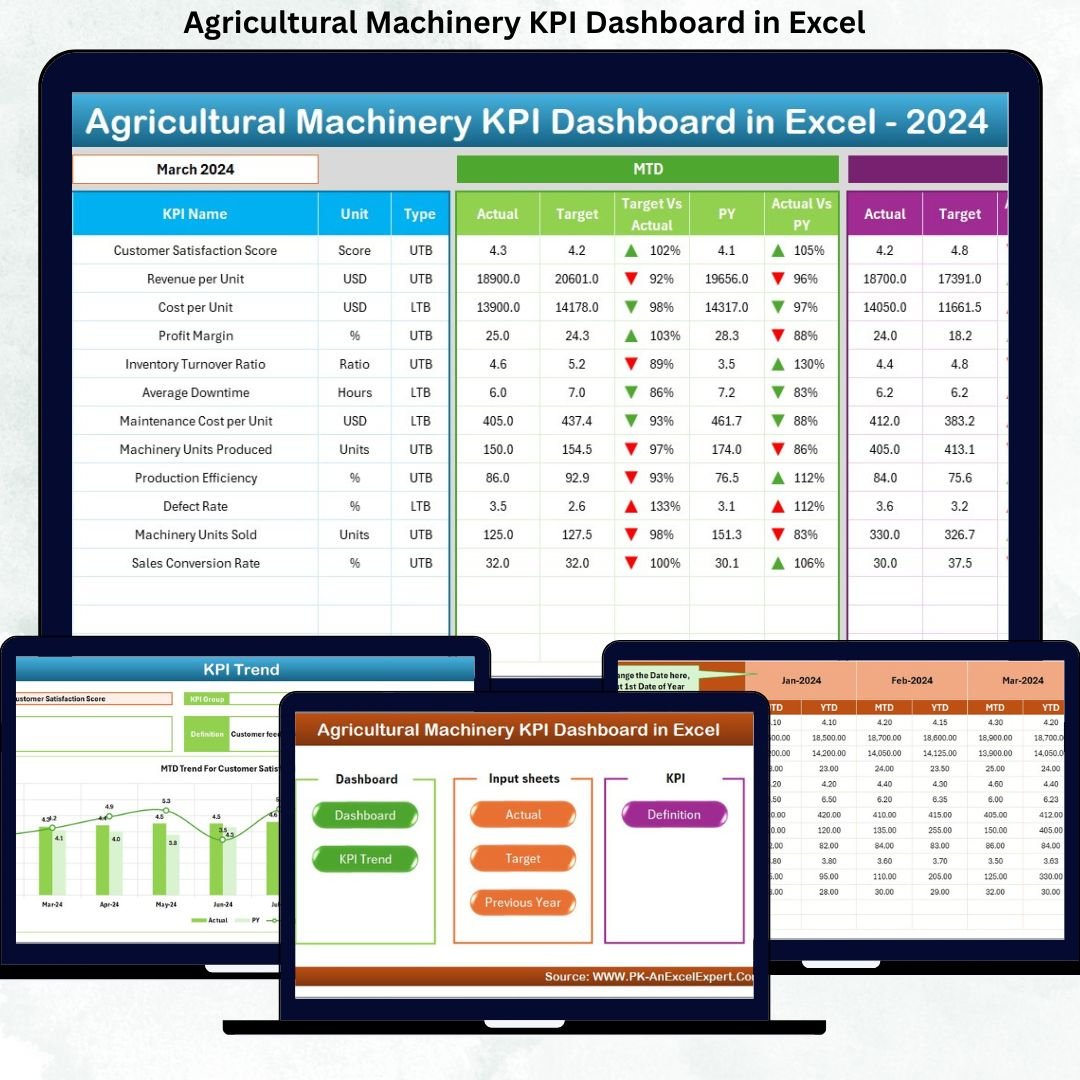
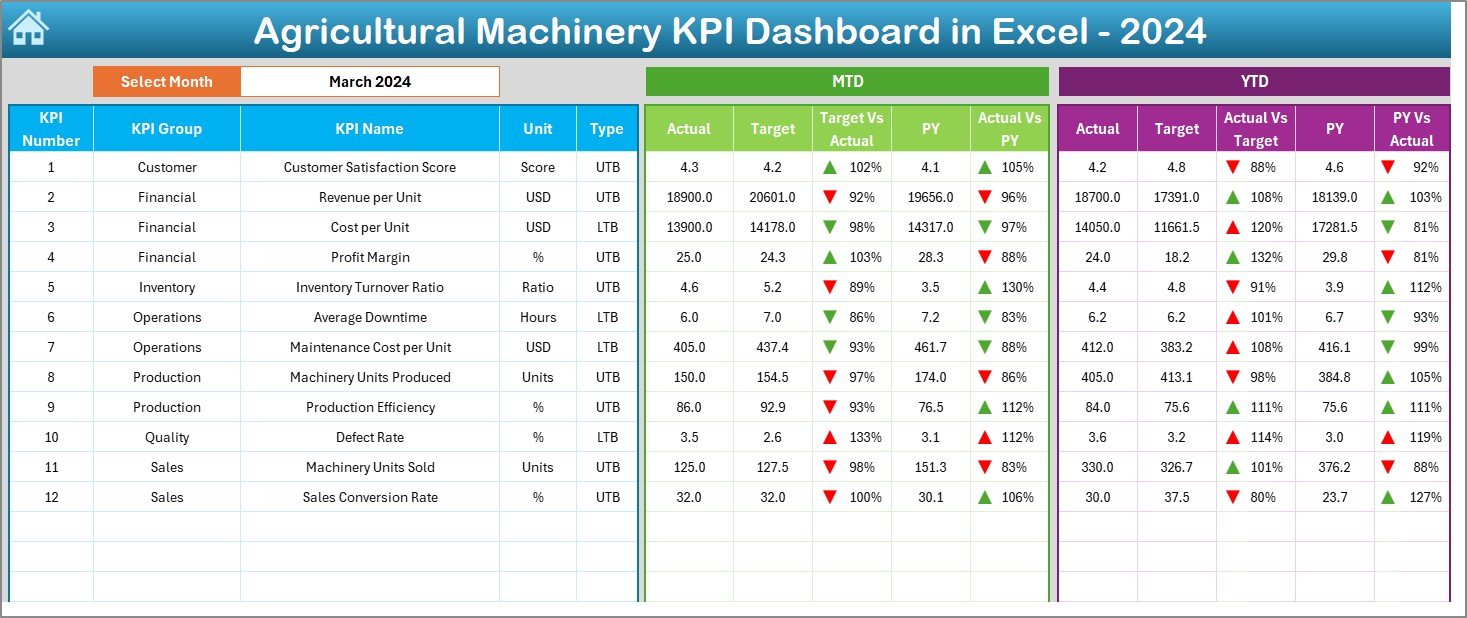
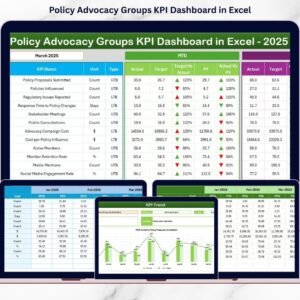
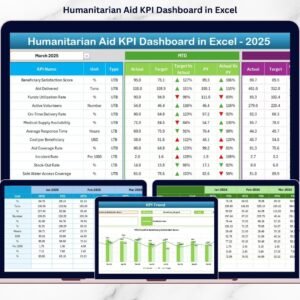
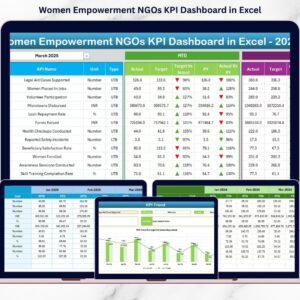
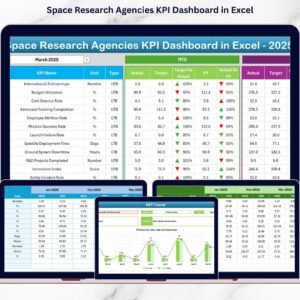
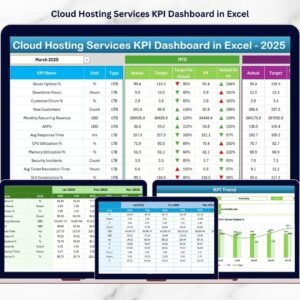
📊 Dashboard Sheet
The main performance page displaying MTD and YTD actuals, targets, previous year values, and variance indicators with arrows.
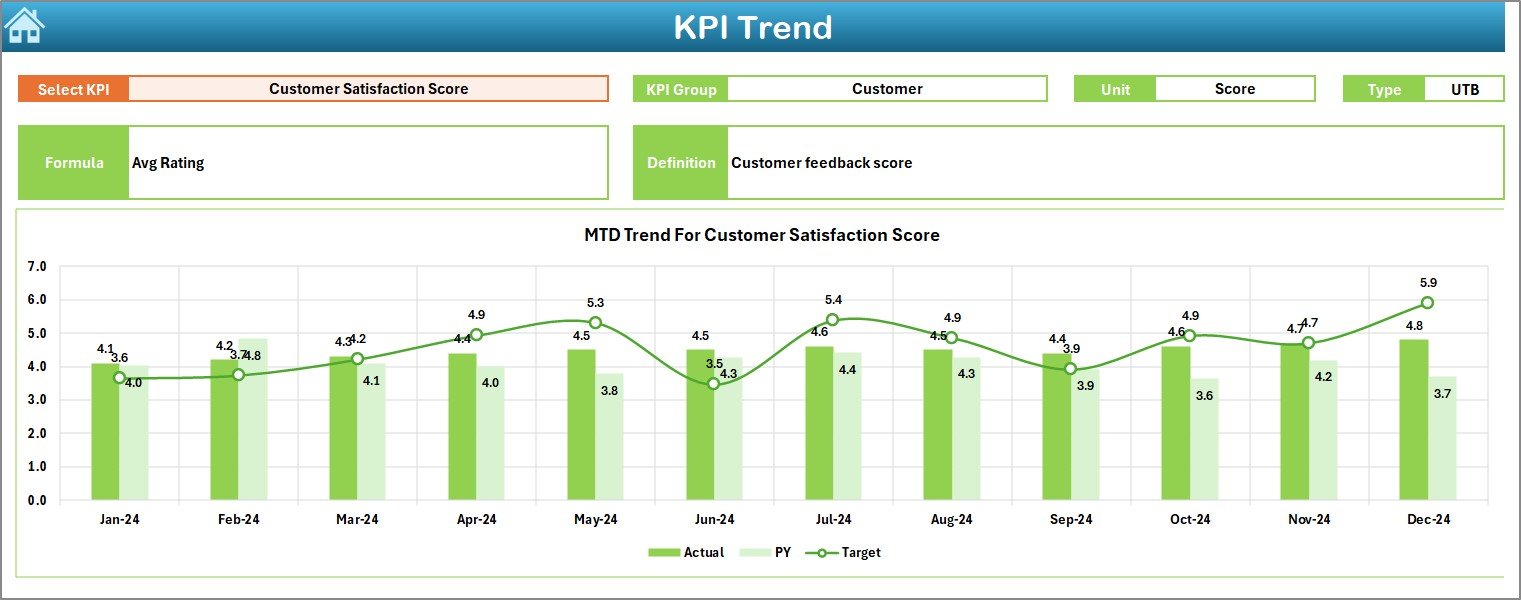
📈 KPI Trend Sheet
Select any KPI and instantly view its MTD and YTD trends along with KPI details.
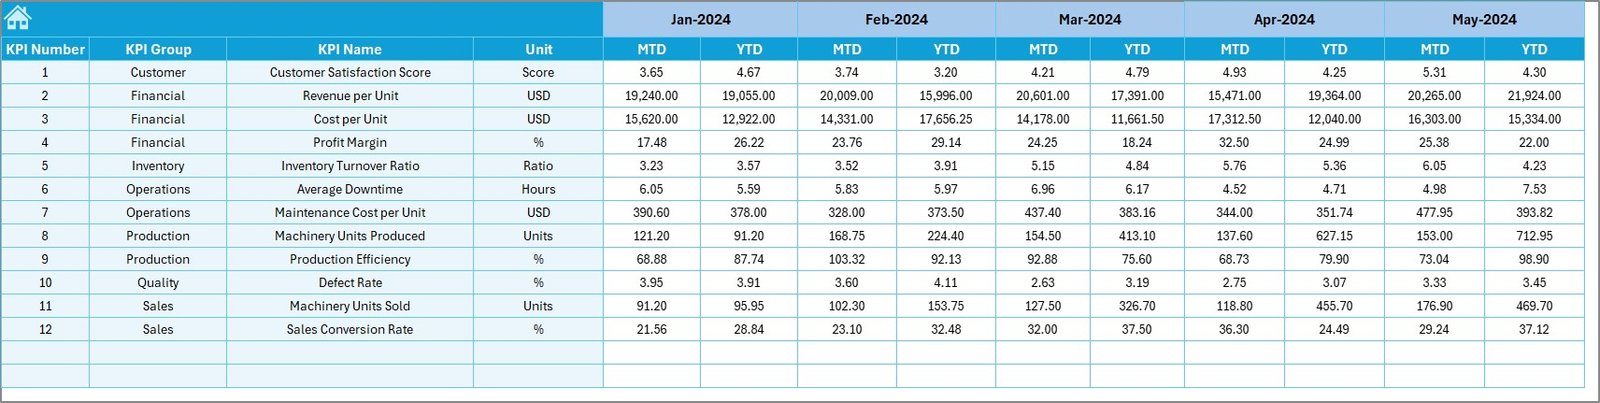
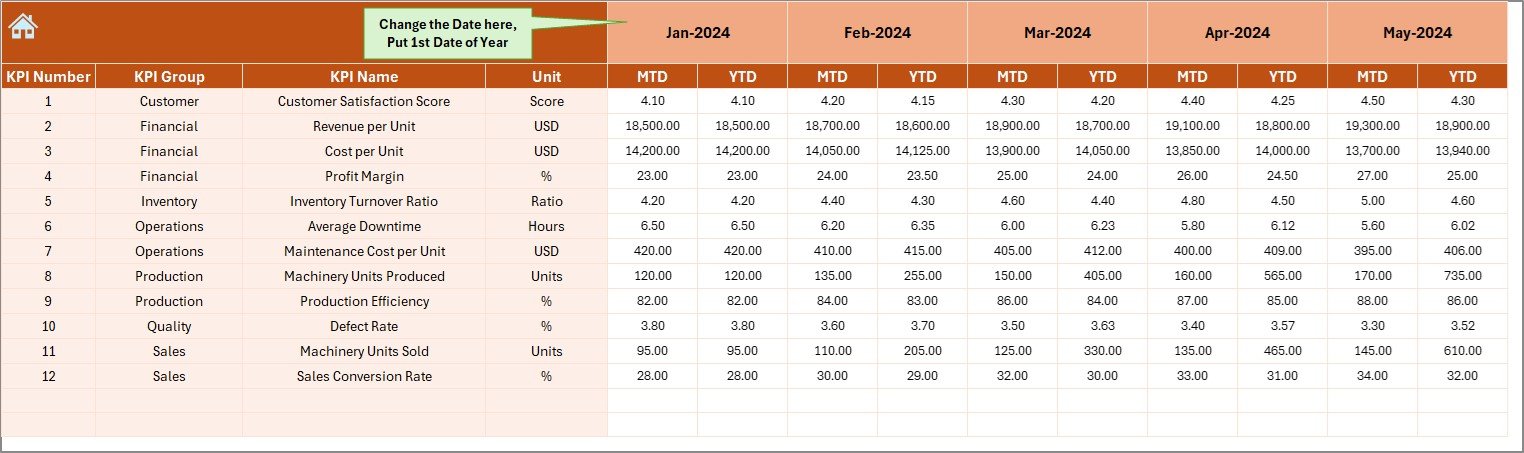
📥 Actual Numbers Input Sheet
Enter current-year machinery performance data in a clean, structured format.
🎯 Target Sheet
Define monthly and yearly performance goals for each machinery KPI.
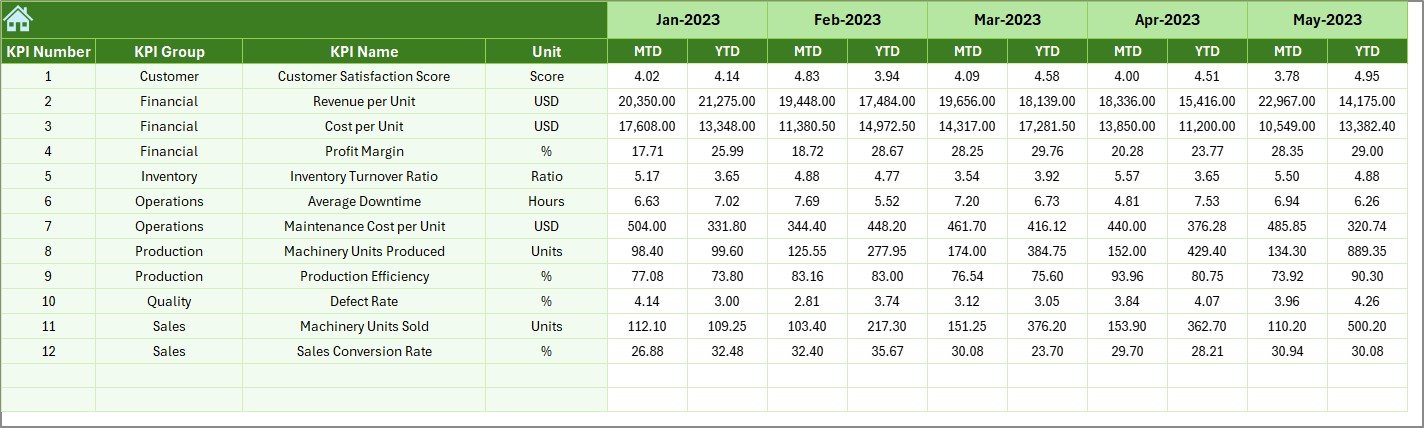
📅 Previous Year Number Sheet
Store last year’s data to enable accurate year-over-year comparison.
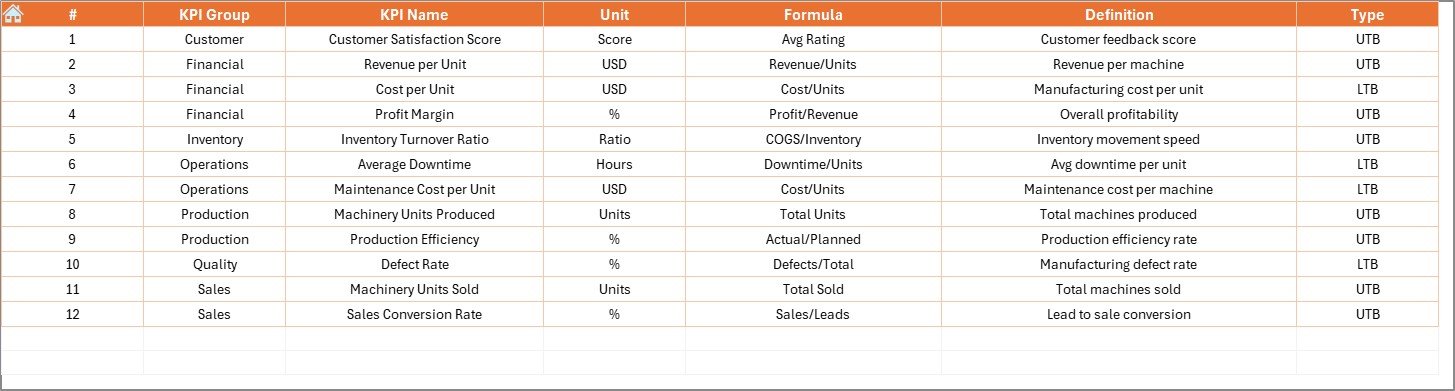
📘 KPI Definition Sheet
Maintain KPI group, unit, formula, definition, and LTB/UTB logic in one place.
⚙️ How to Use the Agricultural Machinery KPI Dashboard in Excel
📝 Step 1: Enter Data
Update actual values, targets, and previous year data in the respective sheets.
📅 Step 2: Select Month
Choose a month from cell D3 and view updated MTD and YTD results instantly.
📊 Step 3: Review KPI Performance
Use arrows, percentages, and comparisons to identify underperforming machines.
📈 Step 4: Analyze Trends
Study machinery usage, maintenance, and productivity trends over time.
🎯 Step 5: Take Action
Reduce downtime, improve maintenance planning, and increase equipment efficiency.
👥 Who Can Benefit from This Agricultural Machinery KPI Dashboard in Excel
🌾 Farm Owners – Improve machinery utilization and reduce operational losses
🚜 Machinery Managers – Track maintenance efficiency and breakdown trends
🏭 Agribusiness Companies – Monitor large-scale equipment performance
📊 Operations Teams – Plan maintenance and optimize resource allocation
📈 Decision-Makers & Owners – Make confident, data-driven investment decisions
🔍 Click here to read the Detailed blog post
📺 Visit our YouTube channel to learn step-by-step video tutorials
👉 Youtube.com/@PKAnExcelExpert


Reviews
There are no reviews yet.