The agriculture industry is rapidly evolving due to biotechnology innovations. Companies constantly invest in research and development to create high-yield crops, improve resistance to pests, and strengthen global food security. However, managing complex biotechnology data such as research investments, crop performance, regulatory approvals, and profitability metrics can quickly become overwhelming.
Many agricultural biotechnology companies still rely on traditional spreadsheets and fragmented reporting systems. As a result, decision-makers struggle to monitor research performance, evaluate crop results, and track financial outcomes efficiently.
This is exactly where the Agri-Biotech Dashboard in Power BI becomes a game-changing solution.
The Agri-Biotech Dashboard in Power BI is a powerful business intelligence tool designed to help organizations monitor biotechnology research investments, analyze crop performance, track regulatory approvals, evaluate vendor contributions, and measure profitability trends. Because Power BI provides dynamic visualizations and interactive filtering capabilities, users can easily transform complex biotechnology datasets into meaningful insights.
With this ready-to-use dashboard, organizations can monitor biotechnology performance from multiple perspectives including crop analysis, trial phase performance, vendor evaluation, and monthly financial trends.
🌱 Key Feature of Agri-Biotech Dashboard in Power BI
The dashboard is designed with five powerful analytical pages, each providing deep insights into biotechnology research and agricultural performance.
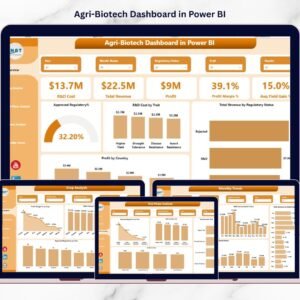
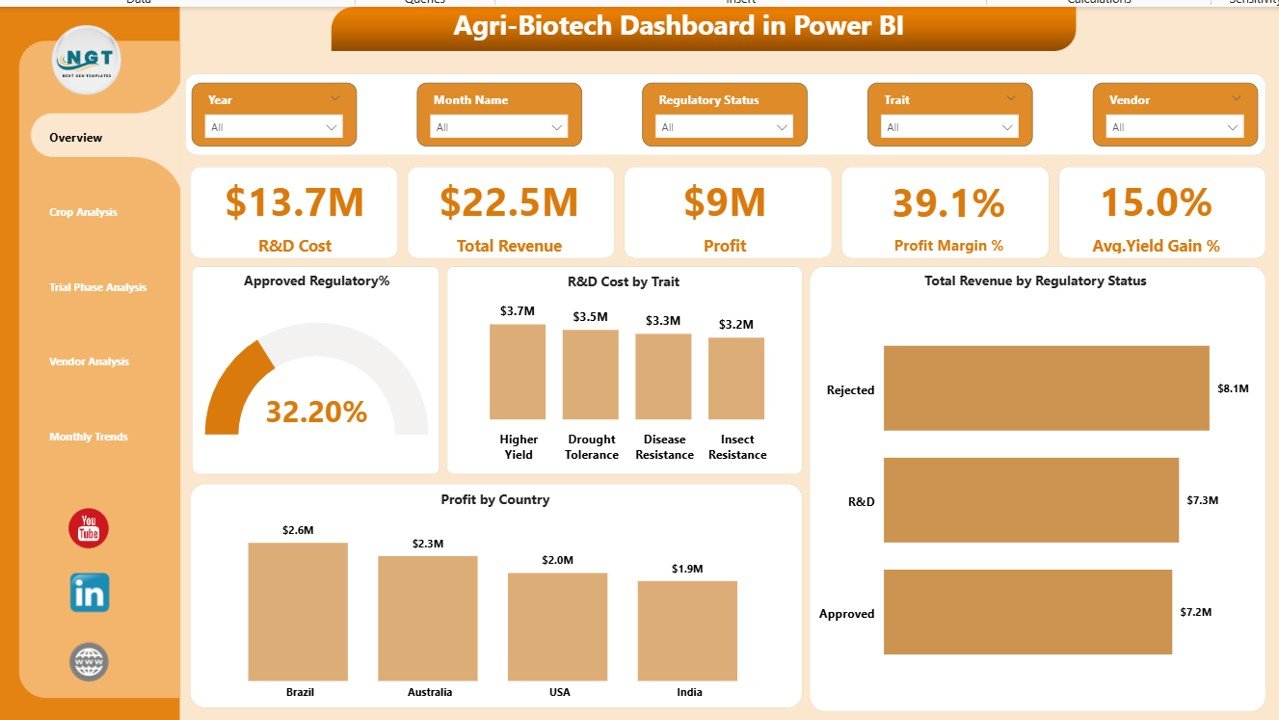
📊 Interactive Overview Page
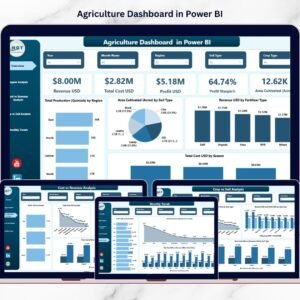
Provides a complete snapshot of biotechnology operations including R&D investment, total revenue, profit, profit margin percentage, and average yield gain percentage.
💰 Financial Performance Tracking
Monitor total revenue, profit, and profit margin trends generated from biotech crop innovations.
🧬 Crop-Level Performance Insights
Identify which crops generate the highest profits, require the most research investment, and achieve the strongest regulatory approvals.
🔬 Trial Phase Monitoring
Evaluate biotechnology experiments and research trials to identify successful genetic traits and reduce regulatory rejection risks.
🏢 Vendor Contribution Analysis
Analyze vendor performance based on research investment, regulatory success, revenue contribution, and yield improvements.
📅 Monthly Performance Monitoring
Track biotechnology performance trends over time including monthly research investments, regulatory approvals, revenue, and profitability.
📈 Interactive Power BI Visualizations
All charts are interactive and allow users to filter data dynamically using slicers.
🚀 Real-Time Decision Support
Managers and executives can instantly evaluate research performance and financial outcomes.
📊 Strategic Research Investment Insights
The dashboard helps organizations allocate research budgets more effectively.
📦 What’s Inside the Agri-Biotech Dashboard in Power BI
This digital product includes a fully designed Power BI dashboard file that allows organizations to monitor agricultural biotechnology analytics efficiently.
The dashboard contains five detailed analytical pages:
1️⃣ Overview Page
Displays five KPI cards including:
-
R&D Cost
-
Total Revenue
-
Profit
-
Profit Margin %
-
Average Yield Gain %
The page also includes charts such as:
-
Approved Regulatory %
-
R&D Cost by Trait
-
Total Revenue by Regulatory Status
-
Profit by Country
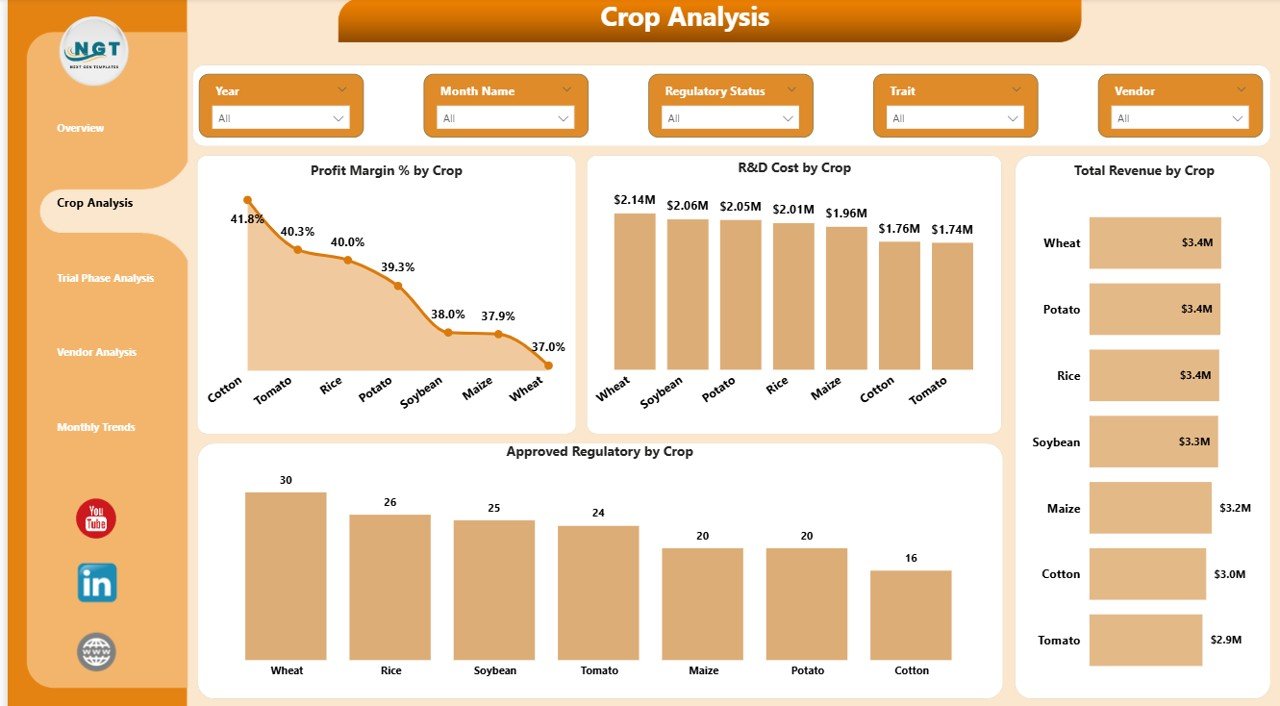
2️⃣ Crop Analysis Page
Analyze crop performance using visualizations such as:
-
Profit Margin % by Crop
-
R&D Cost by Crop
-
Total Revenue by Crop
-
Approved Regulatory % by Crop
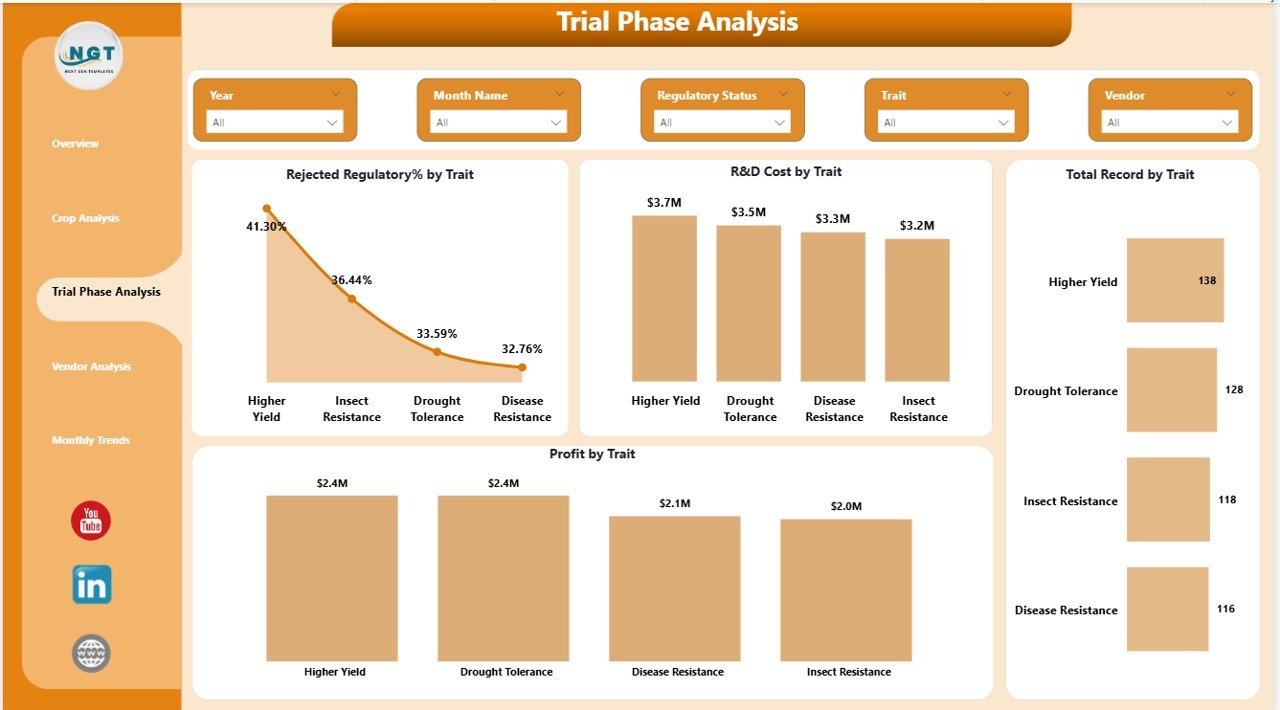
3️⃣ Trial Phase Analysis Page
Evaluate biotechnology experiments through charts like:
-
Rejected Regulatory % by Trait
-
R&D Cost by Trait
-
Total Records by Trait
-
Profit by Trait
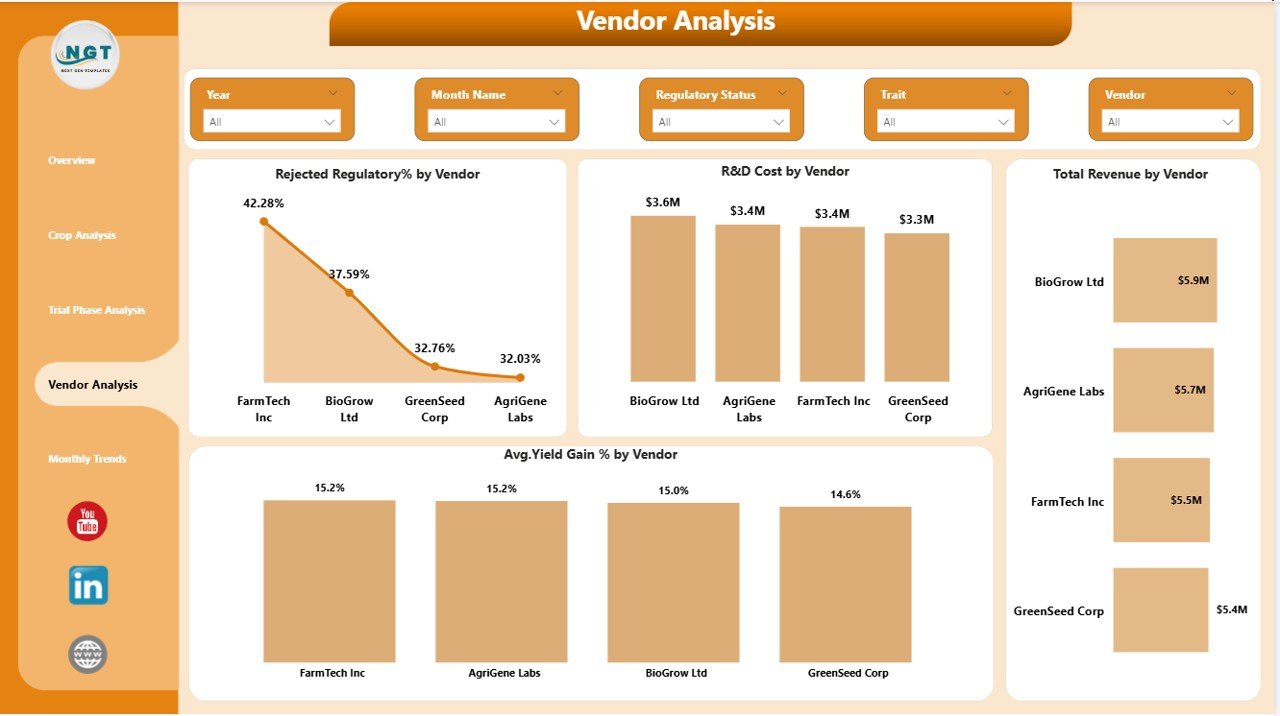
4️⃣ Vendor Analysis Page
Monitor vendor contributions using charts such as:
-
Rejected Regulatory % by Vendor
-
R&D Cost by Vendor
-
Total Revenue by Vendor
-
Average Yield Gain % by Vendor
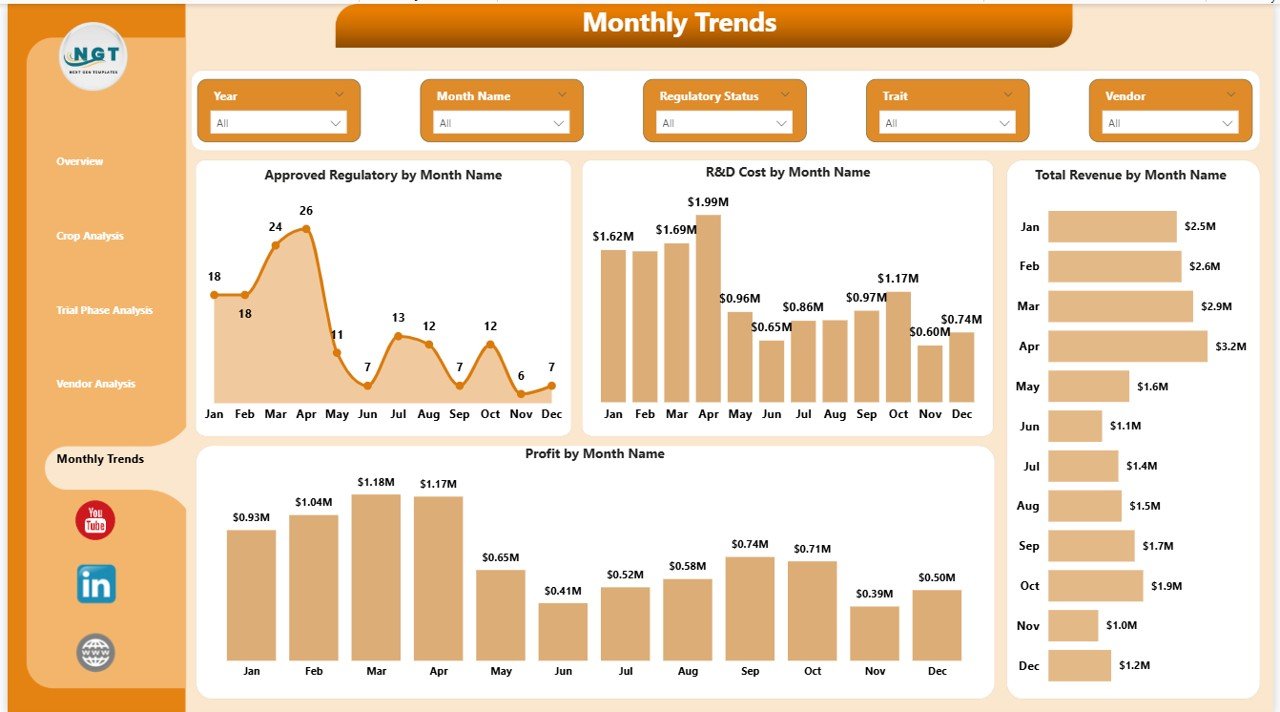
5️⃣ Month Analysis Page
Track biotechnology performance over time with charts including:
-
Approved Regulatory % by Month
-
R&D Cost by Month
-
Total Revenue by Month
-
Profit by Month
These pages provide a complete analytical view of biotechnology operations.
⚙️ How to Use the Agri-Biotech Dashboard in Power BI
Using this dashboard is simple and requires only a few steps.
Step 1 – Prepare Your Data
Collect biotechnology research data including crop trials, financial performance, vendor contributions, and regulatory outcomes.
Step 2 – Import Data into Power BI
Connect your Excel dataset to the Power BI dashboard file.
Step 3 – Refresh the Dashboard
Power BI automatically updates charts and KPIs once data is refreshed.
Step 4 – Use Interactive Filters
Apply slicers and filters to explore insights by crop, vendor, month, or regulatory status.
Step 5 – Analyze Insights for Decision-Making
Use visual insights to improve research investments, select the best crops, and strengthen vendor partnerships.
👨🌾 Who Can Benefit from This Agri-Biotech Dashboard
This dashboard is extremely useful for professionals working in agricultural biotechnology and research.
🌱 Agricultural Biotechnology Companies
📊 Agribusiness Analysts
🧬 Research & Development Teams
📈 Business Intelligence Professionals
🏛 Government Agriculture Departments
📉 Data Scientists and Analysts
🌾 Agricultural Research Institutes
💼 Strategy and Innovation Teams
Organizations that adopt this dashboard can significantly improve data-driven decision-making, research efficiency, and biotechnology innovation.
Click here to read the Detailed blog post
Watch the step-by-step video tutorial:
Visit our YouTube channel to learn step-by-step video tutorials
👉 YouTube Channel: https://youtube.com/@PKAnExcelExpert